Nickel oxide nanostructured electrodes towards perylenediimide-based dye-sensitized solar cells
Sebastian
Feihl
a,
Rubén D.
Costa
a,
Stephan
Pflock
a,
Cordula
Schmidt
b,
Jörg
Schönamsgruber
b,
Susanne
Backes
b,
Andreas
Hirsch
b and
Dirk M.
Guldi
*a
aFriedrich-Alexander-University Erlangen-Nuremberg, Department of Chemistry and Pharmacy, Chair of Physical Chemistry I, Egerlandstr. 3, 91058 Erlangen, Germany. E-mail: guldi@chemie.uni-erlangen.de
bFriedrich-Alexander-University Erlangen-Nuremberg, Department of Chemistry and Pharmacy, Chair of Organic Chemistry II, Henkestr. 42, 91054 Erlangen, Germany.
First published on 19th October 2012
Abstract
In this work, we have realized nickel oxide (NiO) electrodes that serve as photocathodes in p-type dye-sensitized solar cells (p-DSSCs) sensitized by dendronized perylenediimides (PDIs). To this end, two different approaches in terms of preparing NiO nanoparticle pastes were pursued to fabricate mesoporous electrodes on conductive fluorine doped tin oxide (FTO) glass substrates. Firstly, commercially available NiO nanoparticles were dispersed in a mixture of ethanol and terpineol. Here, in order to obtain a mesoporous network two types of ethylcelluloses (EC), that is, EC 5–15 and 30–50 mPa s, were added in 1![[thin space (1/6-em)]](https://www.rsc.org/images/entities/char_2009.gif) :
:![[thin space (1/6-em)]](https://www.rsc.org/images/entities/char_2009.gif) 1 weight ratios. Following the evaporation of ethanol, the resulting pastes were spread on FTOs by doctor blading and calcinated at different temperatures. Importantly, the calcination temperature evolved as a crucial aspect in developing efficient electrodes. Nevertheless, the visual appearance of these NiO electrodes prompts a fairly heterogeneous coverage. To circumvent the aforementioned problem, a second approach en route to homogenous electrodes was investigated. In that particular case, commercial NiO nanoparticles were mixed with a mixture of EC 5–15 and 30–50 mPa s at a 1
1 weight ratios. Following the evaporation of ethanol, the resulting pastes were spread on FTOs by doctor blading and calcinated at different temperatures. Importantly, the calcination temperature evolved as a crucial aspect in developing efficient electrodes. Nevertheless, the visual appearance of these NiO electrodes prompts a fairly heterogeneous coverage. To circumvent the aforementioned problem, a second approach en route to homogenous electrodes was investigated. In that particular case, commercial NiO nanoparticles were mixed with a mixture of EC 5–15 and 30–50 mPa s at a 1![[thin space (1/6-em)]](https://www.rsc.org/images/entities/char_2009.gif) :
:![[thin space (1/6-em)]](https://www.rsc.org/images/entities/char_2009.gif) 1 weight ratio, with triacetin as a plasticizer in ethanol. In doing so, pastes containing 7 wt% EC, 3 wt% triacetin, and 3 to 20 wt% NiO nanoparticles were prepared. Most importantly, scanning electron microscopy (SEM) images corroborated the fact that the resulting electrodes revealed a dense coverage on FTOs. In addition, further characterizations ranging from UV/Vis transmission spectroscopy and conductivity measurements to Barrett–Joyner–Halenda (BJH) pore size and volume analysis were carried out. In the final step, the applicability of the new NiO photoelectrodes for p-DSSCs was successfully demonstrated by utilizing two types of PDIs, namely a symmetric 1 and a non-symmetric dendronized 2. Key aspects such as time dependence of dye uptake, hole lifetime and resistance features of the electrodes under operation conditions were investigated.
1 weight ratio, with triacetin as a plasticizer in ethanol. In doing so, pastes containing 7 wt% EC, 3 wt% triacetin, and 3 to 20 wt% NiO nanoparticles were prepared. Most importantly, scanning electron microscopy (SEM) images corroborated the fact that the resulting electrodes revealed a dense coverage on FTOs. In addition, further characterizations ranging from UV/Vis transmission spectroscopy and conductivity measurements to Barrett–Joyner–Halenda (BJH) pore size and volume analysis were carried out. In the final step, the applicability of the new NiO photoelectrodes for p-DSSCs was successfully demonstrated by utilizing two types of PDIs, namely a symmetric 1 and a non-symmetric dendronized 2. Key aspects such as time dependence of dye uptake, hole lifetime and resistance features of the electrodes under operation conditions were investigated.
Introduction
The steady depletion of fossil fuels, on one hand, and the increasing energy demand caused by the continually growing world population, the steadily growing economics, and the imminent collapse of the world's ecology, on the other hand, will lead unequivocally to social and economical conflicts. As a matter of fact, a myriad of reasons points to the need for environmentally friendly and low cost energy supplies.1–3 Here, the sun has great potential. The amount of energy at zero costs and at continuous delivery that reaches the earth's surface during one hour is more than enough to cover the world's current energy demand for an entire year. Considering this, photovoltaic devices have emerged as a superior solution for future energy supply.2,4,5During the past few decades, groups all around the world have focused on research in the areas of silicon solar cells or of more recent solar cell technologies, that is, quantum dots, inorganic thin films, organic polymers, and dye-sensitized transparent semiconducting films.6–17 In particular, the latter, known as dye-sensitized solar cells (DSSCs), constitute a very promising path due to the low material costs, facile fabrication, and remarkable performance. The focus of interest on DSSCs has continuously risen since 1991 when efficiencies of 7% were reported.18 Up to now, after continuous optimization, efficiencies around 11–13% are state-of-the-art,19 which is still quite moderate when compared to the benchmark of 25% for monocrystalline silicon based solar cells.19–23 A major disadvantage in DSSCs is the significant recombination process, which hampers higher efficiencies.24–27 Nevertheless, the use of cheap materials and facile fabrication render DSSCs an attractive alternative for photovoltaic power generation. In fact, the latter underlines the importance of establishing new concepts with respect to DSSC components such as electrodes, electrolytes, dyes, etc., on the one hand, and with respect to the overall cell assembly, on the other hand.20
In addition to the above, one approach that seems to be particularly promising involves tandem DSSCs (t-DSSC).28–30 Typically, such device configurations are based on two types of dyes, which absorb in complementary regions of the solar spectrum, and, which are integrated onto separate mesoporous semiconducting materials, that is, n-type and p-type metal oxide based electrodes. In particular, the n-type semiconductor (i.e. TiO2 and ZnO) collects electrons injected from the photoexcited electron donating dyes (SD*) into their conduction bands (cb). Upon injection into the external circuit, where electrical work is performed, the electrons re-enter the tandem device and recombine with holes. This hole represents the current generated on the p-type semiconductor. NiO is one of the most commonly used materials for mesoporous p-type electrodes. Electron accepting dyes, which are photoexcited (SA*), withdraw electrons form the p-type valence bands (vb) leaving holes in the electrode. Finally, the circuit is closed using a redox couple (i.e. I−/I3−). The latter mediates charges between the two photoactive electrodes. In t-DSSCs, the open-circuit voltage (Voc) is one of the most important factors to determine the cell efficiencies. Voc represents the sum of the single Vocs of the two photoelectrodes in relation to the potential of the redox couple. In other words, the Fermi levels Ef near the cb of the n-type semiconductor and the vb of the p-type semiconductor are detrimental.
Recent results have shown that the efficiency in t-DSSCs is only 2.42% and, as such, represents underperformance of highly efficient n-type DSSCs (n-DSSCs).28 Great potential lies in developing new dyes and optimizing p-type DSSCs (p-DSSCs). The modus operandi for a p-DSSC is sketched in Scheme 1. Encouraged by recent results, we decided to fabricate NiO based p-DSSCs. In particular, two different approaches are presented en route towards semitransparent p-type NiO mesoporous electrodes for perylene based p-DSSCs. Le Pleux et al. demonstrated recently that perylenemonoimides (PMIs) revealed a fairly decent performance as electron accepting dyes in p-DSSCs.31 In the current work, we used perylenediimides (PDIs) 1 and 2 (Fig. 1). Notably, PDIs show superior acceptor properties, although their synthesis is rather challenging.32–36 The major thrust of our work is to establish a new procedure for NiO electrode fabrication by means of using PDIs. To the best of our knowledge, PDIs 1 and 2 have never been studied in NiO-based p-DSSCs yet.35,37–41
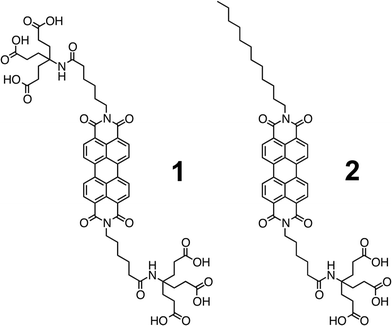 | ||
| Fig. 1 Electron accepting perylenediimides (PDIs) 1 and 2, which are symmetrically and non-symmetrically equipped with 1G-dendrons of the Newkone-type, respectively. | ||
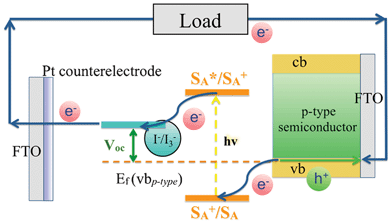 | ||
| Scheme 1 Basic operation principle of photocathodes in p-type dye sensitized solar cells (p-DSSC). | ||
Experimental
Considering the manufacture of mesoporous NiO electrodes, two different approaches were investigated. Firstly, a procedure already published in the literature was followed.28 The latter consists of a mixture of commercially available NiO nanoparticle powder (<50 nm, Aldrich) and 0.53 g of two types of ethylcellulose (i.e. 5–15 mPa s and 30–50 mPa s, 1![[thin space (1/6-em)]](https://www.rsc.org/images/entities/char_2009.gif) :
:![[thin space (1/6-em)]](https://www.rsc.org/images/entities/char_2009.gif) 1 weight ratio, Sigma-Aldrich) that were dispersed in 8 ml ethanol (>99.5%, VWR) using ultrasonication. Finally, 13.5 ml terpineol (purum, mixture of isomers, Fluka) was added and ethanol was slowly evaporated. The amount of NiO nanoparticles was 10, 15, 20, and 30 wt%. Prior to the deposition, FTOs were cleaned beginning with isopropanol, followed by 0.1 M hydrochloric acid solution, tenside solution (HERMA, Germany), and, finally, isopropanol. The resulting highly viscous terpineol pastes were spread by the doctor blade technique onto conductive fluorine doped tin oxide glass substrates (FTO, Pilkington TEC 8, 7–9 Ω/square, XOP Glass). After deposition, the films were dried on a hot plate by increasing the temperature in 10 °C intervals between 70 and 130 °C. The temperature was maintained for 15 min. Finally, the films were calcinated at 3 °C min−1 in a tube oven at different temperatures. The influence of different calcination temperatures was investigated by treating the films at variable temperatures, namely 300, 400, 500, and 600 °C. In a second approach, NiO nanoparticle powder (<50 nm, Aldrich) was mixed with ethylcellulose (i.e. 5–15 mPa s, 30–50 mPa s, 1
1 weight ratio, Sigma-Aldrich) that were dispersed in 8 ml ethanol (>99.5%, VWR) using ultrasonication. Finally, 13.5 ml terpineol (purum, mixture of isomers, Fluka) was added and ethanol was slowly evaporated. The amount of NiO nanoparticles was 10, 15, 20, and 30 wt%. Prior to the deposition, FTOs were cleaned beginning with isopropanol, followed by 0.1 M hydrochloric acid solution, tenside solution (HERMA, Germany), and, finally, isopropanol. The resulting highly viscous terpineol pastes were spread by the doctor blade technique onto conductive fluorine doped tin oxide glass substrates (FTO, Pilkington TEC 8, 7–9 Ω/square, XOP Glass). After deposition, the films were dried on a hot plate by increasing the temperature in 10 °C intervals between 70 and 130 °C. The temperature was maintained for 15 min. Finally, the films were calcinated at 3 °C min−1 in a tube oven at different temperatures. The influence of different calcination temperatures was investigated by treating the films at variable temperatures, namely 300, 400, 500, and 600 °C. In a second approach, NiO nanoparticle powder (<50 nm, Aldrich) was mixed with ethylcellulose (i.e. 5–15 mPa s, 30–50 mPa s, 1![[thin space (1/6-em)]](https://www.rsc.org/images/entities/char_2009.gif) :
:![[thin space (1/6-em)]](https://www.rsc.org/images/entities/char_2009.gif) 1 weight ratio, Sigma-Aldrich) in ethanol. After slow stirring for 2 days, triacetin (99%, Sigma-Aldrich) was added as a plasticizer. Finally, five pastes were at hand, all containing 7 wt% ethylcellulose and 3 wt% plasticizer but different amounts of NiO nanoparticles, namely 3, 5, 10, 15, and 20 wt%. All pastes were spread onto FTO slides by the aforementioned technique. Notably, the fast evaporation of the solvent eliminated the need for the drying step for the ethanol based pastes. In fact, the calcination temperature was adjusted to 400 °C, based on the calcination results of the films of the terpineol approach. Next, the impact of nanoparticle amount and paste composition on a number of key film properties, such as coverage, height, porosity and conductivity, were investigated. Here, field emission scanning electron microscopy (FESEM, Zeiss Gemini Ultra 55) was performed for all of the films. The latter was meant to provide an insight into the film nanoscale morphology. This was complemented by profilometry (KLA Tencor Alpha Step D-100 Stylus), conductivity (Jandel H-L 4-point-probe, Keithley 2400), and Barrett–Joyner–Halenda (BJH) pore size and volume analysis (Nova 4200E, Quantachrome Instruments). The BJH analyses were performed with the different NiO powders to characterize the nanoparticle properties. In this context, films based on ethanol pastes containing 5, 10, and 15 wt% NiO nanoparticles were prepared on microscope glass as substrates and calcinated at 400 °C. In the final step, the resulting films were scratched off and the obtained powders were analyzed.
1 weight ratio, Sigma-Aldrich) in ethanol. After slow stirring for 2 days, triacetin (99%, Sigma-Aldrich) was added as a plasticizer. Finally, five pastes were at hand, all containing 7 wt% ethylcellulose and 3 wt% plasticizer but different amounts of NiO nanoparticles, namely 3, 5, 10, 15, and 20 wt%. All pastes were spread onto FTO slides by the aforementioned technique. Notably, the fast evaporation of the solvent eliminated the need for the drying step for the ethanol based pastes. In fact, the calcination temperature was adjusted to 400 °C, based on the calcination results of the films of the terpineol approach. Next, the impact of nanoparticle amount and paste composition on a number of key film properties, such as coverage, height, porosity and conductivity, were investigated. Here, field emission scanning electron microscopy (FESEM, Zeiss Gemini Ultra 55) was performed for all of the films. The latter was meant to provide an insight into the film nanoscale morphology. This was complemented by profilometry (KLA Tencor Alpha Step D-100 Stylus), conductivity (Jandel H-L 4-point-probe, Keithley 2400), and Barrett–Joyner–Halenda (BJH) pore size and volume analysis (Nova 4200E, Quantachrome Instruments). The BJH analyses were performed with the different NiO powders to characterize the nanoparticle properties. In this context, films based on ethanol pastes containing 5, 10, and 15 wt% NiO nanoparticles were prepared on microscope glass as substrates and calcinated at 400 °C. In the final step, the resulting films were scratched off and the obtained powders were analyzed.
At the end, the electrodes were immersed into dye solutions of the two different PDIs (1 and 2), which were dissolved in methanol (99.5%, Merck) by ultrasonic treatment. The synthesis of 1 and 2, which are symmetrically and non-symmetrically equipped with 1G-dendrons of the Newkone-type, has already been described in the literature.36 The final DSSCs were fabricated with a platinum covered FTO slide as a counter electrode. The counter electrode was made by dropping 5 mM chloroplatinic acid (H2PtCl6, Pt 38%, Aldrich) in isopropanol onto predrilled and already cleaned FTO substrates. A simple iodine/triiodine based electrolyte consisting of 1.0 M LiI (purum ≥98%, Fluka Chimika) and 0.2 M I2 (≥99.5%, Merck) in acetonitrile was used. Photocurrents (J vs. V) were measured under 1.5 AM standard conditions. Soaking time as a function of efficiency gave an overview about successful dye uploading onto the mesoporous layers.
Steady state absorption and fluorescence spectroscopy of both PDIs in MeOH were performed on a Perkin Elmer Lambda 35 UV/Vis absorption spectrometer and a Horiba Fluoromax 3 spectrofluorometer, respectively. Transmission spectroscopy was carried out with a Varian Cary 5000 UV/Vis/NIR spectrometer.
Electrochemical Impedance Spectroscopy (EIS) was carried out with a potentiostat/galvanostat (PGSTAT30, Autolab) equipped with a Frequency Response Analyzer module (FRA). Measurements were performed at the respective open-circuit voltage of the different photocathodes, under AM 1.5 conditions (100 mW cm−2). The AC signal amplitude was set at 5 mV and modulated in a frequency range from 0.01 to 100 kHz.
Results and discussion
Fabrication and characterization of NiO electrodes
The electrode morphology is a crucial factor to achieve high performance in DSSCs.7,42–44 Hence, manufacturing suitable films is a primary concern towards efficient p-type NiO DSSCs. Two approaches were carried out to fabricate high quality mesoporous films—see experimental section. Firstly, an already published terpineol based procedure was followed.28 In order to test the film fabrication, different calcination temperatures were studied. In particular, the calcination temperature of the films made out of the 15 wt% terpineol paste was varied from 300 to 600 °C in 100 °C steps (Fig. 2). From the corresponding SEM images it is discernible that the best coverage on FTO slides was realized at a calcination temperature of 400 °C (Fig. 2b).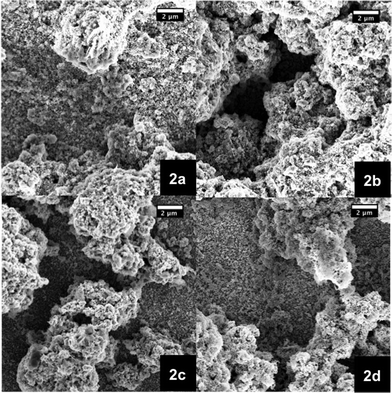 | ||
| Fig. 2 SEM images of NiO photoelectrodes made from pastes based on terpineol as a solvent and 15 wt% NiO nanoparticles. The films were calcinated at different temperatures, namely 300 (2a), 400 (2b), 500 (2c), and 600 °C (2d). | ||
Importantly, the resulting films give rise to well interconnected 3D networks, which are a prerequisite for good solar cell performances. The recombination processes between the FTO and the electrolyte are prevented, due to effective coverage of the conductive glass substrate by NiO.26 Nevertheless, the quality of the fabricated films is at best heterogeneous.
For example, due to the rapid solvent evaporation at room temperature, and especially during the drying process on the hot plate, the nanoparticles of the terpineol pastes form agglomerates—see experimental section. This is rather distinct in the central part of the films. To achieve more homogeneous films, a second paste fabrication, that is a mixture of ethylcellulose in ethanol as the solvent and triacetin as a plasticizer, was carried out.45 Here, the resulting films appear as smoothly and completely covered surfaces. This observation was made for all of the different amounts of NiO nanoparticles, which ranged from 3 to 20 wt%.
Additional corroboration comes from SEM images of the 5, 10, and 15 wt% films (Fig. 3). With increasing amount of NiO nanoparticles the coverage of the FTO is improved. In particular, pastes from 10 wt% upward led to enclosed and homogenous layers (Fig. 3c and 3d). Fig. 4 presents, on the one hand, NiO electrodes next to each other, ranging from the lowest weight percentage of 3 to 20 wt%. However, the film transparency is reduced due to increasing thickness. This seems to correlate with greater numbers of nanoparticles inside the ethanol pastes (Table 1). Fig. 5 documents, on the other hand, the results from transmission spectroscopy. This gives clear evidence for the lower transparency as a function of increasing nanoparticle content in the ethanol/ethylcellulose/triacetin pastes. As shown in Table 1, complementary profilometric and BJH data confirms that the thickness indeed goes hand in hand with the number of nanoparticles. A striking observation is that attributes such as surface area, pore size, and pore volume are not influenced by the number of NiO nanoparticles in the ethanol pastes and remain nearly constant. In other words, BJH substantiates the lack of appreciable agglomeration or growing of nanoparticles that change their size.
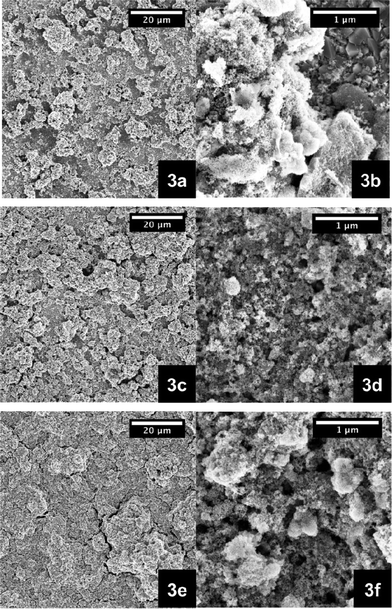 | ||
Fig. 3 SEM images of NiO photoelectrodes made from pastes that are based on ethanol/ethylcellulose (5–15 mPa s and 30–50 mPa s, 1![[thin space (1/6-em)]](https://www.rsc.org/images/entities/char_2009.gif) : :![[thin space (1/6-em)]](https://www.rsc.org/images/entities/char_2009.gif) 1)/triacetin containing different weight percentages of NiO nanoparticles, that is 5 wt% (a, b), 10 wt% (c, d), and 15 wt% (e, f). 1)/triacetin containing different weight percentages of NiO nanoparticles, that is 5 wt% (a, b), 10 wt% (c, d), and 15 wt% (e, f). | ||
 | ||
| Fig. 4 NiO photoelectrodes made from pastes containing different weight percentages (wt%) of NiO nanoparticles, calcinated at 400 °C—from left to right 3 wt%, 5 wt%, 10 wt%, 15 wt%, and 20 wt%. | ||
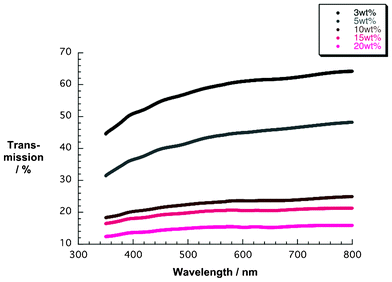 | ||
| Fig. 5 Transmission spectra of NiO photoelectrodes made from pastes containing different weight percentages (wt%) of NiO nanoparticles. | ||
| Nanoparticle/wt% | Thickness/μm | BJH | ||
|---|---|---|---|---|
| Surface area/m2 g−1 | Pore volume/cc g−1 | Pore radius/nm | ||
| 3 | 2.29 | — | — | — |
| 5 | 3.18 | 66.62 | 0.236 | 41.76 |
| 10 | 6.08 | 67.17 | 0.231 | 30.14 |
| 15 | 7.23 | 61.05 | 0.252 | 30.05 |
| 20 | 8.35 | — | — | — |
Therefore, we conclude that the thickness of the resulting electrodes is only influenced by the nanoparticle amount. In order to complete the characterization of the electrodes, conductivity measurements were carried out (Fig. 6). The results were obtained from two complete sets of NiO electrodes that were all fabricated with ethanol pastes with varying nanoparticle contents, that is, from 3 to 20 wt%. The values are in line with those reported for NiO nanoparticles of similar size.46 In our films, the conductivity drops continuously as the electrode thickness increases. The latter correlates with the number of NiO nanoparticles in the pastes. It is well known that generated charges are transported between interconnected nanoparticles in metal oxide semiconductors.47–50 In the particular case of NiO nanoparticles, Ni2+ vacancies contribute to the charge transport.46,51
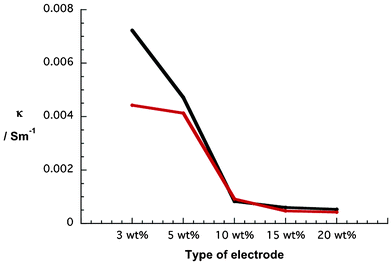 | ||
| Fig. 6 Conductivity of two series of NiO photoelectrodes made from pastes containing different weight percentages (wt%) of NiO nanoparticles—Series A (black) and Series B (red). | ||
However, charges flow along nanoparticle surfaces and, as such, the presence of more nanoparticles evokes more boundaries and, in turn, more traps, where recombination processes are favored.47 We hypothesize that the latter is the predominant reason for conductivity through NiO electrodes that scales inversely with the thickness.
Performance of NiO electrodes in p-DSSCs
Table 2 summarizes the device performances of both types of NiO electrode. All of the NiO films were soaked for 2 h in a 1 × 10⁻⁵ M methanol solution of 1. For cells, which are based on the second type of electrode, the open-circuit voltage (Voc) and short-circuit current density (Jsc) values increase, reaching a maximum for electrodes based on 10 wt% NiO. At higher amounts of NiO content, Voc and Jsc, and, as a consequence, the cell efficiencies decrease. The aforementioned results imply a balance between film thickness, on one hand, which increases as a function of nanoparticles, and, on the other hand, film transparency, which obstructs the light harvesting features of the dye. In fact, the conductivity measurements—vide supra—shed further light onto these correlations. Please note that a lower conductivity, as evolves for thicker electrodes, is detrimental in terms of the overall DSSC performance. As already emphasized, the presence of more and more surface traps disrupts the effective electron transport through NiO electrodes. Finally, the device data provide the definitive corroboration of the electrode characterization. Evaluating the results, the best efficiencies of 0.0138% are realized for electrodes based on the ethanol/ethylcellulose/triacetin approach with a 10 wt% content of NiO nanoparticles.| Electrode | V oc/Vc | J sc/μA cm−2d | FFe | η/%f |
|---|---|---|---|---|
| a E = ethanol based pastes. b T = terpineol based pastes. c V oc = open- circuit voltage. d J sc = short-circuit current density. e FF = fill factor. f η = efficiency. | ||||
| E 3 wt%a | 0.060 | 363 | 0.37 | 0.0081 |
| E 5 wt% | 0.058 | 505 | 0.36 | 0.0106 |
| E 10 wt% | 0.070 | 600 | 0.33 | 0.0138 |
| E 15 wt% | 0.059 | 483 | 0.35 | 0.0090 |
| E 20 wt% | 0.052 | 490 | 0.27 | 0.0069 |
| T 10 wt%b | 0.062 | 388 | 0.33 | 0.0079 |
| T 20 wt% | 0.059 | 535 | 0.32 | 0.0102 |
| T 30 wt% | 0.059 | 506 | 0.32 | 0.0096 |
To provide more comprehensive insights, additional pastes based on the terpineol approach containing 10, 20, and 30 wt% NiO were prepared and employed to fabricate p-DSSCs (Table 2). p-DSSCs with electrodes based on terpineol pastes fabricated with 10 wt% NiO show much poorer performances than those based on ethanol. When the NiO content is increased up to 20 wt%, the performance increases in parallel. However, the device features are always poorer with the terpineol based electrodes. Hence, our data infers that ethanol pastes generally result in photoelectrodes that feature a superior performance in p-DSSCs relative to pastes made out of terpineol. Obviously, the homogeneity of the NiO layers is crucial to realize maximum device performance. In the case of terpineol pastes, the agglomeration of the nanoparticles in the central part of the layers during the drying process is clearly detrimental for overall device performance.
Evaluating PDIs 1 and 2 as suitable dyes for NiO p-DSSCs
In light of the aforementioned fact, that is, electrodes based on an ethanol paste with 10 wt% NiO nanoparticles revealed the best p-DSSC performances, further characterizations were carried out. In particular, we probed the correlation between dye uptake and device performance. To establish the best conditions for dye uptake, different NiO photocathodes (i.e. 5, 10, and 15 wt%) were immersed into methanol solutions of 1 and 2 for different time periods ranging from 0.5 up to 6 h. Table 3 documents the fact that the DSSC key factors, such as Voc, Jsc, and efficiency, are strongly influenced by the soaking time. All of the different electrodes unraveled similar trends in terms of Voc and Jsc. In the case of devices with 1, Voc steadily increases, while Jsc plateaus around 3 h, before decreasing towards longer soaking times. A parallel trend, namely maximum efficiency at 3 h dye uptake, emerges for all of the aforementioned electrodes. Next, the time dependent DSSC performance was revisited for 2. The results are summarized in Table 4. Here, trends related to Voc and Jsc resemble those mentioned for 1. To conclude, time dependent DSSC efficiencies are similar for both dyes, regardless of the type of NiO photocathode (Fig. 7).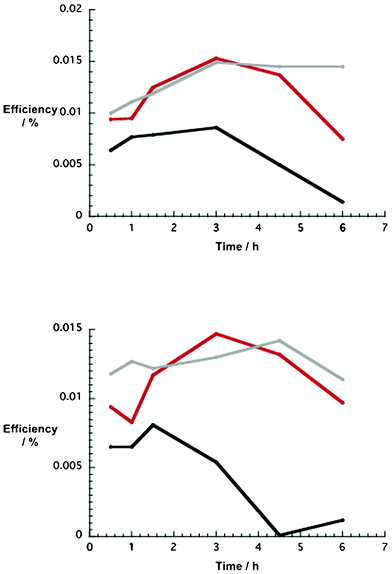 | ||
| Fig. 7 Upper part: time dependence of p-type NiO DSSC efficiencies (1) as a function of number of NiO nanoparticles (wt%) in the ethanol based pastes (5 wt% = black, 10 wt% = red, 15 wt% = grey). Lower part: time dependence of p-type NiO DSSC efficiencies (2) as a function of number of NiO nanoparticles (wt%) in the ethanol based pastes (5 wt% = black, 10 wt% = red, 15 wt% = grey). | ||
| Electrode | Time/h | V oc/V | J sc/μA cm−2 | FF | η/% |
|---|---|---|---|---|---|
| 5 wt% | 0.5 | 0.077 | 235 | 0.36 | 0.0064 |
| 1 | 0.078 | 274 | 0.36 | 0.0077 | |
| 1.5 | 0.077 | 266 | 0.39 | 0.0079 | |
| 3 | 0.087 | 283 | 0.35 | 0.0086 | |
| 4.5 | 0.102 | 152 | 0.32 | 0.0050 | |
| 6 | 0.110 | 43 | 0.30 | 0.0014 | |
| 10 wt% | 0.5 | 0.068 | 401 | 0.34 | 0.0094 |
| 1 | 0.072 | 393 | 0.34 | 0.0095 | |
| 1.5 | 0.068 | 532 | 0.35 | 0.0125 | |
| 3 | 0.073 | 607 | 0.34 | 0.0153 | |
| 4.5 | 0.073 | 552 | 0.34 | 0.0137 | |
| 6 | 0.082 | 287 | 0.32 | 0.0075 | |
| 15 wt% | 0.5 | 0.061 | 517 | 0.32 | 0.0100 |
| 1 | 0.066 | 498 | 0.34 | 0.0111 | |
| 1.5 | 0.067 | 522 | 0.34 | 0.0119 | |
| 3 | 0.074 | 585 | 0.35 | 0.0149 | |
| 4.5 | 0.071 | 609 | 0.34 | 0.0145 | |
| 6 | 0.076 | 551 | 0.35 | 0.0145 |
| Electrode | Time/h | V oc/V | J sc/μA cm−2 | FF | η/% |
|---|---|---|---|---|---|
| 5 wt% | 0.5 | 0.074 | 248 | 0.36 | 0.0065 |
| 1 | 0.081 | 227 | 0.35 | 0.0065 | |
| 1.5 | 0.073 | 316 | 0.35 | 0.0081 | |
| 3 | 0.089 | 172 | 0.36 | 0.0054 | |
| 4.5 | 0.084 | 6 | 0.23 | 0.0001 | |
| 6 | 0.103 | 40 | 0.29 | 0.0012 | |
| 10 wt% | 0.5 | 0.067 | 428 | 0.33 | 0.0094 |
| 1 | 0.078 | 322 | 0.33 | 0.0083 | |
| 1.5 | 0.065 | 528 | 0.34 | 0.0117 | |
| 3 | 0.073 | 587 | 0.35 | 0.0147 | |
| 4.5 | 0.070 | 546 | 0.34 | 0.0132 | |
| 6 | 0.068 | 444 | 0.32 | 0.0097 | |
| 15 wt% | 0.5 | 0.065 | 538 | 0.34 | 0.0118 |
| 1 | 0.072 | 531 | 0.33 | 0.0127 | |
| 1.5 | 0.069 | 549 | 0.32 | 0.0122 | |
| 3 | 0.070 | 568 | 0.33 | 0.0130 | |
| 4.5 | 0.071 | 578 | 0.35 | 0.0142 | |
| 6 | 0.067 | 534 | 0.32 | 0.0114 |
The trends in efficiency are rationalized upon considering the behavior of 1 and 2 in solution. Owing to their extended π-system, perylenediimides tend to aggregate, affording H- and J-aggregates.33,52 The lack of bulky substituents in 1 and 2 further augments this trend. In fact, aggregates are already observed at concentrations as low as 1 × 10⁻⁷ M.34,36 Evidence for the latter is borrowed from the steady-state absorption and fluorescence spectra of 1 and 2 that were recorded in 1 h intervals up to 10 h. As a representative example, the spectroscopic characteristics of 1 are presented in Fig. 8. In the absorption spectra of 1, three characteristic PDI transitions are at a maximum in the range 480–600 nm. The fact that the most intense transitions are located at 521 and 520 nm for 1 and 2, respectively, provides a sound basis for postulating aggregate formation during the initial dissolution procedure. It should be noted that the absorption intensity kept decreasing continuously over time without the development of new absorption features. Unquestionably, larger aggregates form at the expense of monomers, affording orange-reddish precipitates at around 4 h for 1 and 2.
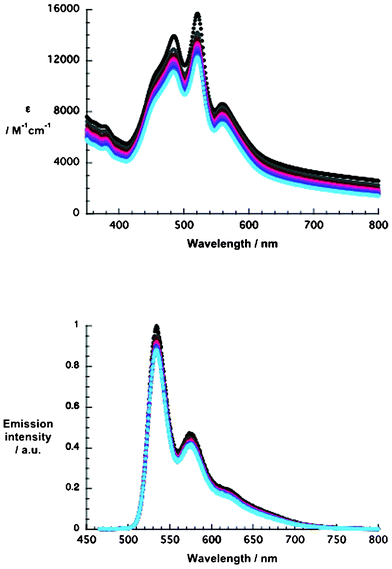 | ||
| Fig. 8 Upper part: absorption spectra of 1 in methanol (1 × 10⁻⁵ M) recorded at 1 h time intervals up to 10 h. Lower part: fluorescence spectra of 1 in methanol (1 × 10⁻⁵ M) recorded at 1 h time intervals up to 10 h at an excitation wavelength of 450 nm. | ||
The fluorescence spectra further corroborated the presence of aggregates in methanol. Upon photoexcitation at 450 nm, well-structured fluorescence maxima are discernible at 533, 574, and 620 nm as well as at 533, 574, and 668 nm for 1 and 2, respectively. Of interest is the resemblance of aggregate formation to dye uptake and DSSC performance of NiO photocathodes. 3 h evolves for 1 and 2 as a critical time window. Longer time periods lead to lower efficiencies (Tables 3 and 4). This suggests that 1 and 2 might either absorb as monomers on the NiO electrode surfaces and aggregate, or adsorb already in their aggregated form. This exerts a profound impact on the DSSC performance. One way or another, aggregates of 1 and 2 on NiO electrode surfaces hinder the effective regeneration processes inside of DSSCs. It is safe to assume that aggregates block the interactions between the redox couple and the electron accepting dye, which is directly immobilized onto the NiO surface. In a dynamic picture, the electron transfer rate with the redox couple is reduced. This is, nevertheless, detrimental for the generated Jsc. In addition, holes that fail to recombine with electrons from the external circuit accumulate at the electrode and form trap states (i.e. shallow and deep). In the final instance, Ef (vb) is moved to more positive energies and, as a consequence, the Voc is increased over time. Taking the aforementioned into consideration, the overall effects are an increase in Voc and a decrease in Jsc.
Electrochemical impedance spectroscopy
Electrochemical impedance spectroscopy (EIS) provided further insight into the electronic processes taking place in our devices under operating conditions. By means of sinusoidal modulation of the voltage at Voc and fitting to the circuit model (Fig. 9), the key data were derived. In general, the circuit model is used to simulate the impedance of interfaces between different components of DSSCs.53,54 It consists of a sequential arrangement of sheet resistance Rs and two resistances R1 and R2, each in parallel with the corresponding capacitance elements CPE1 and CPE2. Rs represents all the ohmic series resistances of the FTO substrates, electrolyte, and electrical contacts. Owing to the rough surfaces at the interfaces, replacing capacitances by constant phase elements (CPEs) enables a more precise interpretation of the electronic processes inside the p-DSSCs.55 The impedance of a CPE (ZCPE) is expressed by eqn (1), where Q0 is a constant in F sα−1, with α as an empirical constant, and Y0 the admittance in Siemens.55–59 | ||
| Fig. 9 Circuit model implemented to fit the impedance data. | ||

| (1) |
Since p-DSSC performances are governed by the NiO electrodes, R2/CPE2 is of particular interest. Table 5 summarizes the results of the impedance data from the corresponding Nyquist plots (Fig. 10). Under AM 1.5 and 100 mW cm−2 illumination, NiO p-DSSCs give rise to lower resistance at higher number of NiO nanoparticles present in the pastes. In fact, this dependence is in sound agreement with the trends seen for the device performance.
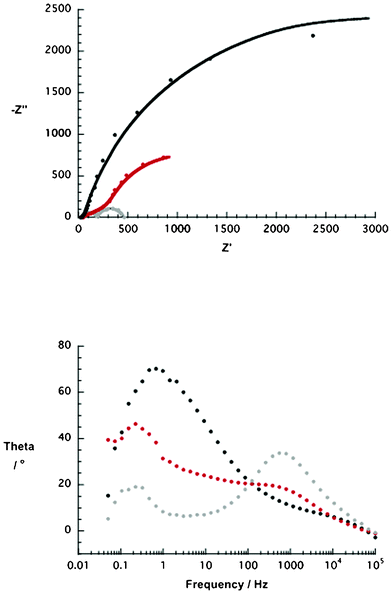 | ||
| Fig. 10 Upper part: Nyquist plot of NiO p-type DSSCs containing different weight percentages (wt%) of NiO nanoparticles (i.e. ethanol based pastes, 5 wt% = black, 10 wt% = red, 15 wt% = grey) and sensitized with 1 for 4 h. The solid lines present the fits of the impedance data. Lower part: corresponding Bode plots of NiO p-type DSSCs containing different weight percentages (wt%) of NiO nanoparticles (i.e. ethanol based pastes, 5 wt% = black, 10 wt% = red, 15 wt% = grey) and sensitized with 1 for 4 h. | ||
| Electrode | R 2 a/Ω | Y 2 b/S | α c | τ d/s |
|---|---|---|---|---|
| a R 2 = resistance of the NiO electrode. b Y 2 = admittance in Siemens (S). c α = empirical constant. d τ = hole lifetime. | ||||
| 5 wt% | 5700 ± 287.9 | (3.51 ± 0.15) × 10−4 | 0.89 ± 0.02 | 0.24 |
| 10 wt% | 1450 ± 108.1 | (1.30 ± 0.07) × 10−3 | 0.99 ± 0.02 | 0.72 |
| 15 wt% | 157 ± 2.5 | (1.06 ± 0.11) × 10−5 | 0.81 ± 0.01 | 0.31 |
Finally, the charge carrier lifetimes (i.e. holes) were calculated from the Bode plots (Fig. 10) using eqn (2).
 | (2) |
Here, τ and fmax are the lifetime in s and the frequency in Hz of the low frequency scan (i.e. 0.1 to 100 Hz), respectively.60 Importantly, the calculated values correlate well with those reported in the literature.61,62 These findings corroborate the best performance seen for electrodes prepared with the 10 wt% NiO nanoparticle pastes, regardless of the type of PDI. In the latter, the lifetimes are nearly doubled relative to 5 wt% and 15 wt% NiO nanoparticle pastes (Table 5). Due to longer lifetimes, charge carriers are expected to migrate larger distances through the mesoporous structure and, in turn, the yield of hole collection is increased.54,63,64 As a matter of fact, higher charge carrier concentrations at the electrode/FTO interface boosts the device performance.
Conclusions
To conclude, novel NiO based p-DSSCs were fabricated. The best photocathodes were made with an ethanol paste containing 10 wt% of NiO nanoparticles and triacetin as a plasticizer. These electrodes reveal the best homogeneity next to a reasonable transparency, and, as such, combine suitable light harvesting with good conductivity. In addition, EIS indicates that these electrodes show the best features in terms of resistance and hole lifetime under device operation. More specifically, the best efficiencies for both perylenediimide based p-DSSCs were 0.0153 and 0.0147% for the symmetric 1 and the non-symmetric dendronized dye 2, respectively. We hypothesized that the main reason for the moderate efficiencies is likely to be adsorption of aggregates on the electrode surface. This fact has a detrimental effect on the device features. Ongoing work is currently in progress in our lab to overcome this problem.Acknowledgements
The authors want to thank the German Science Council (DFG) for the financial support in the framework the Cluster of Engineering of Advanced Materials (EAM), and all of their colleagues for their help in order to provide efficient and successful research. Special thanks go to Ivan Litzov from the group of Prof. Dr. Christoph J. Brabec, Institute of Materials for Electronics and Energy Technology (i-MEET), Erlangen, for providing the profilometry measurements. Furthermore, many thanks go to Michael Auer and Stefan Romeis from the group of Prof. Dr.-Ing. Wolfgang Peukert, Institute of Particle Technology, Erlangen, for the assistance in SEM measurements and for performing gas adsorption analysis (BJH). R. D. C. thanks the Humboldt Foundation for its support.References
- P. J. Hall, Energy Policy, 2008, 36, 4363–4367 CrossRef.
- N. Armaroli and V. Balzani, Angew. Chem., Int. Ed., 2007, 46, 52–66 CrossRef CAS.
- J. P. Dorian, H. T. Franssen and D. R. Simbeck, Energy Policy, 2006, 34, 1984–1991 CrossRef.
- O. Morton, Nature, 2006, 443, 19–22 CrossRef CAS.
- R. F. Service, Science, 2005, 309, 548–551 CrossRef CAS.
- Z. Li, X. Zhao, X. Lu, Z. Gao, B. Mi and W. Huang, Sci. China: Chem., 2012, 55, 553–578 CrossRef CAS.
- J.-K. Lee and M. Yang, Mater. Sci. Eng., B, 2011, 176, 1142–1160 CrossRef CAS.
- C. W. Schlenker and M. E. Thompson, Chem. Commun., 2011, 47, 3702–3716 RSC.
- A. Bosio, D. Menossi, S. Mazzamuto and N. Romeo, Thin Solid Films, 2011, 519, 7522–7525 CrossRef CAS.
- D. Wei, Int. J. Mol. Sci., 2010, 11, 1103–1113 CrossRef CAS.
- K. Myung-Gyu, P. Hui Joon, A. Se Hyun, X. Ting and L. J. Guo, IEEE J. Sel. Top. Quantum Electron., 2010, 16, 1807–1820 CrossRef.
- A. G. Aberle, Thin Solid Films, 2009, 517, 4706–4710 CrossRef CAS.
- P. V. Kamat, J. Phys. Chem. C, 2008, 112, 18737–18753 CAS.
- M. Grätzel, J. Photochem. Photobiol., C, 2003, 4, 145–153 CrossRef.
- A. J. Nozik, Phys. E., 2002, 14, 115–120 CrossRef CAS.
- A. Goetzberger, J. Luther and G. Willeke, Sol. En. Mater. Sol. Cells, 2002, 74, 1–11 CrossRef CAS.
- T. L. Chu and S. S. Chu, Solid-State Electron., 1995, 38, 533–549 CrossRef CAS.
- B. O'Regan and M. Gratzel, Nature, 1991, 353, 737–740 CrossRef CAS.
- A. Yella, H.-W. Lee, H. N. Tsao, C. Yi, A. K. Chandiran, M. K. Nazeeruddin, E. W.-G. Diau, C.-Y. Yeh, S. M. Zakeeruddin and M. Grätzel, Science, 2011, 334, 629–634 CrossRef CAS.
- B. E. Hardin, H. J. Snaith and M. D. McGehee, Nat. Photonics, 2012, 6, 162–169 CrossRef CAS.
- M. A. Green, K. Emery, Y. Hishikawa, W. Warta and E. D. Dunlop, Prog. Photovoltaics, 2012, 20, 12–20 Search PubMed.
- S. Ito, T. N. Murakami, P. Comte, P. Liska, C. Grätzel, M. K. Nazeeruddin and M. Grätzel, Thin Solid Films, 2008, 516, 4613–4619 CrossRef CAS.
- Y. Chiba, A. Islam, Y. Watanabe, R. Komiya, N. Koide and L. Han, Jpn. J. Appl. Phys., 2006, 45, L638 CrossRef CAS.
- K. Zhu, S.-R. Jang and A. J. Frank, J. Phys. Chem. Lett., 2011, 2, 1070–1076 CrossRef CAS.
- J. Bisquert, A. Zaban, M. Greenshtein and I. Mora-Seró, J. Am. Chem. Soc., 2004, 126, 13550–13559 CrossRef CAS.
- B. A. Gregg, F. Pichot, S. Ferrere and C. L. Fields, J. Phys. Chem. B, 2001, 105, 1422–1429 CrossRef CAS.
- S. Y. Huang, G. Schlichthörl, A. J. Nozik, M. Grätzel and A. J. Frank, J. Phys. Chem. B, 1997, 101, 2576–2582 CrossRef CAS.
- A. Nattestad, A. J. Mozer, M. K. R. Fischer, Y. B. Cheng, A. Mishra, P. Bauerle and U. Bach, Nat. Mater., 2010, 9, 31–35 CrossRef CAS.
- M. Durr, A. Bamedi, A. Yasuda and G. Nelles, Appl. Phys. Lett., 2004, 84, 3397–3399 CrossRef CAS.
- J. He, H. Lindström, A. Hagfeldt and S.-E. Lindquist, Sol. En. Mater. Sol. Cells, 2000, 62, 265–273 CrossRef CAS.
- L. Le Pleux, A. L. Smeigh, E. Gibson, Y. Pellegrin, E. Blart, G. Boschloo, A. Hagfeldt, L. Hammarstrom and F. Odobel, En. Environ. Sci., 2011, 4, 2075–2084 CAS.
- C. Huang, S. Barlow and S. R. Marder, J. Org. Chem., 2011, 76, 2386–2407 CrossRef CAS.
- F. Würthner, T. E. Kaiser and C. R. Saha-Möller, Angew. Chem., Int. Ed., 2011, 50, 3376–3410 CrossRef.
- C. Ehli, C. Oelsner, D. M. Guldi, A. Mateo-Alonso, M. Prato, C. Schmidt, C. Backes, F. Hauke and A. Hirsch, Nat. Chem., 2009, 1, 243–249 CrossRef CAS.
- P. Qin, H. Zhu, T. Edvinsson, G. Boschloo, A. Hagfeldt and L. Sun, J. Am. Chem. Soc., 2008, 130, 8570–8571 CrossRef CAS.
- C. D. Schmidt, C. Böttcher and A. Hirsch, Eur. J. Org. Chem., 2007, 2007, 5497–5505 CrossRef.
- E. A. Gibson, L. Le Pleux, J. Fortage, Y. Pellegrin, E. Blart, F. Odobel, A. Hagfeldt and G. Boschloo, Langmuir, 2012, 28, 6485–6493 CrossRef CAS.
- P. Qin, J. Wiberg, E. A. Gibson, M. Linder, L. Li, T. Brinck, A. Hagfeldt, B. Albinsson and L. Sun, J. Phys. Chem. C, 2010, 114, 4738–4748 CAS.
- P. Qin, M. Linder, T. Brinck, G. Boschloo, A. Hagfeldt and L. Sun, Adv. Mater., 2009, 21, 2993–2996 CrossRef CAS.
- E. A. Gibson, A. L. Smeigh, L. Le Pleux, J. Fortage, G. Boschloo, E. Blart, Y. Pellegrin, F. Odobel, A. Hagfeldt and L. Hammarström, Angew. Chem., Int. Ed., 2009, 48, 4402–4405 CrossRef CAS.
- J. He, H. Lindström, A. Hagfeldt and S.-E. Lindquist, J. Phys. Chem. B, 1999, 103, 8940–8943 CrossRef CAS.
- M. Grätzel, Inorg. Chem., 2005, 44, 6841–6851 CrossRef.
- K. Keis and A. Roos, Opt. Mater., 2002, 20, 35–42 CrossRef CAS.
- H. Lindström, E. Magnusson, A. Holmberg, S. Södergren, S.-E. Lindquist and A. Hagfeldt, Sol. En. Mater. Sol. Cells, 2002, 73, 91–101 CrossRef.
- R. Marczak, F. Werner, R. Ahmad, V. Lobaz, D. M. Guldi and W. Peukert, Langmuir, 2011, 27, 3920–3929 CrossRef CAS.
- S. Makhlouf, M. Kassem and M. Abdel-Rahim, J. Mater. Sci., 2009, 44, 3438–3444 CrossRef CAS.
- J. Bisquert, Phys. Chem. Chem. Phys., 2008, 10, 49–72 RSC.
- J. Bisquert, J. Phys. Chem. B, 2004, 108, 2323–2332 CrossRef CAS.
- E. A. Meulenkamp, J. Phys. Chem. B, 1999, 103, 7831–7838 CrossRef CAS.
- A. Solbrand, H. Lindström, H. Rensmo, A. Hagfeldt, S.-E. Lindquist and S. Södergren, J. Phys. Chem. B, 1997, 101, 2514–2518 CrossRef CAS.
- C.-Y. Hsu, W.-T. Chen, Y.-C. Chen, H.-Y. Wei, Y.-S. Yen, K.-C. Huang, K.-C. Ho, C.-W. Chu and J. T. Lin, Electrochim. Acta, 2012, 66, 210–215 CrossRef CAS.
- F. Wurthner, Chem. Commun., 2004, 1564–1579 RSC.
- Z. Huang, G. Natu, Z. Ji, P. Hasin and Y. Wu, J. Phys. Chem. C, 2011, 115, 25109–25114 CAS.
- Q. Wang, J.-E. Moser and M. Grätzel, J. Phys. Chem. B, 2005, 109, 14945–14953 CrossRef CAS.
- J. Bisquert, G. Garcia-Belmonte, P. Bueno, E. Longo and L. O. S. Bulhões, J. Electroanal. Chem., 1998, 452, 229–234 CrossRef CAS.
- B. Hirschorn, M. E. Orazem, B. Tribollet, V. Vivier, I. Frateur and M. Musiani, J. Electrochem. Soc., 2010, 157, C458–C463 CrossRef CAS.
- J. Lario-García and R. Pallàs-Areny, Sens. Actuators, A, 2006, 132, 122–128 CrossRef.
- J. Bisquert, G. Garcia-Belmonte, F. Fabregat-Santiago, N. S. Ferriols, P. Bogdanoff and E. C. Pereira, J. Phys. Chem. B, 2000, 104, 2287–2298 CrossRef CAS.
- P. Zoltowski, J. Electroanal. Chem., 1998, 443, 149–154 CrossRef CAS.
- R. Kern, R. Sastrawan, J. Ferber, R. Stangl and J. Luther, Electrochim. Acta, 2002, 47, 4213–4225 CrossRef CAS.
- S. Mori, S. Fukuda, S. Sumikura, Y. Takeda, Y. Tamaki, E. Suzuki and T. Abe, J. Phys. Chem. C, 2008, 112, 16134–16139 CAS.
- H. Zhu, A. Hagfeldt and G. Boschloo, J. Phys. Chem. C, 2007, 111, 17455–17458 CAS.
- J. Bisquert, F. Fabregat-Santiago, I. n. Mora-Seró, G. Garcia-Belmonte and S. Giménez, J. Phys. Chem. C, 2009, 113, 17278–17290 CAS.
- J. Bisquert, J. Phys. Chem. B, 2001, 106, 325–333 CrossRef.
| This journal is © The Royal Society of Chemistry 2012 |
