Behaviour of electric and magnetic dipole transitions of Eu3+, 5D0 → 7F0 and Eu–O charge transfer band in Li+ co-doped YPO4:Eu3+†‡
A. K.
Parchur
a and
R. S.
Ningthoujam
*b
aDepartment of Physics, Banaras Hindu University, Varanasi, 221005, India
bChemistry Division, Bhabha Atomic Research Centre, Mumbai, 400085, India. E-mail: nraghu_mani@yahoo.co.in/rsn@barc.gov.in; Fax: +91-22-25505151; Tel: +91-22-2559321
First published on 17th September 2012
Abstract
The effect of Li+ co-doping on the photoluminescence properties of YPO4:Eu is discussed. Interesting behaviours, such as the presence of intermediate bands, shifting of the Eu–O charge transfer band (Eu–O CTB) to a lower wavelength, variation in intensities of magnetic (5D0 → 7F1) and electric dipole (5D0 → 7F2) transitions of Eu3+ and shift of 5D0 → 7F0 to higher energy with increasing excitation wavelengths are observed. The Eu3+ ion does not have an absorption band in the range 340–350 nm, but after excitation at these wavelengths, a broad emission band (370–570 nm), as well as sharp peaks of Eu3+, could be observed. This is due to strong energy transfer from the intermediate band of the host to the Eu3+ ion. X-ray photoelectron spectroscopy (XPS) study also confirms that intermediate band emission is not due to Eu2+ ion emission. The blue shifting of Eu–O CTB is because of the increase in the optical electronegativity of the Eu3+ ion on Li+ co-doping. The variation in intensities of the 5D0 → 7F2 and 5D0 → 7F1 dipole transitions is related to (i) overlapping interaction parameters within the ground and excited states, (ii) exchange interaction among atoms/ions and (iii) density of the incoming photons. Shift of 5D0 → 7F0 to a higher energy with increasing excitation wavelengths is because of change in the second order crystal field parameter B20 with excitation wavelength. The significant enhancement of luminescence intensity is found with Li+ co-doping due to the increase in crystallinity.
1. Introduction
Lanthanide ion (Ln3+) doped materials have been employed in a variety of advances and challenges in light emitting diodes (LED). Eu3+ doped YPO4 (wide band gap of Eg = 8.6 eV) is useful for optoelectronic device applications.1 The failure of Judd–Ofelt theory in the 5D0 → 7F0 transition of Eu3+ is well known. It is due to the mixing of two different states with different J values (J mixing).2 In some systems, it is observed that the emission intensity of 5D0 → 7F1 is linearly dependent on the 5D0 → 7F0 excitation energy.3 However, changes of the 5D0 → 7F0 peak position and line-width to the lower wavelength value with increasing site selective excitation wavelengths from (467–577 nm) have been reported.2a Similar observations were reported.2b On the other hand, the opposite effect was not reported, to the best of the authors' knowledge. Variation of this peak intensity with excitation wavelength has not been discussed much in the literature. Even at room temperature, the 7F1 level can be thermally populated in part and also lower energy photons via thermally excited Eu3+ ions can populate electrons at the 5D0 level using a laser as an excitation source.3 It was reported that single crystal YPO4:Eu3+ did not show the 5D0 → 7F0 transition, but its intensity appeared in the sintered powder sample due to the strain developed in the lattice.4Eu3+ ions are used in spectroscopy to determine the environment around the Eu3+ ion in the host as compared to other Ln3+ ions, since its electric dipole transition is hypersensitive to its local symmetry. If the ratio of the electric to magnetic dipole transitions varies significantly with excitation wavelength (i.e. more or less than 1), it is difficult to the determine the environment of Eu3+ in the same host. This has not been discussed much in the literature.
Since Eu3+ has a 4f6 configuration, it needs to gain one more electron to achieve the half-filled 4f7 configuration, which is relatively stable compared to partially filled configurations. When Eu3+ is linked to the O2− ligand, there is a chance of electron transfer from O2− to Eu3+ to form Eu2+–O− (simply Eu–O). During this, there is a broad absorption band at 240–270 nm, depending on the host. This is known as the Eu–O charge transfer band (CTB), and this band changes depending on the particle size of the host and environment of Eu3+. Could it happen on Li+ co-doped YPO4:Eu3+? Will Li+ ions go to the lattice sites or interstitial sites on Li+ co-doped YPO4:Eu3+? There is controversy regarding the Li+ co-dopant system, where authors claim that Y3+ is substituted by Li+ in YPO4. But upon expansion of their X-ray diffraction patterns, it was found that the positions of the peaks shift to a lower 2 theta angle upon Li+ doping.5 In the case of substitution, the opposite effect should occur, since the ionic size of Li+ (∼0.76 Å) is much less than that of Y3+ (∼0.9 Å).6 In some reports Li+ co-doping causes the peaks to shift to a higher 2θ angle in the XRD patterns.7 In the cases of alkali metal (Li, Na, K) doping to many luminescent materials, there were changes in luminescence intensity, but there are no conclusive reasons so far.7–10 Sometimes, it was found that the energy transfer rate from Eu–O or W–O to Eu3+ is very poor, and thus it is difficult to distinguish variations in luminescence intensity.8 In recent work on Li+ co-doped YPO4:Eu, 10 at% Li+ could give optimum luminescence intensity due to improved crystallinity and increased particle size.11 Here we used the polyol synthesis route (ethylene glycol as both solvent and capping), due to the smaller number of hydrocarbons present in its formula, low cost and effective control of particle sizes. Recently, we have successively synthesized highly crystalline nanoparticles of YPO4 and other hosts such as Eu3+/Tb3+doped CaMoO4 nanoparticles using this method at low temperature.12,13
In this article, we analyse the luminescence properties of a 5 at% Eu3+ doped YPO4 sample with or without Li+ co-dopant under different excitation wavelengths (240–399 nm). 5 at% Eu3+ doped YPO4 is referred to as YPO4:Eu in subsequent paragraphs. We observe that the magnetic dipole transition intensity is dominant over the electric dipole transition at the excitation wavelengths (240, 250, 290, 300, 340, 350, 399 nm) whereas the reverse occurs at 260–280 nm excitations. Eu–O CTB shows a blue shift with Li+ ion concentration. Interestingly, the forbidden transition (5D0 → 7F0) appears distinctly on Li+ co-doping. The variations in peak position, line-width and intensity are found with the different excitation wavelengths. These interesting observations are discussed here.
2. Experimental section
2.1. Synthesis
The samples of Eu3+ (5 at%) doped YPO4 (i.e., YPO4:Eu) and Li+ (Li+ = 3, 5, 7 and 10 at%) co-doped YPO4:Eu were prepared using polyethylene glycol route at low temperature (∼100–120 °C for 1 h). The detailed preparation method is reported elsewhere.14 The as-prepared sample was annealed at 900 °C in ambient atmosphere at a rate of 2 °C min−1 for 4 h in order to remove the dangling bonds on the surface of the nanoparticles. Samples annealed at 900 °C are studied here because they have high crystallinity.2.2. Characterization
Detailed characterization of the sample was given in ref. 14. Chemical bonding in the sample was measured using X-ray photoelectron spectroscopy (XPS) SPECS, Germany (Mg-Kα X-ray source, hv = 1253.6 eV). The photoluminescence (PL) spectra of these powder phosphors were recorded using a Hitachi F-4500 spectrometer with a 150 W Xe lamp as a source at a spectral resolution of 3 nm. All the measurements were carried out at room temperature. PL decay was recorded with an Edinburgh instrument F920 equipped with Nd-YAG laser pumped optical parameters (OPO), with a pulse width of 10 ns and a repetition frequency of 10 Hz as the excitation source. Excitation and emission wavelengths are fixed at 468 and 615 nm, respectively.3. Results and discussion
3.1 XPS study
We have analysed the X-ray Photoelectron Spectra (XPS) of 0 and 10 at% Li+ co-doped YPO4:Eu. The binding energy (BE) of each Y3+, P5+ and O2− ion increases by 0.4 eV when Li+ (10 at%) is co-doped to YPO4:Eu (Fig. 1). This is related to the improved crystallinity on annealing. Their corresponding FWHM decreases on Li+ co-doping and their values are shown in the respective figures. Here, we discuss the peak positions/binding energies of ions for 10 at% Li+ co-doped YPO4:Eu. As shown in Fig. 1(a), a broad peak with BE ∼ 45.5 eV is assigned to Li(1s). The BE of Eu2+(4d3/2) was reported at ∼133.1 eV and P(2p) was also in the same band.15 In our study, there is a peak centered at 133.1 eV and thus we could not determine the exact positions of Eu2+(4d3/2) and P(2p). However, it was reported that there was a peak at ∼127.1 eV, which can determine Eu2+ (4d5/2),16 but we could not achieve it. Now, we are looking for Eu3+, which can have peaks at 135 eV for 4d5/2 and 141 eV for 4d3/2.15 After expansion in the 126–144 eV range, a small peak at ∼141.2 eV is found, which matches with Eu3+(4d3/2), and the peak for Eu3+(4d5/2) will be assigned to the peak at 133 eV. So, the peak at 133 eV will be from P(2p). The presence of Eu3+ is also supported by luminescence study (discussed later). A broad peak at ∼158.8 eV is assigned to Y(3d3/2) (Fig. 1(b)). This confirms the high probability of Eu3+ present in the samples (Fig. 1(c)). A broad peak at ∼301 eV is assigned to Y(2p1/2) and its FWHM is ∼2.9 eV (Fig. 1(d)). Fig. 1(e) shows the BE peak at ∼531.06 eV having a FWHM of ∼1.8 eV, which corresponds to O(1s). The peak is symmetrical, indicating the presence of one kind of O, which is in a tetragonal structure (i.e. highly crystalline). If there is O defect in the lattice, there will be a peak/hump at ∼529 eV.15 | ||
| Fig. 1 XPS spectra of 0 and 10 at% Li+ co-doped YPO4:Eu. Peaks corresponding to the core binding energies of individual elements are shown in (a)–(e). The binding energy of Eu2+ 4d5/2 is missing, whereas that of Eu3+ 4d5/2 is observed after the expansion (c). | ||
3.2 Luminescence study
3.2.1 Excitation and emission studies
Fig. 2(a) shows the excitation spectrum of 5 at% Li+ co-doped YPO4:Eu by monitoring the emission wavelength at 594 nm. The excitation spectrum consists of a strong absorption band between 200–275 nm being centered at ∼237.6 nm with FWHM ∼20 nm, which can be assigned to the Eu–O CT. The sharp lines in the wavelength range 275 to 500 nm centered at 324, 367, 387, 398, and 468 nm correspond to 7F0,1 → 5H3,6, 7F0,1 → 5D0, 7F0,1 → 5G1, 5L7, 7F0 → 5L6 and 7F0 → 5D2 of Eu3+, respectively.17,18 The absorption intensity of the 7F0 → 5L6 transition at 398 nm (FWHM ∼ 6 nm) is 1.4 times stronger than the Eu–O CT absorption, indicating a weak energy transfer from the Eu–O CT band to Eu3+.19,20 Fig. S1† (ESI†) shows the excitation spectra of (0–10) at% Li+ co-doped YPO4:Eu by monitoring the emission wavelength at 594 nm. The wavelength corresponding to the Eu–O CT band decreases from 238.6 to 235.5 nm and the corresponding FWHM decreases from 21 to 18 nm, with Li+ ion concentration up to 10 at% (Fig. 2(b)). The blue shift in the CT band with Li+ ion concentration suggests the increase in the ionicity of the Eu–O bond.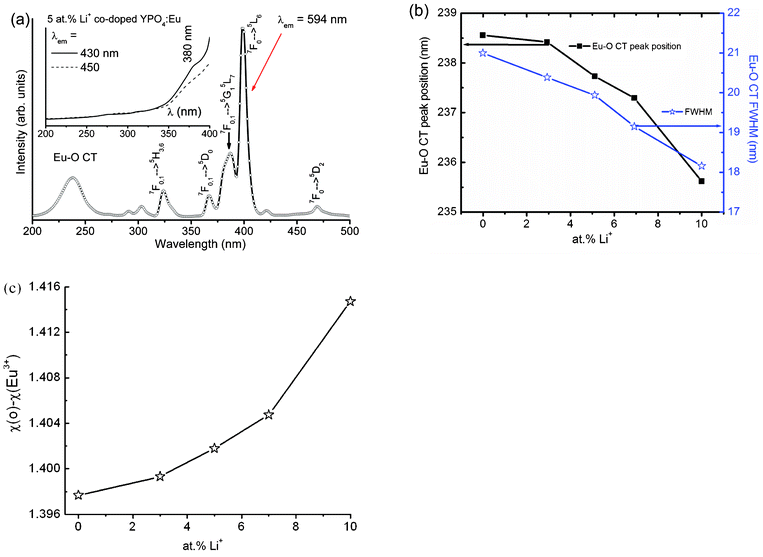 | ||
| Fig. 2 (a) Excitation spectra (monitoring emission at 594 nm) of 5 at% Li+ co-doped YPO4:Eu; the inset shows its excitation spectra on monitoring emissions at 430 and 450 nm. (b) Change in peak position of Eu–O CT band (left) and corresponding FWHM with Li+ ion concentration up to 10 at%. (c) Difference in electronegativity (χ(O2−) − χ(Eu3+)) vs. Li+ ion concentration on Li+ co-doped YPO4:Eu. | ||
To understand the shifting of the Eu–O CT band, the optical electronegativity of the ligand ion is studied using the Jørgensen empirical equation of charge transfer, which is expressed as
| ΔEu–O = [χ(ligand) − χ(Eu3+ ion)]3 × 104 cm−1 | (1) |
![[thin space (1/6-em)]](https://www.rsc.org/images/entities/char_2009.gif) 929 cm−1), 238.2 nm (41
929 cm−1), 238.2 nm (41![[thin space (1/6-em)]](https://www.rsc.org/images/entities/char_2009.gif) 980 cm−1), 237.5 nm (42
980 cm−1), 237.5 nm (42![[thin space (1/6-em)]](https://www.rsc.org/images/entities/char_2009.gif) 100 cm−1), 237.3 nm (41
100 cm−1), 237.3 nm (41![[thin space (1/6-em)]](https://www.rsc.org/images/entities/char_2009.gif) 143 cm−1) and 235.6 nm (42
143 cm−1) and 235.6 nm (42![[thin space (1/6-em)]](https://www.rsc.org/images/entities/char_2009.gif) 441 cm−1) for Li+ = 0, 3, 5, 7 and 10 at%, respectively. Then, we have calculated the difference in electronegativity (χ(O2−) − χ(Eu3+)), and the values are shown in Fig. 2(c). The difference in electronegativity increases with increasing Li+, indicating an increase in ionic strength. Y3+ is surrounded by 8 O2− ions to form dodecahedron (YO8) in a tetragonal YPO4 structure and its site symmetry of Y3+ or Eu3+ is D2d. The ionic size of Eu3+ in 8 co-ordination number (CN) is 1.07 Å, whereas Li+ has 0.59 Å (4CN) or 0.76 Å (6CN). Due to differences in ionic sizes, co-ordination numbers and charges of the Eu3+ and Li+ ions arise; the environment of Eu3+ is disturbed after the incorporation of Li+. It is expected to a create more positive charge in the Li+ co-doped system because Li+ ions occupy the interstitial sites of the YPO4 structure, which is confirmed by XRD study. This will induce more ionicity in the Eu–O CT band.
441 cm−1) for Li+ = 0, 3, 5, 7 and 10 at%, respectively. Then, we have calculated the difference in electronegativity (χ(O2−) − χ(Eu3+)), and the values are shown in Fig. 2(c). The difference in electronegativity increases with increasing Li+, indicating an increase in ionic strength. Y3+ is surrounded by 8 O2− ions to form dodecahedron (YO8) in a tetragonal YPO4 structure and its site symmetry of Y3+ or Eu3+ is D2d. The ionic size of Eu3+ in 8 co-ordination number (CN) is 1.07 Å, whereas Li+ has 0.59 Å (4CN) or 0.76 Å (6CN). Due to differences in ionic sizes, co-ordination numbers and charges of the Eu3+ and Li+ ions arise; the environment of Eu3+ is disturbed after the incorporation of Li+. It is expected to a create more positive charge in the Li+ co-doped system because Li+ ions occupy the interstitial sites of the YPO4 structure, which is confirmed by XRD study. This will induce more ionicity in the Eu–O CT band.
Fig. 3(a–c) show the emission spectra of Li+ co-doped YPO4:Eu (Li+ = 0, 5 and 10 at%) under different excitation wavelengths. A broad band emission in 370–570 nm (centered at ∼430 nm) with a FWHM of ∼75 nm is observed, and this is related to intermediate band emission within the band gap of the YPO4 host. To check the intermediate band arising from the sample, we have carried out excitation spectra of 5 at% Li+ co-doped YPO4:Eu on monitoring emission at 430 and 450 nm (inset of Fig. 2(a)). It is found that there is an increase in absorption intensity from 300 to 400 nm. This is related to intermediate bands present within a large band gap of YPO4 (Eg = 8.6 eV). Notably, there is no absorption band in 340–350 nm in the case of the pure Eu3+ ion.22 There was a report on intermediate band observations (absorption and emission) in LaPO4:Eu.23
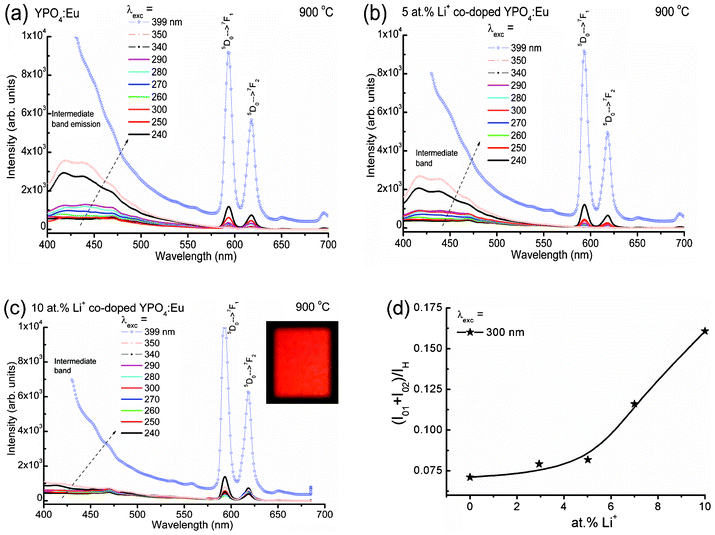 | ||
| Fig. 3 Emission spectra of (a) Li+ = 0, (b) Li+ = 5 and (c) Li+ = 10 at% co-doped YPO4:Eu samples under different excitation wavelengths. (d) The ratio of the integrated area of the total magnetic and electric dipole transitions of Eu3+ (5D0 → 7F1 and 5D0 → 7F2), (I01 + I02) to intermediate host emission (IH) vs. Li+ ion concentrations. Inset of (c) shows the digital photograph of the sample under 266 nm laser excitation. | ||
The intensity of the intermediate band emission peak increases with excitation wavelength from 240 to 399 nm. Actually, the range of intermediate band emission is 360–570 nm, which can be seen after excitation at 340 nm, where there is no absorption peak for Eu3+.22 This range covers the main absorption peaks of Eu3+ (399 nm, 7F0 → 5L6 and 468 nm, 7F0 → 5D2). The emission spectrum of each sample consists of two sharp peaks at ∼594 and 615 nm, which correspond to the magnetic dipole (5D0 → 7F1) and electric dipole transitions (5D0 → 7F2), respectively. There is a strong resonance energy transfer from the intermediate band to Eu3+ and thereby the population of electrons/photons in the excited state of Eu3+ is high. This energy transfer process is non-radiative through a dipole–dipole interaction (known as Förster or Dexter-type mechanism).24 The inset of Fig. 3(c) shows the digital photograph of 10 at% Li+ co-doped YPO4:Eu under 266 nm laser excitation. A bright red colour is observed.
Fig. 3(d) shows the ratio of the integrated areas of electric and magnetic dipole transitions of Eu3+ to intermediate host emission with Li+ ion concentrations. The ratio increases slowly up to 5 at% Li+ and then increases steeply with Li+ ion concentration. Li+ co-doping decreases the intermediate band emission intensity and thereby enhances the Eu3+ emission by energy transfer from the intermediate band to Eu3+. This is due to improved crystallinity, which enhances the radiative rate of Eu3+ transitions on Li+ co-doped YPO4:Eu. This is also supported by XRD and XPS results.
Fig. 4(a) shows the expanded emission spectra of Li+ (0, 3, 5, 7 and 10 at%) co-doped YPO4:Eu in 550–650 nm under an excitation wavelength of 240 nm (Eu–O CT band excitation). The magnetic dipole transition intensity (5D0 → 7F1) is dominant over the electric dipole transition (5D0 → 7F2), suggesting a higher occupancy of Eu3+ in a symmetric environment. The emission spectrum excited at 250 nm shows an almost similar trend to that at 240 nm excitation (Fig. S2(a), ESI†). The emission spectrum monitored under 260 nm excitation shows different behavior as compared to both the 240 and 250 nm excitations (Fig. 4(b)). It is found that the intensity of the electric dipole transition is more than the magnetic dipole transition. The electrical-dipole transition is a hypersensitive transition, which is allowed only on the condition that Eu3+ ion occupies a site without an inversion center and is very sensitive to the local environment around the Eu3+ ion.19,25 To understand the different behaviors of the electric and magnetic dipole transition intensities, emission spectra are recorded at excitation wavelengths of 270, 280, 290, 300, 340, 350 and 399 nm. We have used a 375 nm cut-off filter for recording emission spectra for all excitations except 399 nm (no filter is used). Excitations at 270 and 280 nm show a similar nature to that at 260 nm excitation (Fig. S2(b) and Fig. S3(a), ESI†). Excitations at 290 to 399 nm (Fig. 4(c), Fig. 5) show a similar nature to those at 240 and 250 nm excitations (Fig. S3(b), ESI†). The asymmetric ratio (A21), which is defined as the ratio of integrated intensities of the electric dipole transition to the magnetic dipole transition is used to understand the luminescence behaviour of the Eu3+ ion under different excitation wavelengths (Table 1). There are changes in ratio from less than one to more than one on different excitations or doping concentrations of Li+. The above luminescence behaviour causes confusion for analysis of the nature of the Eu3+ environment. The reported A21 values are close to ∼1 in Eu3+ doped YPO4 and ∼4–10 in Eu3+ doped CaMoO4.16,17
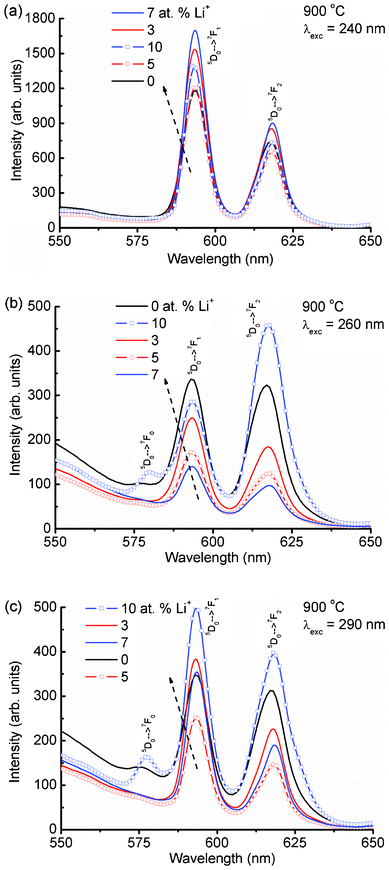 | ||
| Fig. 4 Emission spectra of Li+ co-doped YPO4:Eu (Li+ = 0, 3, 5, 7 and 10 at%) in 550–650 nm after different excitations at (a) 240, (b) 260 and (c) 290 nm. | ||
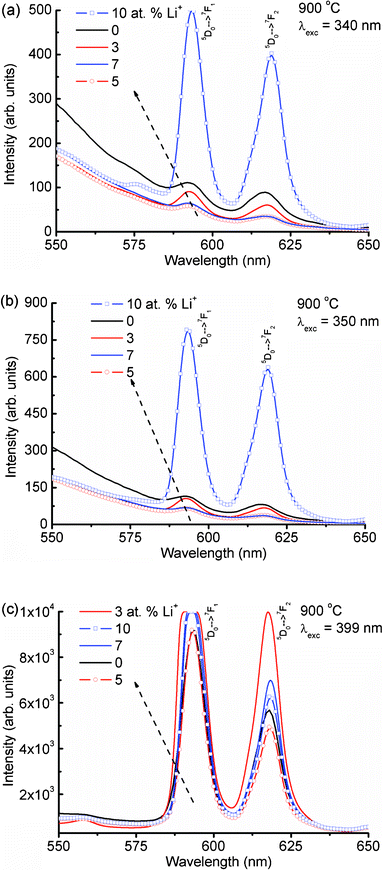 | ||
| Fig. 5 Emission spectra of Li+ co-doped YPO4:Eu under (a) 340, (b) 350 and (c) 399 nm excitations. | ||
| Li+ (at%) | A 21 calculated from different excitation wavelengths (nm) | |||||||||
|---|---|---|---|---|---|---|---|---|---|---|
| 240 | 250 | 260 | 270 | 280 | 290 | 300 | 340 | 350 | 399 | |
| 0 | 0.56 | 0.68 | 0.98 | 1.26 | 1.57 | 0.95 | 0.77 | 1.81 | 1.11 | 0.53 |
| 3 | 0.49 | 0.54 | 0.69 | 0.83 | 0.99 | 0.53 | 0.50 | 0.90 | 0.82 | 0.66 |
| 5 | 0.47 | 0.57 | 0.75 | 0.85 | 1.05 | 0.58 | 0.49 | 1.06 | 0.79 | 0.45 |
| 7 | 0.45 | 0.52 | 0.75 | 0.75 | 1.09 | 0.49 | 0.43 | 1.00 | 0.73 | 0.49 |
| 10 | 0.47 | 0.90 | 1.84 | 1.74 | 1.44 | 0.77 | 0.60 | 0.74 | 0.72 | 0.47 |
When we look into the crystal symmetry of YO8 or EuO8, it does not have an inversion symmetry element (i). The environment of Y3+ or Eu3+ is asymmetric. According to Judd–Ofelt theory, the electric dipole transition intensity should be more than the magnetic dipole transition in such an asymmetric environment. The variation of magnetic and electric dipole transition intensities with incoming excitation wavelength can come from the following possibilities:26
1. Overlapping interaction parameters within the ground and excited states.
2. Exchange interaction among atoms/ions or groups of atoms (e.g. PO4).
3. Density of the incoming photons.
The first point indicates the ground state and the excited state of the Eu3+ and usually the gap between them is fixed because of the f–f transitions. The second point includes the neighbouring atoms or groups around the Y/EuO8. In this tetragonal structure, Y/EuO8 is connected with the PO4 group. The PO4 has S4 symmetry, which has a high polarizing ability because the ionic size of P5+ is too small (∼0.17 Å, 4CN). This influences the electric and magnetic dipole transition probability of Eu3+. The third point refers to the density of the oscillator state around the energy of incoming photons, which influences the transition probability of Eu3+ with the wavelength of the incoming light/photon. This also suggests that if the incoming light falls in the VUV or UV or visible regions, the electric and magnetic dipole transitions of Eu3+ will change. In VUV excitation, the YPO4 host absorption will occur and the absorbed energy will be transferred to the excited state of Eu3+. In the UV excitation, Eu–O CT or intermediate band absorption occur and this absorbed energy can be transferred to the excited state of Eu3+. In the case of visible absorptions, direct Eu3+ excitation occurs and the possibility of energy transfer among the Eu3+ ions takes place through the diffusion or non radiative process. It is to be noted that the variation of electric and magnetic dipole transitions depends on the intensity of the incoming light at the same wavelength. The population of higher excited levels of Eu3+ (5Dj=0–3) can be achieved in part via excited Eu3+, using a laser as an excitation source with high power.2,3,27 With increasing intensity of the incoming light, 2 or 3 photon absorption can occur in some systems.27
The intensity of the 5D0 → 7F0 transition is significant in the case of highly Li+ co-doped YPO4:Eu (Li+ = 10 at%). Interestingly, the peak position and the intensity vary with excitation wavelength. This observation is unusual to our knowledge. Below 250 nm or above 300 nm excitation, its intensity is very weak (Fig. 6a). After base line correction (Fig. 6b), the peak positions are found to be 579.3 and 577.3 nm at 250 and 300 nm respectively, suggesting a blue shift in the peak position with increasing excitation wavelength (Fig. 6c). The FWHM (Fig. 6c) and integrated intensity (Fig. 6d) increase with increasing excitation wavelength up to 290 nm. Observation of this peak under high Li+ co-doping indicates that the forbidden transition 5D0 → 7F0 can be relaxed by distortion of the Eu3+ environment (i.e. variation in the crystal field) and j = 0–0 is no longer pure. Instead, j–j mixing occurs. Such j–j mixing is dependent on excitation wavelength as well as crystal field. The crystal field of Eu3+ is influenced by the Li+ ions, which occupy interstitial sites of YPO4. Thus, this transition is observed for a high Li+ co-doping system. The peak shifting, as well as the intensity variation, can be explained by the above possibilities (1–3). In addition, the thermal population of electrons in the j = 1, 2, 3 levels of 7Fj (ground state) may be one factor in such a transition at 577–579 nm.
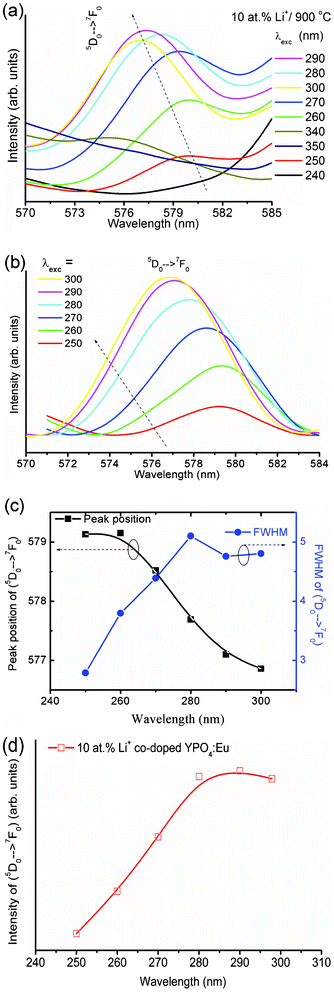 | ||
| Fig. 6 Expansion of luminescence spectra of 10 at% Li+ co-doped YPO4:Eu sample between 570–585 nm under different excitation wavelengths (a) before and (b) after baseline correction. (c) Variations of peak 5D0 → 7F0 position (left) and FWHM (right) with excitation wavelength (250–300 nm) and (d) integrated intensity of the 5D0 → 7F0 transition vs. excitation wavelength from 250 to 300 nm. | ||
The intensity of the 5D0 → 7F0 (∼576 nm) transition is very weak compared to both the 5D0 → 7F1 and 5D0 → 7F2 transitions. It is found that the intensity of the 5D0 → 7F0 transition significantly increases with Li+ ion concentration as well as change of excitation wavelength from 250 to 300 nm. Due to the non-availability of the crystal field splitting at the 5D0 and/or 7F0 levels (i.e. non-degenerate), this transition can be effectively used for the bond environment around the Eu3+ ion. The shift in peak position (blue shift) of the 5D0 → 7F0 transition with increase in excitation wavelength indicates the formation of the (Y/Eu)3+–O2−–Li+ type structure in the host lattice. The FWHM of the 5D0 → 7F0 transition peak increases with increase of excitation wavelength up to 280 nm and is almost constant with a further increase in excitation wavelength up to 300 nm. The FWHM of the 5D0 → 7F0 transition peak is broad and its intensity is very weak at excitation wavelengths of 240 and above 340 nm; thus it is difficult to calculate the exact peak position. Excitations at 250 to 300 nm are used for analysis. Does the excitation wavelength influence the intensity of the 5D0 → 7F0 transition? To the best of our knowledge this type of question has not been properly answered in the literature. There were reports in the red shift of the 5D0 → 7F0 transition peak position, their corresponding FWHM and intensity with increasing site selective excitation wavelengths (576 to 577.5 nm or 461.8 to 467.1 nm) from a laser source in a glass system,28,29 which are opposite to our study. In TiO2–SiO2 glasses, the position of the 5D0 → 7F0 transition does not change with excitation wavelengths, and an even lower photon energy was used to excite Eu3+ for emitted light production of higher energy (5D0 → 7F0) partly due to population at the 5D0 level.3 In ref. 2, 3, 28 and 29, the excitation source is a laser and thus site selective excitation can be performed. The differences from other reported cases in this study are that only particular excitation wavelengths can show significant intensity for the 5D0 → 7F0 transition and the source is a xenon lamp. In this work we focus on this problem originating from lattice distortion from the host, crystal field and/or polarization effect of the PO4 group.
The 5D0 → 7F0 transition is forbidden according to Judd–Ofelt theory. However, its significant intensity observed in many compounds is due to either parity mixing (e.g. d–f) or j–j mixing at the excited state (5Dj=0,1,3) or the ground state (Fj=0,1,2,3,4) due to thermal population. The parity mixing (e.g. d–f) is ruled out because of the high energy gap between them. The j–j mixing at the excited state (5Dj=0,1,3) is not feasible because of the significant energy gap. There is a possibility of j–j mixing at the ground state of Fj=0,1,2,3,4 due to thermal population. 5D0 → 7F1,3 magnetic dipole transitions are almost independent of local-crystal field strength. The mixing of the higher j = 4, 6 with j = 0 is lower because the higher energy level of j = 4, 6 from j = 0 and also their emission intensities are weak compared to j = 2. The most probable is from mixing j = 2 with j = 0 at the ground state of Fj, which gives rise to a significant transition probability (i.e. intensity) of the 5D0 → 7F0 transition through the second order term of the local crystal field. The relationship between the intensities of 5D0 → 7F0 and the 5D0 → 7F2 is given by

| (2) |
Ray et al.30 considered the Δ20 value to be constant (900 cm−1) in the case of the Y2O3 host system. Theoretically, the ground state energy (7F0) should not change at a particular temperature. However, the shifting of the 5D0 → 7F0 peak position with excitation wavelength in this study suggests that Δ20 will vary for each excitation wavelength from 250 to 300 nm because of variation of the crystal field interaction with incoming light. This was not considered in earlier studies. Fig. 7 shows the variation of second order crystal field parameter B20 (right) and A02 (left) with excitation wavelengths ranging from 250 to 300 nm after the consideration of changes in Δ20 for the 10 at% Li+ co-doping system. B20 is purely related to the bond environment around the Eu3+ ion. It is found that B20 increases proportionally with exciting wavelength from 250 to 300 nm (4.96–4.13 eV). This implies that the increased excitation wavelength from 250 to 300 nm induces more perturbation from the second nearest bonds to the Eu3+ ion. Typical B20 values for 10 at% Li+ co-doped YPO4:Eu are found to be 542 and 1365 cm−1 for the 250 to 300 nm excitations, respectively. In the case of Ca(PO3)2:Eu3+ glass, the high value of B20 of 1600 cm−1 was reported.32 In our study, the transition probability/intensity of 5D0 → 7F0 increases with Li+ concentration at a particular excitation wavelength, indicating involvement of the second order crystal field parameter on the Li+ co-doped structure. There were reports on the decrease of B20 from ∼600 to 280 cm−1 with increasing excitation wavelength (nm) in three different phosphate glasses,28 however, the trend is opposite to that in this study. In these phosphate glasses, it was suggested that the larger the value of B20, the closer the coordinating ligands to the Eu3+ ion. It was also reported on variation of B20 from 950 to 1350 cm−1 on the same excitation wavelength (488 nm from laser source) with increasing Eu3+ concentration in Y2O3, but the Δ20 value is fixed at 900 cm−1, while B20 is calculated according to eqn (2).30 In this study, the B20 value is high, indicating that the higher perturbation crystal field can be associated in addition to the second order parameter.28
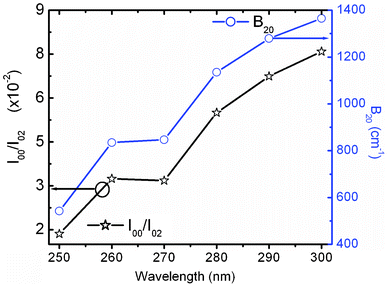 | ||
| Fig. 7 Variation of I(5D0 → 7F0)/I(5D0 → 7F2) (left) and crystal field parameter B20 (right) of 10 at% Li+ co-doped YPO4:Eu under different excitations. | ||
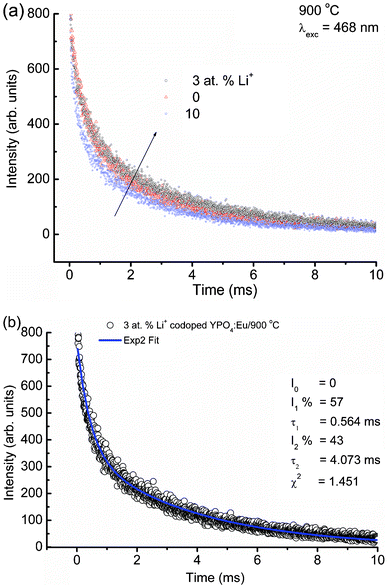 | ||
| Fig. 8 (a) Lifetime decay spectra of Li+ doped YPO4:Eu (Li+ = 0, 3 and 10 at%) under 468 nm laser excitation (λem = 594 nm) and (b) bi-exponential fittings to luminescence decay data of 3 at% Li+ co-doped YPO4:Eu. Fitting parameters are shown in their figures. | ||
All decay data are fitted by using bi-exponential decay equation, which is expressed as
| I = I1e(−τ/τ1) + I2e(−τ/τ2) | (3) |
 | (4) |
4. Conclusions
Luminescence properties of Li+ co-doped YPO4:Eu are discussed in this article (Li+ = 0, 3, 5, 7 and 10 at%). The XPS study confirms the lack of the core binding energy peak at ∼127.1 eV that corresponds to Eu2+(4d5/2). It is concluded that the Eu3+ → Eu2+ conversion does not occur with Li+ co-doping. Eu–O CTB shows a blue shift upon Li+ co-doping due to the increase in ionicity. The addition of Li+ significantly enhances the luminescence intensity of Eu3+ due to improved energy transfer from the intermediate band of the host to Eu3+. Moreover, we observe some unusual behavior in electric (5D0 → 7F2) and magnetic (5D0 → 7F1) dipole transitions under excitation wavelengths from 240 to 399 nm. The intensity of the 5D0 → 7F2 transition is more than that of the 5D0 → 7F1 transition for excitations at 260–280 nm, and the reverse occurs for excitations at 240, 250 and 290–399 nm. We observe the 5D0 → 7F0 optical transition having maximum intensity at 290 nm excitation. On increasing the excitation wavelength from 250 to 300 nm, the 5D0 → 7F0 transition shifts to lower wavelengths (blue shift), which is opposite to the reported one. The second order crystal field parameter (B20) is used as a probe to understand the crystal field environment around Eu3+. The B20 value is found to be in the range ∼542–1365 cm−1. The average lifetime value (τav) is found to be 2.07 ms for the 3 at% Li+ co-doped YPO4:Eu sample.Acknowledgements
This work has been sponsored by the University Grants Commission (UGC) under the D. S. Kothari Postdoctoral Fellowship Scheme (No.F.4-2/2006(BSR)/13-309/2008(BSR)) to Dr A. K. Parchur. Authors thank Dr T. Mukherjee, Chemistry Group and Dr D. Das, R. K. Vatsa and Dr V. Sudarsan, Chemistry Division, BARC for their support and encouragement during this work and Dr R. K. Sahu, NML Jamshedpur for providing XPS data.References
- (a) J. W. Stouwdam, G. A. Hebbink, J. Huskens and F. C. J. M. van Veggel, Chem. Mater., 2003, 15, 4604 CrossRef CAS; (b) A. H. Krumpel, A. J. J. Bos, A. Bessière, E. van der Kolk and P. Dorenbos, Phys. Rev. B: Condens. Matter Mater. Phys., 2009, 80, 085103 CrossRef; (c) N. K. Sahu, R. S. Ningthoujam and D. Bahadur, J. Appl. Phys., 2012, 112, 014306 CrossRef.
- (a) T. Kushida and M. Tanaka, Phys. Rev. B: Condens. Matter, 2002, 65, 195118 CrossRef; (b) M. Tanaka, G. Nishimura and T. Kushida, Phys. Rev. B: Condens. Matter, 2004, 49, 16917 CrossRef.
- H. You and M. Nogami, J. Phys. Chem. B, 2004, 108, 12003 CrossRef CAS.
- C. Brecher, H. Samelson, R. Riley and A. J. Lempicki, Chem. Phys., 1968, 49, 3303 CAS.
- R. Balakrishniah, D. W. Kim, S. S. Yi, S. H. Kim, K. Jang, H. S. Lee, B. K. Moon and J. H. Jeong, NSTI-Nanotech., 2010, 3, 773 Search PubMed.
- R. D. Shannon, Acta Crystallogr., Sect. A: Cryst. Phys., Diffr., Theor. Gen. Crystallogr., 1976, 32, 751 CrossRef.
- J. Liu, H. Lian and C. Shi, Opt. Mater., 2007, 29, 1591 CrossRef CAS.
- J. Huang, J. Xu, H. Luo, X. Yu and Y. Li, Inorg. Chem., 2011, 50, 11487 CrossRef CAS.
- S. Neeraj, N. Kijima and A. K. Cheetham, Chem. Phys. Lett., 2004, 387, 2 CrossRef CAS.
- C. Guo, S. Wang, T. Chen, L. Luan and Y. Xu, Appl. Phys. A: Mater. Sci. Process., 2009, 94, 365 CrossRef CAS.
- H. Lai, H. Yang, T. Chunyan and X. Yang, Phys. Status Solidi A, 2007, 204, 1178 CrossRef CAS.
- (a) A. K. Parchur, A. I. Prasad, S. B. Rai, R. Tiwari, R. K. Sahu, G. S. Okram, R. A. Singh and R. S. Ningthoujam, AIP Adv., 2012, 2, 32119 CrossRef; (b) A. K. Parchur, G. S. Okram, R. A. Singh, R. Tewari, L. Pradhan, R. K. Vatsa and R. S. Ningthoujam, AIP Conf. Proc., 2010, 1313, 391 CrossRef CAS.
- (a) A. K. Parchur and R. S. Ningthoujam, Dalton Trans., 2011, 40, 7590 RSC; (b) A. K. Parchur, A. I. Prasad, A. A. Ansari, S. B. Rai and R. S. Ningthoujam, Dalton Trans., 2012, 41, 11032 RSC.
- A. K. Parchur and R. S. Ningthoujam, RSC Adv., 2012 10.1039/c2ra20763j.
- R. S. Ningthoujam, V. Sudarsan, R. K. Vatsa, R. M. Kadam, Jagannath and A. Gupta, J. Alloys Compd., 2009, 486, 864 CrossRef CAS.
- M. N. Luwang, R. S. Ningthoujam, Jagannath, S. K. Srivastava and R. K. Vatsa, J. Am. Chem. Soc., 2010, 132, 2759 CrossRef CAS.
- A. K. Parchur, R. S. Ningthoujam, S. B. Rai, G. S. Okram, R. A. Singh, M. Tyagi, S. C. Gadkari, R. Tewari and R. K. Vatsa, Dalton Trans., 2011, 40, 7595 RSC.
- M. N. Luwang, R. S. Ningthoujam, S. K. Srivastava and R. K. Vatsa, J. Am. Chem. Soc., 2011, 133, 2998 CrossRef CAS.
- B. R. Judd, Phys. Rev., 1962, 127, 750 CrossRef CAS.
- R. X. Yan, X. M. Sun, X. Wang, Q. Peng and Y. D. Li, Chem.–Eur. J., 2005, 11, 2183 CrossRef CAS.
- C. K. Jørgensen, Modern Aspects of Ligand-Field Theory, North Holland, Amsterdam, 1971 Search PubMed.
- R. S. Ningthoujam, V. Sudarsan and S. K. Kulshreshtha, J. Lumin., 2007, 127, 747 CrossRef CAS.
- L. Li, Y. Su and G. Li, J. Mater. Chem., 2010, 20, 459 RSC.
- (a) T. Förster, Ann. Phys., 1948, 2, 55 CrossRef; (b) D. L. Dexter, J. Chem. Phys., 1953, 21, 836 CrossRef CAS.
- G. S. Ofelt, J. Chem. Phys., 1962, 37, 511 CrossRef CAS.
- D. Curie, Luminescence in Crystals, John Wiley & Sons Inc. London, 1st edn, 1960 Search PubMed.
- F. Auzel, Chem. Rev., 2004, 104, 139 CrossRef CAS.
- J. A. Capobianco, P. P. Proulx, M. Bettinelli and F. Negrisolo, Phys. Rev. B: Condens. Matter, 1990, 42, 5936 CrossRef CAS.
- H. Wen, G. Jia, C. K. Duanw and P. A. Tanner, Phys. Chem. Chem. Phys., 2010, 12, 9933 RSC.
- S. Ray, P. Pramanik, A. Singha and A. Roya, J. Appl. Phys., 2005, 97, 094312 CrossRef.
- J. C. Boyer, F. Vetrone, J. A. Capobianco, A. Speghini and M. Bettinelli, J. Phys. Chem. B, 2004, 108, 20137 CrossRef CAS.
- G. Nishimura and T. Kushida, Phys. Rev. B, 2005, 37, 9075 CrossRef.
- V. Sudarsan, F. C. J. M. van Veggel, R. A. Herring and M. Raudseppc, J. Mater. Chem., 2005, 15, 1332 RSC.
- (a) N. Yaiphaba, R. S. Ningthoujam, N. S. Singh, R. K. Vatsa, N. R. Singh, S. Dhara, N. L. Misra and R. Tewari, J. Appl. Phys., 2010, 107, 034301 CrossRef; (b) N. S. Singh, R. S. Ningthoujam, M. N. Luwang, S. D. Singh and R. K. Vatsa, Chem. Phys. Lett., 2009, 480, 237 CrossRef CAS; (c) N. S. Singh, R. S. Ningthoujam, N. Yaiphaba, S. D. Singh and R. K. Vatsa, J. Appl. Phys., 2009, 105, 064303 CrossRef.
- E. M. Goldys, K. D. Tomsia, S. Jinjun, D. Dosev, I. M. Kennedy, S. Yatsunenko and M. Godlewski, J. Am. Chem. Soc., 2006, 128, 14498 CrossRef CAS.
Footnotes |
| † Electron Supplementary Information (ESI) available. See DOI: 10.1039/c2ra22144f |
| ‡ This paper is dedicated to Professor N. S. Gajbhiye on the occasion of his 60th birthday. |
| This journal is © The Royal Society of Chemistry 2012 |


 ,
,  ),
),