DOI:
10.1039/C2RA20763J
(Paper)
RSC Adv., 2012,
2, 10854-10858
Preparation, microstructure and crystal structure studies of Li+ co-doped YPO4:Eu3+†
Received
25th April 2012
, Accepted 9th September 2012
First published on 17th September 2012
Abstract
Rod-like shape particles of tetragonal phase Li+ co-doped YPO4:Eu samples are prepared by using a polyol method at low temperature (∼100–120 °C for 1 h). Li+ co-doping enhances the crystalline nature of the sample and reduces the agglomeration among the particles. The shift in the reflection peaks of the tetragonal phase to the lower 2θ angle in the X-ray diffraction pattern indicates the occupancy of Li+ ions in the interstitial sites of the host lattice. The point group symmetry of Y3+/Eu3+ in YPO4 is demonstrated in simple representation.
1 Introduction
The luminescence properties of rare earth ion-doped nanomaterials (Ln3+) have been attractive because their properties differ from the bulk and have been adopted extensively in optoelectronic device fabrications.1–6 In recent years, the emission intensity of Ln3+ doped nanoparticles have been significantly enhanced by introducing Li+, Ag+ and core-shell formations, etc.2,7 Due to the small size of a Li+ ion incorporated in an inorganic host, it will change the shape and size of particles and crystalline nature of the samples. However, the intensities of electric and magnetic dipole transitions of the Eu3+ ion also depend on Li+ ion concentration/defects created in the host which is discussed elsewhere.4 Moreover the structural changes that happen in the YPO4:Eu host due to the incorporation of the Li+ ion have not been studied much in literature. Recently, Ocana and his co-workers8 prepared Eu, Ce, Tb and Ce–Tb-doped YPO4 nanoparticles in ethylene glycol (EG) solution. They showed high quantum yield (QY). The QY is found to be 60% for Eu3+-doped YPO4 and 80% for Tb3+-doped YPO4 samples. Due to high stability, both chemically and thermally, high QY and low toxicity, the YPO4 host can be used in a variety of technological and biomedical applications.
In this article, we have discussed the preparation of Li+ co-doped YPO4:Eu nanoparticles (Li+ = 0, 3, 5, 7 and 10 at.%) using a polyol method, followed by annealing at 900 °C in order to increase the crystallinity. Its structural properties are studied using a Rietveld refinement on the X-ray diffraction (XRD) pattern, FTIR (Fourier transform infrared) spectroscopy and TEM (transmission electron microscopy) techniques. Also, the point group symmetry of YPO4 is explained in a very simple representation of symmetry operations/elements. The particles prepared from the polyol method are highly crystalline and non-agglomerated. Here EG (ethylene glycol) is used as both the capping agent as well as the reaction medium.
2 Experimental section
2.1 Reagents and materials
Yttrium oxide (Y2O3, 99.99%, Sigma Aldrich), ammonium dihydrogen phosphate (NH4H2PO4, 99.999%, Sigma Aldrich), europium oxide (Eu2O3, 99.99%, Sigma Aldrich), lithium hydroxide (LiOH, 99.99%, Sigma Aldrich), nitric acid, ethanol and ethylene glycol (EG) from SD Fine Chemicals Limited were used as received without further purification. Double distilled water was used in the experiment.
2.2 Synthesis
The samples of Eu3+ (5 at.%) doped YPO4 (i.e., YPO4:Eu) and Li+ (Li+ = 3, 5, 7 and 10 at.%) co-doped YPO4:Eu were prepared using a polyol route at low temperature (∼100–120 °C for 1 h). In typical synthesis procedure of 5 at.% Li+ co-doped YPO4:Eu, 1 g of Y2O3, 0.086 g of Eu2O3 and 0.012 g of LiOH were dissolved together in concentrated nitric acid (HNO3) and were heated at 80 °C with the addition of double distilled water in order to remove the excess acid. To this 1.13 g of NH4H2PO4 dissolved in 10 ml of distilled double water and 100 ml of EG were added. The solution was stirred for 2 h and followed by 1 h sonication for uniform mixing. The reaction mixture was heated at 100–120 °C for 1 h under refluxing conditions until the white precipitation was completed. EG molecules act as a solvent as well as capping agent during the preparation of the YPO4 nanoparticles. When the nucleation starts, the surrounding EG molecules cap smaller particles and thus, particle growth is hindered. The agglomeration among the particles is hindered. The precipitate so obtained was washed two times by centrifugation in ethanol to remove the excess of EG, and then dried at ambient atmosphere and room temperature for four days. Finally, the as-prepared sample was annealed at 900 °C in ambient atmosphere at a rate of 2 °C min−1 for 4 h in order to remove the dangling bonds on the surface of nanoparticles. 900 °C annealed samples are studied here because they have high crystallinity.
2.3 Characterization
The crystal phase of the samples was identified by an X-ray diffractometer (XRD) using PW 1071 Philips powder with Ni filtered Cu-Kα (1.5405 Å) radiation having tube voltage ∼30 kV and current ∼20 mA. XRD patterns recorded in the angular range 10° ≤ 2θ ≤ 70° with a step size of Δ2θ = 0.02°. The average crystallite size (D) was calculated from Scherrer relation:
| |

| (1) |
where
λ is the wavelength of the X-ray and
βhkl is the full width at half maximum (
FWHM) of the peak of the
XRD pattern.
9 Moreover,
XRD data was recorded on a PANalytical diffractometer using Cu-Kα radiation (40 kV voltage and 30 mA current with a step size 0.02° and 1.8 s per step) for Rietveld analysis. The X-ray data was analyzed using
Fullprof software.
10 Structure representation is generated from Diamond Software Program (version 3.0a).
The samples were examined by a transmission electron microscope (TEM, JEOL) and 200 kV acceleration voltage was used for the experiment. The high resolution TEM (HRTEM) images are recorded at 300 kV using FEI Titan Microscopy. For TEM measurement the samples were ground using a mortar and dispersed in ethylene glycol followed by ultrasonication for 1 h. A drop of the dispersed particles was put over the carbon coated copper grid and evaporated to dryness in the ambient atmosphere. The Fourier transform infrared (FTIR) spectrum was measured with a FTIR spectrometer (Bomem MB 102) with a resolution of 1 cm−1 using the KBr pellet technique.
3 Results and discussion
3.1 Structural study
Fig. 1(a) shows the XRD patterns of 0 and 10 at.% Li+ co-doped YPO4:Eu. It clearly shows the increase in crystallinity due to the addition of Li+ ion in YPO4:Eu. Tetragonal phase is formed and planes are assigned to pattern. Fig. 1(b) shows the expanded region of (hkl = 200) peak of all samples (Li+ = 0, 3, 5, 7 and 10 at.%). The data in the range 25 to 27° in 2θ are collected on the same day (5 min duration of each sample within a 1 h period) to minimize error from temperature and instrumental factor. The (200) peak position is shifted to lower 2θ from 25.88 to 25.77° and the full width at half maximum (FWHM) decreases from 0.47° to 0.13° when the Li+ ion concentration increases up to 10 at.% (shown as inset of Fig. 1(b)). Similarly, other peaks shift to lower 2θ on Li+ co-doping. The crystallite sizes corresponding to Li+ = 0, 3, 5, 7 and 10 at.% co-doped YPO4:Eu are found to be ∼20, 23, 36, 42 and 60 nm indicating an increase of crystallite size on Li+ co-doping. The unit cell parameters and volume for 0 and 10 at.% doped Li+ doped YPO4:Eu are found to be a = 6.879 Å, c = 6.010 Å and V = 284.4 Å3 and a = 6.891 Å, c = 6.030 Å and V = 286.4 Å3, respectively. These values are comparable with JCPDS card no: 11-0254, a = 6.904 Å, c = 6.035 Å and V = 287.66 Å3. When we see the ionic radii of Y3+/Eu3+ ion (∼0.9–1.0 Å) and Li+ ion (∼0.76 Å),11 it is expected to decrease in unit cell volume. In this study, the addition of Li+ ion concentration enhances the unit cell volume significantly (i.e. unit cell expansion). This will be related to the occupancy of Li+ ions in the interstitial sites rather than Y3+ ion sites. However, we could not observe any extra impurity peaks up to 10 at.% Li+ co-doping.
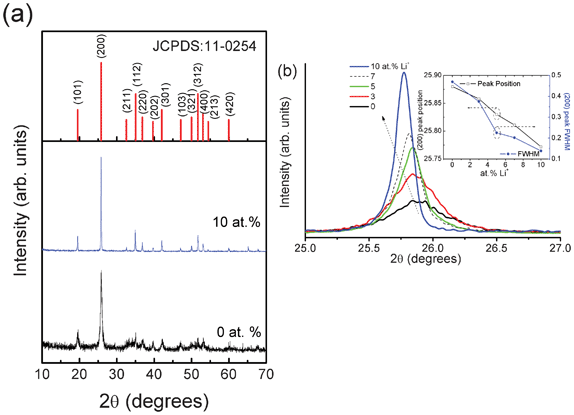 |
| | Fig. 1 XRD patterns of (a) YPO4:Eu and 10 at.% Li+ co-doped YPO4:Eu, (b) shifting of (200) peak with Li+ ion concentration. Inset shows the change in peak position and FWHM of (200) peak in 2θ. | |
The XRD pattern of 5 at.% Li+ co-doped YPO4:Eu is recorded using PANalytical XRD diffractometer and used as input data for Rietveld analysis using Fullprof software. The structural parameters were refined with the Rietveld method using WinPLOTR (April 2010) program.12 We used a 6 coefficient polynomial function for the background and a pseudo-Voigt function for peak profile fitting. Isotropic atomic displacement parameters (B) are used for all atoms. Fig. 2 shows Rietveld-XRD plot of 5 at.% Li+ co-doped YPO4:Eu sample. In the tetragonal structure of YPO4 (Fig. 3a), Y is surrounded by 8O with two different bond lengths (4(Y–O1 = 2.3025 Å) and 4(Y–O2 = 2.3667 Å)) and P is surrounded by 4O with equal bond lengths (P–O = 1.5504 Å). Positions of atoms: Y (0, 0.750, 0.125), P (0, 0.25, 0.375) and O (0, 0.072, 0.213). Bragg R-factor = 14.5, Rf-factor = 12.4, χ2 = 7.67. Between YO8 and PO4 units, 2O are corner-sharing (Fig. 3b). PO4 (tetrahedron) has S4 symmetry whereas YO8 (dodecahedron) has D2d symmetry.
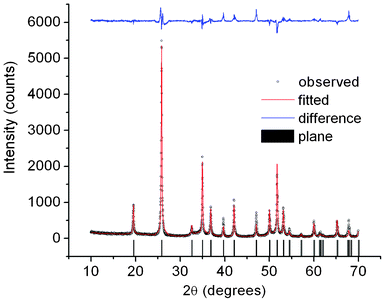 |
| | Fig. 2 Rietveld-XRD plot of 5 at.% Li+ co-doped YPO4:Eu. | |
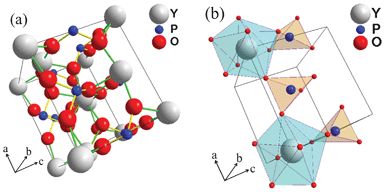 |
| | Fig. 3 (a) Crystal structure of YPO4 (tetragonal). (b) Polyhedral representations of PO4 (tetrahedron) and YO8 (dodecahedron) linkage along the a-axis. | |
The symmetry elements/operations present in YO8 are shown in Fig. 4. The principal axis is C2 along the z-axis (i.e. C2(z), which means 360°/2 = 180° rotation) and another 2C2 operations along the x and y-axes (i.e. C2′(x) and C2′′(y)). This becomes D2. Is there horizontal plane along the xy-axes? No, there is no horizontal plane along the xy-axes. The possibility of D2h is ruled out. Along the xz- and yz-axes, there are no possibilities of vertical planes. Thus, D2v is ruled out. Interestingly, there are two planes between x and y-axes and these are known as the dihedral planes (i.e. diagonal of cube or rectangle). The symmetry point group is D2d. Here point refers common point (i.e. Y), which is not shifted by any of the symmetry operations.13 In addition, there is another symmetry operation called S4 (90° rotation followed by a reflection plane perpendicular to the rotation axis or vice versa, i.e. they are commutable) and this is shown in Fig. 5.
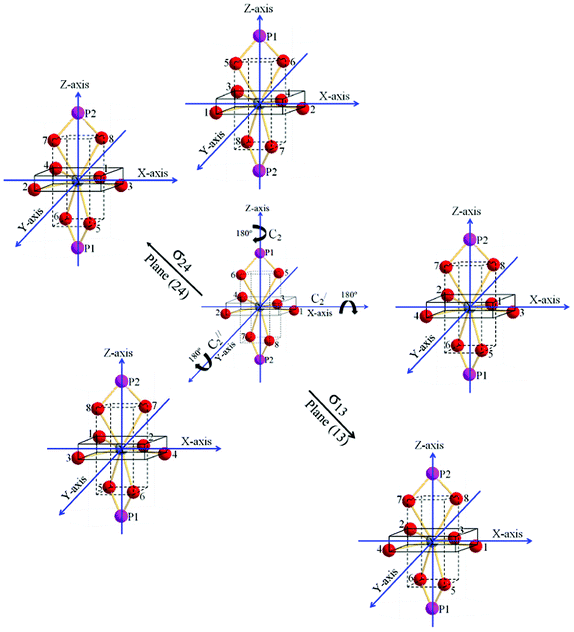 |
| | Fig. 4 Symmetry elements (C2(Z)-principal axis, C2′(X), C2′′(Y), σ13 and σ24) of point group D2d in YPO4 tetragonal structure. | |
 |
| | Fig. 5 Another S4 symmetry element of point group D2d. | |
3.2 FTIR study
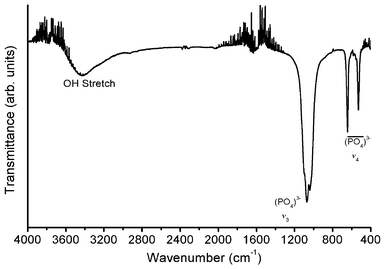
Fig. 6 shows the FTIR spectrum of 5 at.% Li+ co-doped YPO4:Eu in the 4000–400 cm−1 range. The peaks at 531 and 644 cm−1 correspond to the bending vibration of PO43− (termed as the v4 region).14 The band centered at 1071 cm−1 along with humps at 1040 and 1099 cm−1 correspond to the stretching vibration of PO43− (termed as the v3 region) and these peak positions are comparable with reported values.15 The vibration intensity of the v3 region is found to be 2.2 times stronger than the v4 region. We do not find any extra phosphorus-containing groups such as P2O74− which is generally observed at 1265 cm−1.16 The peaks corresponding to bending and stretching vibrations of O–H/H2O are assigned at 1624 and 3433 cm−1, respectively and these are due to adsorption over the surface of the particles.
3.3 TEM study
Fig. 7 (a) shows the TEM image of 3 at.% Li+ co-doped YPO4:Eu in bright field condition. The shape of the particle is found to be a rod 38 nm in length and 12 nm in width. Inset shows its selected area electron diffraction (SAED) pattern. Its high resolution TEM (HRTEM) image is shown in Fig. 7 (b). The lattice spacing is found to be 3.458 Å which matches with the (hkl) = (200) plane of the tetragonal phase.
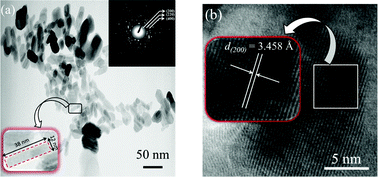 |
| | Fig. 7 (a) TEM images of 3 at.% Li+ co-doped YPO4:Eu (inset shows its SAED pattern and expanded view of a single nanorod having an average dimension of 38 nm in length and 12 nm in width) and (b) its HRTEM image. | |
4 Conclusions
Structural properties of Li+ co-doped YPO4:Eu are discussed in this article. Shifting of the (200) XRD peak to lower angles with the addition of Li+ indicates that Li+ ions occupy interstitial sites rather than Y3+/Eu3+ sites. Li+ co-doping significantly improves the crystallinity. The crystallite sizes corresponding to Li+ = 0, 3, 5, 7 and 10 at.% co-doped YPO4:Eu are found to be ∼20, 23, 36, 42 and 60 nm, respectively. Fullprof software is used to refine the structural parameters of samples. It is shown that samples have tetragonal structure and Eu3+/Y3+ ion has D2d symmetry. HRTEM image shows that particles are grown along the (200) plane having a d-space of 3.458 Å.
Acknowledgements
This work has been sponsored by the University Grants Commission (UGC) under the D. S. Kothari Postdoctoral Fellowship Scheme (No.F.4-2/2006(BSR)/13-309/2008(BSR)) to Dr A. K. Parchur. Authors thank Dr T. Mukherjee, Chemistry Group and Dr D. Das, Dr R. K. Vatsa and Mr. R. Shukla, Chemistry Division, BARC for their support and encouragement during this work.
References
-
(a) K. Ariga, A. Vinu, Y. Yamauchi, Q. Ji and J. P. Hill, Bull. Chem. Soc. Jpn., 2012, 85, 1 CrossRef CAS;
(b) A. K. Parchur and R. S. Ningthoujam, Dalton Trans., 2011, 40, 7590 RSC;
(c) A. K. Parchur, R. S. Ningthoujam, S. B. Rai, G. S. Okram, R. A. Singh, M. Tyagi, S. C. Gadkari, R. Tewari and R. K. Vatsa, Dalton Trans., 2011, 40, 7595 RSC;
(d) G. S. R. Raju, E. Pavitra, Y. H. Ko and J. S. Yu, J. Mater. Chem., 2012, 22, 15562 RSC.
- A. K. Parchur, A. I. Prasad, A. A. Ansari, S. B. Rai and R. S. Ningthoujam, Dalton Trans., 2012, 41, 11032 RSC.
-
(a) A. K. Parchur, A. I. Prasad, S. B. Rai, R. Tiwari, R. K. Sahu, G. S. Okram, R. A. Singh and R. S. Ningthoujam, AIP Adv., 2012, 2, 32119 CrossRef;
(b) A. K. Parchur, G. S. Okram, R. A. Singh, R. Tewari, L. Pradhan, R. K. Vatsa and R. S. Ningthoujam, AIP Conf. Proc., 2010, 1313, 391 CrossRef CAS.
- A. K. Parchur and R. S. Ningthoujam, RSC Adv., 2012 10.1039/c2ra22144f.
- N. K. Sahu, R. S. Ningthoujam and D. Bahadur, J. Appl. Phys., 2012, 112, 014306 CrossRef.
-
R. S. Ningthoujam, Enhancement of luminescence by rare earth ions doping in semiconductor host, Edited by S. B. Rai, and Y. Dwivedi, Nova Science Publishers Inc, USA, Chapter 6, pages 145–182, 2012 Search PubMed.
-
(a) A. Kar and A. Patra, Nanoscale, 2012, 4, 3608 RSC;
(b) W. Xu, X. Bai, S. Xu, Y. Zhu, L. Xia and H. Song, RSC Adv., 2012, 2, 2047 RSC;
(c) H. Lai, H. Yang, C. Tao and X. Yang, Phys. Status Solidi A, 2007, 204, 1178 CrossRef CAS.
- S. Rodriguez-Liviano, F. J. Aparicio, T. C. Rojas, A. B. Hungría, L. E. Chinchilla and M. Ocana, Cryst. Growth Des., 2012, 12, 635 CAS.
-
B. D. Cullity, Elements of X-ray Diffraction, Addision-Wesley, Reading, MA, USA, 1959 Search PubMed.
-
J. Rodriguez-Carvajal, FullProf: Institut Laue-Langevin: Grenoble, France, July 2010 Search PubMed.
- R. D. Shannon, Acta Crystallogr., Sect. A: Cryst. Phys., Diffr., Theor. Gen. Crystallogr., 1976, 32, 751 CrossRef.
-
T. Riosnel and J. Rodriguez-Carvajal, WinPLOTR, 2010, Search PubMed
http://www-llb.cea.fr/fullweb/winplotr/winplotr.htm
.
-
F. A. Cotton, Chemical application of group theory, Wiley Eastern Limited: New Delhi, Second edition, 1989 Search PubMed.
-
W. Kemp, Organic Spectroscopy, Macmillan: Hampshire, UK, 1975 Search PubMed.
-
(a) G. M. Begun, G. W. Beall, L. A. Boatner and W. J. Gregor, J. Raman Spectrosc., 1981, 11, 273 CrossRef CAS;
(b) H.-X. Mai, Y.-W. Zhang, L.-D. Sun and C.-H. Yan, Chem. Mater., 2007, 19, 4514 CrossRef CAS;
(c) C.-H. Yan, L.-D. Sun, C.-S. Liao, Y.-X. Zhang, Y.-Q. Lu, S.-H. Huang and S.-Z. Lü, Appl. Phys. Lett., 2003, 82, 3511 CrossRef CAS;
(d) N. Yaiphaba, R. S. Ningthoujam, N. R. Singh and R. K. Vatsa, Eur. J. Inorg. Chem., 2010, 2682 CrossRef CAS.
-
(a) W. Di, X. Zhao, S. Lu, X. Wang and H. Zhao, J. Solid State Chem., 2007, 180, 2478 CrossRef CAS;
(b) H.-X. Mai, Y.-W. Zhang, L.-D. Sun and C.-H. Yan, Chem. Mater., 2007, 19, 4514 CrossRef CAS;
(c) C.-H. Yan, L.-D. Sun, C.-S. Liao, Y.-X. Zhang, Y.-Q. Lu, S.-H. Huang and S.-Z. Lü, Appl. Phys. Lett., 2003, 82, 3511 CrossRef CAS.
Footnote |
| † This paper is dedicated to Professor N. S. Gajbhiye on the occasion of his 60th birthday. |
|
| This journal is © The Royal Society of Chemistry 2012 |
Click here to see how this site uses Cookies. View our privacy policy here. 


