Facile synthesis of laminate-structured graphene sheet–Fe3O4 nanocomposites with superior high reversible specific capacity and cyclic stability for lithium-ion batteries†
Chundong
Wang
a,
Qiumei
Zhang
b,
Qi-Hui
Wu
a,
Tsz-Wai
Ng
a,
Tailun
Wong
a,
Jianguo
Ren
a,
Zhicong
Shi
b,
Chun-Sing
Lee
a,
Shuit-Tong
Lee
a and
Wenjun
Zhang
*a
aCenter of Super-Diamond and Advanced Films (COSDAF) and Department of Physics and Materials Science, City University of Hong Kong, Hong Kong SAR, China. E-mail: apwjzh@cityu.edu.hk; Tel: +852 34427433
bCenter for Green Products and Processing Technologies, Guangzhou HKUST FOK Ying Tung Research Institute, Guangzhou 511458, China
First published on 17th September 2012
Abstract
A facile one pot hydrothermal method has been developed to synthesize laminate-structured graphene sheet–Fe3O4 nanocomposites (GNS–Fe3O4). Fe3O4 nanoparticles were decorated densely and homogeneously in the graphene matrix. Galvanostatic charge–discharge cycling of the GNS–Fe3O4 nanocomposites exhibited a reversible specific capacity over 1200 mAh g−1 at 100 mA g−1 without palpable fading for 50 cycles in the voltage range 0.01–3.0 V. A cell for the rate capacity test indicated a high current density of 946 mAh g−1 at a cycling rate of 1000 mA g−1, which could be fully recovered to 1359 mAh g−1 at 100 mA g−1 after 50 cycles. The superior electrochemical performance of the nanocomposites can be attributed to the following factors: (i) the thermal expanded graphene oxide (TEGO) under atmosphere could attach more oxygen functional groups than the hydrogen reduced graphene, which benefited the adsorption and fastness of the nano-sized Fe3O4; (ii) annealing of TEGO–Fe3O4 nanocomposites further improved the conductivity of the graphene matrix, providing a high electron transport rate at the electrode–electrolyte interface; (iii) the laminated structure of nanocomposites could prevent the agglomeration of Fe3O4 nanoparticles and the restacking of graphene sheets, and effectively release the strain caused by the volume expansion of the Fe3O4 nanoparticles, facilitating ion/electron transportation within the electrode and at the electrode–electrolyte interface.
Introduction
With the steady increase in demand for clean and efficient energy storage devices due to ever-rising concerns about limited global energy supplies and environmental and climate change, rechargeable lithium-ion batteries (LIBs) have attracted worldwide attention both in the scientific and industrial fields for their high energy density, fast charge–discharge rate, and durable cycling performance. In order to meet the requirements of practical applications, many novel electrode materials with improved electrochemical performance for LIBs have been proposed. Among them, transition metal oxide nanomaterials, such as Co3O4, Fe2O3, and Fe3O41–4 have been demonstrated as attractive anode materials for rechargeable LIBs due to their high theoretical capacities and promising potentials. In the reaction mechanism it is believed that the metal oxide nanomaterials can react reversibly with lithium via a conversion reaction to form lithium oxide and metal nanoparticles: MOχ + 2χLi ⇔ M + χLi2O,5,6 which has been suggested to exhibit a larger rechargeable capacity.Among these transition metal oxides, Fe3O4 has been considered as one of the most promising electrode materials because of its natural abundance, low cost and environmental benignity. However, during the discharging process, the released oxygen combines with incoming lithium ions to form Li2O and causes a significant volume expansion.7,8 This large volume variation leads to the aggregation of the oxide nanoparticles during continuing cycling, which weakens the electrical connectivity, resulting in anode disintegration, and consequently induces a large irreversible capacity loss and poor cycling stability. Extensive work has been performed to mitigate the pulverization and further enhance the stability of the anode materials, such as the synthesis of Fe3O4–carbon nanocomposites by embedding Fe3O4 nanoparticles into a disordered carbon matrix.4,9 However, it is difficult to homogeneously distribute the nanoparticles in a carbon matrix during the preparation process. The nanoparticles easily agglomerate to form secondary aggregates during continuous cycling, which debases the stability of the electrodes. Another possible structure is Fe3O4@carbon core@shell nanocomposites.7,10 The carbon coating tightly wraps the surface of the oxide nanoparticles effectively preventing the release of the large strain caused by volume expansion, but it also increases the resistance of the electrode due to the prolonged distance of the lithium ions to the core of the active materials and decreases the capacity of the oxide nanomaterials. Therefore, designing nanostructures to effectively disperse the oxide nanomaterials has been proposed as an impactful method to improve the reversible capacity and cycling stability of the oxide anode electrodes.7,11,12
Graphene sheets (GNS), have been reported with extraordinarily high electrical conductivity (∼3080 W mK−1), superior thermal conductivity, flexible porous structure, unique mechanical properties, and an ultrahigh specific surface area (over 2600 m2 g−1).13–16 These novel properties make them ideal matrices in anchoring the large numbers of functional nanomaterials applied in energy storage and conversion devices.15,17,18 Recently, GNS have been widely used as templates to encapsulate other controllable nanostructure materials to prepare graphene-based nanocomposite anodes for rechargeable LIBs, such as GNS–Mn3O4,19 GNS–Fe3O4,11,20,21 GNS–SnO2,22 GNS–TiO2,23,24 GNS–Si25,26 and GNS–S.27 These composite anodes have demonstrated large reversible capacities, long cycle lives, and good rate performances. In this work, one simple and novel approach was used to synthesize GNS–Fe3O4 nanocomposites directly from TEGO and ferric citrate (FeC6H5O7) in solution. Note that the thermal expanded graphene oxide (TEGO), which was thermally expanded at 1000 °C under an ambient environment, could attach more oxygen functional groups than the hydrogen-reduced graphene oxide (GO). Therefore, the Fe3O4 nanoparticles can be more efficiently anchored on to the TEGO surface, which avoids the adding of other molecular linkers to bridge the nanoparticles and the graphene matrix. The main novelty of this work is that the assembly of GNS and nano-sized Fe3O4 particles into GNS–Fe3O4 nanocomposites is performed in one step where the TEGO sheets act as precursor templates. This simple, environmentally benign and low cost method verified that the GNS can not only prevent agglomeration efficiently and accommodate the volume change of the Fe3O4 nanoparticles during the charging and discharging processes, but also improve the electrical conductivity of the electrode.
Experimental section
GO was prepared from purified natural graphite powder (No. 15553, Riedel-dehaën) according to the modified Hummers method.28–30 In detail, 0.5 g graphite powder and 0.45 g NaNO3 were put into a flask placed in an ice bath environment. Then 25 ml concentrated H2SO4 (purity 98%) was slowly added into the flask. The mixture was then stirred slowly by gradually intermingling 2.25 g KMnO4 (purity 95%). After 30 min, the ice bath was removed and replaced instead by a water bath at 35 °C, and the liquid mixture was kept intensively stirring for one week. Afterwards, 25 ml deionized water was added into the flask gently before the mixture was further stirred for 15 min to cool down. Finally, 30% H2O2 aqueous solution was added into the flask to finish the whole reaction until no bubbles were observed. The resultant products were washed with 10 wt% HCl solution three times and then rinsed with deionized water repeatedly until the pH of the supernatant was neutral. At the end, a brown homogeneous dispersionless GO was obtained after drying in a vacuum oven.TEGO was obtained by performing a thermal expansion of the as-prepared GO. After a muffle furnace was heated up to 1000 °C, a crucible loaded with a small amount of GO was placed into the center of the muffle furnace quickly for 30 s under an ambient environment. 10 mg TEGO dissolved in deionized water (20 ml) was sonicated in a beaker for 4 h for homogeneous dispersion. 0.4 g Ferric citrate (FeC6H5O7) dissolved in deionized water (10 ml) was mixed with the TEGO containing solution in a 50 ml Teflon-lined stainless steel autoclave directly without any other treatment. The sealed Teflon-lined autoclave was put into an oven at 200 °C for 24 h and then cooled to room temperature naturally. The as-prepared black precipitate was centrifugally washed with deionized water and alcohol several times and then dried in a vacuum oven at room temperature followed by annealing at 400 °C in an argon environment for 4 h to obtain GNS–Fe3O4. The whole synthesis process is demonstrated schematically in Scheme 1. In comparison, the same synthesis procedure was carried out to prepare pure Fe3O4 nanoparticles without adding TEGO.
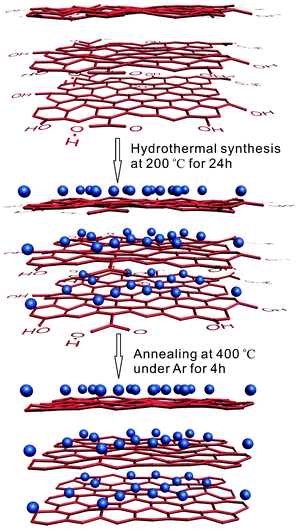 | ||
| Scheme 1 A schematic diagram of the synthesis process of GNS–Fe3O4, the blue balls represent the Fe3O4 nanoparticles. | ||
The composition and crystallography of the products were determined by an X-ray diffractometer (XRD, Philips X'Pert MRD with Cu-Kα radiation, 40 kV, 30 mA). The morphology and structure of the samples were characterized using a scanning electron microscope (SEM, Philips XL-30 FESEM) and transmission electron microscope (TEM, CM 20 FEG operated at 200 kV), thermal gravimetric/differential scanning calorimetry (TG/DSC) was performed on a TGA, Q50 under air with a heating rate of 10 °C min−1 from ambient temperature to 800 °C. The Brunauer–Emmett–Teller (BET) special surface area was confirmed by Quantachrome instruments (NOVA 1200). The elemental states in GO, TEGO and GNS–Fe3O4 nanocomposites were revealed on a X-ray photoelectron spectrometer (XPS, VG ESCALAB 220i-XL) equipped with a monochromatic Al Kα (1486.6 eV) X-ray source.
The electrochemical responses of GNS–Fe3O4, TEGO and bare Fe3O4 were measured with CR2025 coin-type half-cells assembled in an argon-filled glove box (MBRAUN LAB MASTER 130). The working electrodes were fabricated by a mixture of 80 wt% active materials (GNS–Fe3O4, TEGO, or bare Fe3O4), 10 wt% acetylene black, and 10 wt% polyvinylidene difluoride (PVDF) binder with N-methyl-2-pyrrolidone (NMP) solution. Then the resultant slurry was uniformly pasted on a copper foil current collector by a plastic blade. A Celgard 2400 microporous polypropylene membrane was applied as the separator, 1.0 mol L−1 of LiPF6 solution in a mixture with ethylene carbonate (EC)–dimethyl carbonate (DMC)–diethyl carbonate (DEC) (1![[thin space (1/6-em)]](https://www.rsc.org/images/entities/char_2009.gif) :
:![[thin space (1/6-em)]](https://www.rsc.org/images/entities/char_2009.gif) 1
1![[thin space (1/6-em)]](https://www.rsc.org/images/entities/char_2009.gif) :
:![[thin space (1/6-em)]](https://www.rsc.org/images/entities/char_2009.gif) 1, in V) was used as the electrolyte, and Li foil was used as the counter electrode. The cyclic voltammetric (CV) measurements were performed on an electrochemical workstation (AUTOLAB PGSTAT 101) at a scan rate of 0.1 mV s−1 in the range 3.00–0.01 V vs. Li/Li+ at room temperature.
1, in V) was used as the electrolyte, and Li foil was used as the counter electrode. The cyclic voltammetric (CV) measurements were performed on an electrochemical workstation (AUTOLAB PGSTAT 101) at a scan rate of 0.1 mV s−1 in the range 3.00–0.01 V vs. Li/Li+ at room temperature.
Results and discussion
Fig. 1 shows the XRD patterns of (a) GO, (b) TEGO, (c) Fe3O4, and (d) GNS–Fe3O4 nanocomposites. A strong peak located at ∼10.9° and a weak peak at 42.8° (the graphite-like (100) reflection) are found in Fig. 1(a). No observable peaks exist at around 26° (the graphite-like (002) reflection). This is because GO is suggested to be oxidized with oxygen-containing functional groups attached on the graphene sheets and this thus causes a lattice space increase in the (002) phase.31 These results are in accordance with the observations of other reports.32,33 The partial reduction of GO (TEGO) is confirmed in Fig. 1(b). A broad peak centered at 24.2° reveals that the TEGO should have an amorphous carbon structure with disordered stacking of the partially oxidized graphene sheets.33,34 The XRD diffraction patterns of bare Fe3O4 (shown in Fig. 1(c)) and GNS–Fe3O4 (shown in Fig. 1(d)) match well with magnetite Fe3O4 (JCPDS card 19-0629). Due to the small amount of GNS in GNS–Fe3O4 composites (characterized by TGA, and will be discussed in the following text), the TEGO XRD peak at 24.2° is not observed. However, a broad diffraction at around 12° appeared. The GNS–Fe3O4 composite was synthesized by a hydrothermal reaction with ferric citrate as precursor to grow Fe3O4 nanoparticles on graphene sheets. The peak at around 12° could also be associated with the interlayer expansion of the graphene sheets during the hydrothermal synthesis process.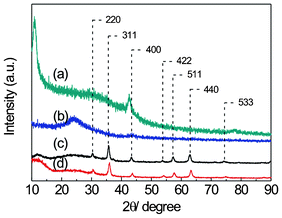 | ||
| Fig. 1 XRD patterns of (a) GO, (b) TEGO, (c) Fe3O4, and (d) GNS–Fe3O4. | ||
As the TEGO has been prepared by the thermal expansion of the as-synthesized GO at 1000 °C in an ambient atmosphere, more oxygen functional groups are expected to attach on to the graphene surface than thermal annealed graphene in a hydrogen atmosphere at 450 °C.35 In order to reveal the difference, XPS measurements were carried out. Fig. 2 shows the XPS spectra of GO, TEGO and GNS–Fe3O4. In Fig. 2(a), the survey spectra show that GO and TEGO are rather pure, only C and O emission lines can be seen in their spectra, and additional Fe peaks are detected in the GNS–Fe3O4 spectrum. The C/O ratio in GO and TEGO increases remarkably from 2.07 to 4.95, confirming that most of the attached epoxide and hydroxyl functional groups have been successfully removed by thermal annealing. For the hydrogen reduced GO, the C/O ratio is usually between 10.8 and 14.9,35 which is much larger than that of TEGO in this experiment. The C/O ratio of TEGO is somewhere between those of GO and hydrogen-reduced GO, which provides a good electronic conductivity to serve as the conductive channels between Fe3O4 nanoparticles, and also is more favorable to anchor the Fe3O4 nanoparticles during the hydrothermal process. To determine the chemical bonding of C in GO, TEGO, and GNS–Fe3O4, the C 1s core level spectra have also been measured and are shown in Fig. 2(b). For GO, it indicates that the C 1s spectra can be split into three components which correspond to a non-oxygenated ring C (sp2) at 284.5 eV, the C in the C–O bond at 286.6 eV, and the carboxylate carbon (O–C![[double bond, length as m-dash]](https://www.rsc.org/images/entities/char_e001.gif) O) at 288.3 eV. For TEGO, with respect to the C–C bond (284.5 eV), the peak intensities of the C–O (286.0 eV) and O–C
O) at 288.3 eV. For TEGO, with respect to the C–C bond (284.5 eV), the peak intensities of the C–O (286.0 eV) and O–C![[double bond, length as m-dash]](https://www.rsc.org/images/entities/char_e001.gif) O (288.4 eV) bonds become weaker obviously compared with those of GO. No distinct differences are found in the C 1s spectra between TEGO and GNS–Fe3O4. However the intensity ratio of (C–O + O–C
O (288.4 eV) bonds become weaker obviously compared with those of GO. No distinct differences are found in the C 1s spectra between TEGO and GNS–Fe3O4. However the intensity ratio of (C–O + O–C![[double bond, length as m-dash]](https://www.rsc.org/images/entities/char_e001.gif) O)/(C–C) for TEGO is 0.68, and for GNS–Fe3O4 it is 0.46. This change may contribute to the annealing of GNS–Fe3O4 at 400 °C in an argon atmosphere, which causes the TEGO to further reduce. This result is also supported by the Nyquist plots of TEGO and GNS–Fe3O4, as the resistance of TEGO–Fe3O4 is smaller than that of TEGO, which will be discussed later on.
O)/(C–C) for TEGO is 0.68, and for GNS–Fe3O4 it is 0.46. This change may contribute to the annealing of GNS–Fe3O4 at 400 °C in an argon atmosphere, which causes the TEGO to further reduce. This result is also supported by the Nyquist plots of TEGO and GNS–Fe3O4, as the resistance of TEGO–Fe3O4 is smaller than that of TEGO, which will be discussed later on.
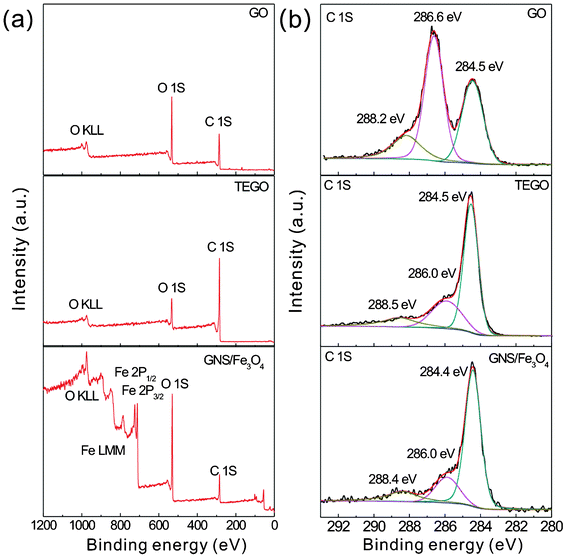 | ||
| Fig. 2 (a) XPS survey spectra of GO, TEGO and GNS–Fe3O4, (b) C 1s core level spectra of GO, TEGO and GNS–Fe3O4, the three C 1s peaks can be fitted by three peaks in each spectrum. | ||
The size, structure, and morphology of GNS–Fe3O4 and bare Fe3O4 were characterized by SEM and TEM. Fig. 3(a) is a low magnification image of GNS–Fe3O4 nanocomposites. It demonstrates a typical laminate-structured graphene prepared using chemical methods, and approximately 20–30 layers can be identified by the fact that the graphene platelet thickness ranged from 5 to 10 nm. For a more close observation, the enlarged SEM image of GNS–Fe3O4 is shown in Fig. 3(b). It reveals that the nano-sized Fe3O4 particles uniformly and compactly distributed over the whole of the graphene sheets. For comparison, the image of the reference bare Fe3O4 nanoparticles is displayed in Fig. 3(c). It implies that the Fe3O4 nanoparticles agglomerate together and form a big cluster. Fig. 3(d) presents the low magnification TEM image of the composite. It is evident that the two-dimensional graphene sheets are uniformly decorated by large amounts of spherical Fe3O4 nanoparticles. In the large magnification TEM image (Fig. 3(e)) the outline of the graphene sheets and Fe3O4 can be well observed and distinguished. In addition, there is no observable aggregation of Fe3O4 nanoparticles on the graphene sheets. It should be pointed out that even for a long sonication time in the preparation of the TEM sample, the nanoparticles still firmly adsorbed on the surface of the graphene sheets, suggesting strong interactions between the Fe3O4 and graphene. The inset of Fig. 3(e) shows the selected area electron diffraction (SAED) pattern of GNS–Fe3O4. It suggests that Fe3O4 is crystalline and the spotty diffraction rings could be indexed to Fe3O4 with cubic symmetry, while the diffuse contrast should be assigned to graphene. Fig. 3(f) shows the high-resolution TEM image. It reveals that the average size of Fe3O4 is about 8 nm, the crystal lattice fringes with d-spacings of 0.25 nm can be assigned to the (311) plane of the cubic Fe3O4, which is consistent with the XRD results in Fig. 1.
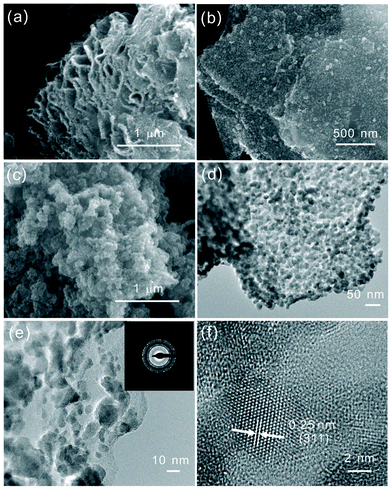 | ||
| Fig. 3 (a) and (b) SEM images of GNS–Fe3O4 nanocomposites with different magnifications, (c) SEM image of the bare Fe3O4 nanoparticles, (d) and (e) low and high magnification TEM images of GNS–Fe3O4 nanocomposites, (f) high resolution TEM image of the Fe3O4 nanoparticles anchored on graphene sheets. The inset of (e) is the SAED of GNS–Fe3O4. | ||
In order to further confirm that the Fe3O4 nanoparticles are uniformly distributed on the surface of the laminate-structured graphene sheets, energy dispersive X-ray spectroscopy (EDS) elemental mapping was performed on one selected area as indicated by the white dot rectangle in the SEM image (see Fig. 4). One can see that the whole region is evenly distributed by C (red), O (green), and Fe (purple) elements, which suggests that the Fe3O4 nanoparticles are homogeneously decorated on the surface of the graphene sheets.
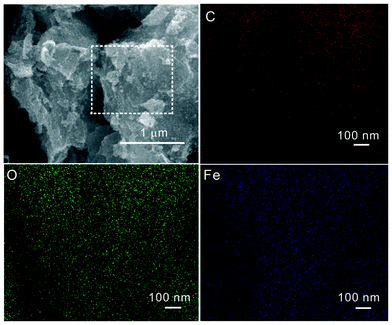 | ||
| Fig. 4 SEM image of GNS–Fe3O4 composites with one corresponding selected area, and EDS mapping for C, O, and Fe elements in this area. | ||
To quantify the amount of graphene in the GNS–Fe3O4 composites, TG/DSC analysis was performed in air with a flow rate of 10 ml min−1. The sample was heated from 30 to 800 °C at a rate of 10 °C min−1. As shown in Fig. 5, an intense exothermic peak at ∼419 °C is observed accompanied by a rapid mass loss from 342–478 °C. The content of the graphene was calculated to be 19.4 wt% based on the weight loss upon graphene combustion and the assumption that Fe3O4 is fully oxidized to Fe2O3 at around 400 °C in static air.
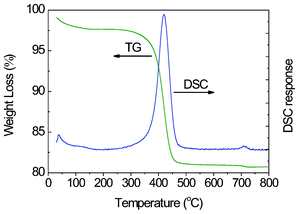 | ||
| Fig. 5 The TG/DSC curves of the GNS–Fe3O4 nanocomposites. | ||
N2 adsorption measurements were carried out to compare the BET special surface areas of TEGO and GNS–Fe3O4 as shown in Fig. 6. They demonstrate that the BET surface area of TEGO decreases dramatically from 162.7 m2 g−1 to 69.01 m2 g−1 with Fe3O4 nanoparticle decoration. Compared with previous reports,36,37 the BET surface area of our synthesized GNS–Fe3O4 is much larger than those of similar Fe3O4-carbon (graphene) composites. This observation may be ascribed to the particular laminate-structure of the graphene sheets and the small size of Fe3O4 nanoparticles as shown in Fig. 2(a) and (d). The small Fe3O4 nanoparticles anchored on the laminate-structured graphene sheets serve as spacers to effectively prevent the graphene sheets aggregating and restacking, which leads to a porous structure of GNS–Fe3O4 composites with a high specific surface area. A structure with a large surface area will facilitate the electrolyte ion diffusion to the active sites with less resistance and endure the volume change of the Fe3O4 particles during charge–discharge cycling.
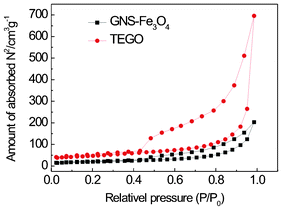 | ||
| Fig. 6 Nitrogen adsorption–desorption isotherm of TEGO and GNS–Fe3O4 at 77 K. | ||
To demonstrate the superiority of the unique GNS–Fe3O4 nanocomposites as anode materials for LIBs, we conducted an investigation on the electrochemical performance of these materials. Fig. 7(a) shows the charge–discharge profiles of GNS–Fe3O4 in the first three cycles at a current density of 100 mA g−1. In the first discharge curve, an extended voltage plateau at ∼0.84 V versus Li+/Li was observed, which is similar to the results reported for Fe3O4.38 Then the charge capacity becomes 1304 mAh g−1 after the cell has been fully recharged, which is much lower than the initial capacity of 2055 mAh g−1. It was suggested that the irreversible capacity loss in the first cycle should be attributed to the formation of a solid electrolyte interface (SEI) layer/film and the unreduced oxygenated functional groups on the graphene sheets.7,9,12 In addition, the poor conductivity of the Fe3O4–Fe–Li2O matrix formed during the first charge–discharge process may be another reason.9,39 There are several proposed strategies to mitigate the initial capacity loss, such as adding Li2.6Co0.4N, a lithium-rich compound, to the anode as a lithium source for SEI formation,40,41 and constructing artificial SEI layers using a stiff material (e.g. carboxymethyl cellulose (CMC)) to withstand the deformation in the anode materials.42 The second-cycle discharge curve is greatly different from the first one. Drastic, lithium-driven, structural or textural modifications may have happened during the first cycling process.43 However, from the second cycle, the GNS–Fe3O4 composites exhibit much better lithium storage performances without palpable decay during the charge–discharge process. Meanwhile, it is interesting to find that the third cycle even overlaps with the second one. To further identify the electrochemical reactions, CVs were conducted on the cell in the range 0.0–3.0 V with a scan rate of 0.1 mV s−1 (Fig. 7(b)). During the cathodic polarization process of the first cycle, four peaks are observed at 0.66, 0.94, 1.25, and 1.56 V. The broad peak, located at 0.66 V should be assigned to the reduction process such as Fe3O4 + 8Li+ + 8e− = 3Fe0 + 4Li2O and 2C + Li+ + e− = LiC238,44,45 and the irreversible reaction related to the decomposition of the electrolyte,46 while, for the other three peaks located at 0.94, 1.25, and 1.56 V, which are absent in continuous cycling, might be attributed to the formation of LixFe3O4.46,47 Two peaks are revealed at 1.62 and 1.91 V during the anodic scan, which should be attributed to the oxidation of Fe0 to Fe3O4. After the first cycle, both the cathodic and anodic peaks are positively shifted due to the polarization of the electrode after the first cycle. In addition, the CV curves almost overlap after the first cycle. The same result as obtained in Fig. 7(a) demonstrates the good reversibility of the cell.
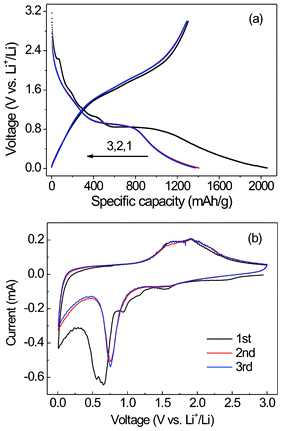 | ||
| Fig. 7 (a) Charge–discharge profiles of the 1st, 2nd and 3rd cycles, and (b) cyclic voltammograms (CVs) from the first to the third cycle at a scan rate of 0.1 mV s−1 of the GNS–Fe3O4 composites. | ||
The cycle performance of the GNS–Fe3O4 composites (with a GNS content of 19.4%, denoted as GNS–Fe3O4) is shown in Fig. 8(a). For comparison, the results of bare Fe3O4, as-prepared TEGO, and another GNS–Fe3O4 composite with a GNS content of 56.5 wt% (denoted as GNS–Fe3O4-#, the weight ratio of GNS is obtained from Fig. S1†) are also presented. For the bare Fe3O4, the initial discharge capacity is up to ∼1595 mAh g−1. However, the capacity continuously decreases and only 255 mAh g−1 remain after 50 cycles, which is only ∼16% of the initial capacity. The poor cycle performance of bare Fe3O4 was suggested to be caused by the inherent low electronic and ionic conductivity, as well as the large volume expansion during the lithium insertion and extraction cycling processes. The capacity of the as-prepared TEGO also decreases dramatically, from the initial 1590 mAh g−1 to 307 mAh g−1 after 50 cycles. The cycling performance of TEGO after annealing in an Ar atmosphere at 400 °C for 4 h was tested, as shown in Fig. S2.† Its performance is similar to that of the as-prepared TEGO; the capacity decays gradually from the initial 1388 mAh g−1 to 417 mAh g−1 at the 50th cycle. It demonstrates that the pure graphene anode has no distinct advantages over the pure Fe3O4 nanoparticles. Significantly, the GNS–Fe3O4 electrode shows a special high capacity over 1200 mAh g−1 even after 50 cycles with a current density of 100 mA g−1, which is 63% of the initial capacity (2058 mAh g−1). The stabilized capacity is clearly higher as compared with previous reports on Fe3O4@graphene or Fe3O4@C composites (600 ∼ 1100 mAh g−1 with most of the reports with less than 1000 mAh g−1) under the same current density.11,36,48–52 It is also noted that the capacity is higher than the theoretical one (818.5 mAh g−1, calculated on the basis of the theoretical capacity of 926 mAh g−1 for Fe3O4 with a content of 80.6 wt% and 372 mAh g−1 for graphene with a content of 19.4 wt%). The extra capacity probably comes from the formation of a SEI layer due to the decomposition of the electrolyte solvent.45,53–56 Moreover, extra high capacity has been widely observed in the transition metal oxide electrodes, which was suggested to be due to the formation of a gel-like organic layer on the surface of the hollow spheres or porous nanoparticles.56–58 Such hollow/porous structures may provide more active sites for lithium ion storage, and thus further improve the specific capacity. However, the exact mechanism for this phenomenon has not been fully understood.
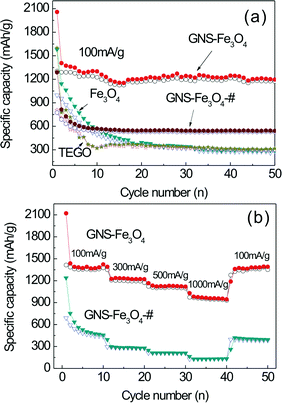 | ||
| Fig. 8 (a) Cycle performance of the bare Fe3O4, TEGO, GNS–Fe3O4 and GNS–Fe3O4-# composites between 0.0 and 3.0 V vs. Li/Li+ at a current density of 100 mA g−1, and (b) the rate performance of the GNS–Fe3O4 and GNS–Fe3O4-# composites, solid symbols, discharge; hollow symbols, charge. | ||
No obvious capacity loss is observed in the cycling performance, which indicates a good stability of the GNS–Fe3O4 composites. This excellent property confirms the speculation that the Fe3O4 nanoparticles anchored on the laminate-structured graphene sheets can serve as spacers to effectively prevent the graphene sheets aggregating and restacking to maintain a large capacity and excellent cycling stability. Both the SEM and TEM observations performed on the GNS–Fe3O4 composite electrode after the capacity test (shown in Fig. S3†) also support this point. The rate capacity of the GNS–Fe3O4 nanocomposites has been tested in another cell at different current densities from 100 to 1000 mA g−1 as shown in Fig. 8(b). An excellent rate capability was also achieved. Even at higher current densities such as 1000 mA g−1, the GNS–Fe3O4 nanocomposites still exhibited a high reversible specific capacity of 946 mAh g−1, which is much higher than other reported data on GNS–Fe3O4 composites under the same high current density.33,51,52 Another important result that needs to be emphasized is that after forty cycles with different current density even up to 1000 mA g−1, a stable highly reversible specific capacity of 1359 mAh g−1 could be recovered when the current density changed back to the initial 100 mA g−1.
The excellent cyclic stability and specific capacity retention of the GNS–Fe3O4 composites should be attributed to the small size of the synthesized Fe3O4 nanoparticles, which is less than 10 nanometres. Such a small size of the active materials can effectively bring down the mean diffusion time of the lithium ions by minimizing the diffusion length. Meanwhile, the diffusion coefficient can be maximized as the high rate interaction directly determines the rate capacity. In addition, the high surface area of the active nanoparticles can increase the electrode–electrolyte contact area and results in a faster diffusion rate of the lithium ions. The firmer interactions between the anchored Fe3O4 nanoparticles and graphene sheets make the lithium ions effectively and rapidly transfer back and forth from the Fe3O4 to the current collector through the highly conducting graphene framework. On the other hand, the strategy to adopt TEGO as the precursor results in the efficient decoration of the nano-sized Fe3O4 in the matrix. The annealing of the TEGO–Fe3O4 nanocomposites further improves the conductivity of the graphene matrix by reducing the TEGO via the removal of the attached oxygen functional groups, providing a high electron transport pathway through the electrode–electrolyte interface. Besides acting as the electronic transfer media, the flexible GNS effectively buffers the volume change of the Fe3O4 nanoparticles. Fe3O4 nanoparticles also effectively separate the graphene sheets and prevent their restacking, which maintains the porous structure of the composites during the charge–discharge cycle process. All the above merits of our synthesized GNS–Fe3O4 nanocomposites make them a superior material for LIBs with a high capacity and high stability.
The capacity of the GNS–Fe3O4-# composites is about 530 mAh g−1 after 50 cycles, which is lower than the sample GNS–Fe3O4. The increase of the GNS content leads to a significant drop of the capacity and rating performance. However, the coulombic efficiencies of the GNS–Fe3O4-# is about 60%, almost comparable to that of GNS–Fe3O4 (63%). The irreversible capacity, i.e. the initial capacity loss (ICL) is a great challenge in high capacity anode materials, especially transition metal oxide electrodes. Two major origins causing ICL have been suggested:59 (i) the conversion of the anode material from its pristine form to an active lithium storage host; (ii) the formation of a passivation layer (solid electrolyte interface (SEI)) on the active electrode surface within the initial few cycles. The ICL was also proposed to be attributed to the unreduced oxygenated functional groups on the graphene sheets.41,56,58 However, detailed knowledge about the ICL has not been fully established thus far due to the complexity of a formulated anode system. In transition metal oxide electrodes, the volume changes in lithium alloying–dealloying reactions are significant, which cause the SEI to be easily breached and allow the formation of nascent SEI on the new exposed surfaces. Such deconstruction and reconstruction processes would continue until no more new surfaces are created, resulting in the persistence of the ICL in the initial few cycles. For the GNS–Fe3O4 composites in this work, the experimental results suggest that the increase of the GNS content in the composite could not diminish the formation of the active lithium storage host and SEI layer. Therefore, comparable coulombic efficiencies were obtained for the samples with different GNS contents. Based on the above observations, an optimal GNS to Fe3O4 ratio may benefit from achieving balanced capacity and cycling stability of the anode, but has limited contribution to the reduction of ICL.
AC impedance measurements were conducted for TEGO, bare Fe3O4, and GNS–Fe3O4 nanocomposites to verify the origin of the improved electrochemical performance of the GNS–Fe3O4 nanocomposite electrode. Electrochemical impedance spectroscopy was carried out in the second full discharge state as the SEI film was successfully formed. The impedance response exhibits one semicircular loop at high frequency and a sloping straight line at low frequency. The intercept on the Z real axis in the high frequency region was ascribed to the resistance of the electrolyte, RS. The middle semicircle should correspond to the charge transfer resistance, RC1, arising from the charge transfer through the electrode–electrolyte interface. The inclined line in the low frequency range indicates the Warburg impedance, ZW, related to the solid-state diffusion of lithium ions in the electrode materials.60 In Fig. 9, the change of the semicircle diameter is obvious for bare Fe3O4, TEGO and GNS–Fe3O4 nanocomposites, from 450 kΩ cm−1, 200 kΩ cm−1 to 103 kΩ cm−1. The results demonstrate that the GNS–Fe3O4 nanocomposites suppress the charge-transfer resistance RC1 by increasing the charge transfer through the electrode–electrolyte. It also confirms that the annealing process of the as-synthesized GNS–Fe3O4 successfully removes some of the oxygen functional groups attached on the GNS and then increases the conductivity of the graphene framework as indicated in the XPS data shown in Fig. 2.
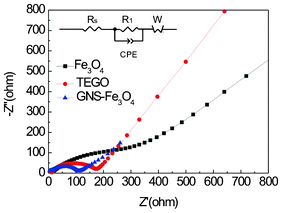 | ||
| Fig. 9 Nyquist plots of the TEGO, bare Fe3O4, and GNS–Fe3O4 nanocomposites. The applied frequency was in the range 100 kHz to 0.01 Hz with an excitation voltage of 10 mV. | ||
Conclusions
In summary, a novel one step simple and environmentally friendly hydrothermal approach, has been applied to synthesize GNS–Fe3O4 nanocomposites with high lithium capacity. The use of TEGO can increase the density of the homogeneous adsorption of Fe3O4 nanoparticles. The GNS–Fe3O4 nanocomposite electrode shows a high specific capacity over 1200 mAh g−1 at a current density of 100 mA g−1 with no detectable fading for 50 cycles. This is much higher than that of the bare Fe3O4 electrode, 255 mAh g−1. This superior performance may result from several advantages of our synthesized nanocomposites. The flexible laminate-structured GNS provides a suitable matrix for the adsorption of Fe3O4 nanoparticles. They effectively prevent the agglomeration of Fe3O4 nanoparticles by relaxing their strain during the charge–discharge processes. GNS also offers a conduction highway for the electron transportation between the electrode–electrolyte. Simultaneously, the nano-sized oxide particles (average 8 nm) can dramatically cut down the mean diffusion time of the lithium ions and serve as spacers to effectively prevent the restacking of the GNS to increase the rate performance of the cell. The above effects synergistically lead to the improved reversible capacity, cycle performance, and rate capability of the GNS–Fe3O4 nanocomposite electrodes. Our simple, straightforward, efficient approach can be developed to prepare a wide range of functional hybrid materials as anode materials for LIBs.Acknowledgements
This work was supported by the National Natural Science Foundation of China (NCFC Grant 61176007) and CityU Strategic Research Grant, Hong Kong SAR (SRG7002725). One of the authors (C D Wang) is grateful to C. K. Tsang, Department of Physics and Materials Science, City University of Hong Kong, for his kind help in BET characterization and Jun Jin, Laboratory of Living Materials at the State Key Laboratory of Advanced Technology for Materials Synthesis and Processing, Wuhan University of Technology, for performing the TGA measurements during the revision process.References
- J. S. Chen, L. A. Archer and X. W. Lou, J. Mater. Chem., 2011, 21, 9912–9924 RSC.
- Y. G. Li, B. Tan and Y. Y. Wu, Nano Lett., 2008, 8, 265–270 CrossRef CAS.
- J. Chen, L. Xu, W. Li and X. Gou, Adv. Mater., 2005, 17, 582–586 CrossRef CAS.
- Z. M. Cui, L. Y. Jiang, W. G. Song and Y. G. Guo, Chem. Mater., 2009, 21, 1162–1166 CrossRef CAS.
- P. G. Bruce, B. Scrosati and J. M. Tarascon, Angew. Chem., Int. Ed., 2008, 47, 2930–2946 CrossRef CAS.
- M. Armand and J. M. Tarascon, Nature, 2008, 451, 652–657 CrossRef CAS.
- T. Muraliganth, A. V. Murugan and A. Manthiram, Chem. Commun., 2009, 7360–7362 RSC.
- Y. He, L. Huang, J. S. Cai, X. M. Zheng and S. G. Sun, Electrochim. Acta, 2010, 55, 1140–1144 CrossRef CAS.
- Y. Z. Piao, H. S. Kim, Y. E. Sung and T. Hyeon, Chem. Commun., 2010, 46, 118–120 RSC.
- W. M. Zhang, X. L. Wu, J. S. Hu, Y. G. Guo and L. J. Wan, Adv. Funct. Mater., 2008, 18, 3941–3946 CrossRef CAS.
- G. M. Zhou, D. W. Wang, F. Li, L. L. Zhang, N. Li, Z. S. Wu, L. Wen, G. Q. Lu and H. M. Cheng, Chem. Mater., 2010, 22, 5306–5313 CrossRef CAS.
- C. M. Ban, Z. C. Wu, D. T. Gillaspie, L. Chen, Y. F. Yan, J. L. Blackburn and A. C. Dillon, Adv. Mater., 2010, 22, E145–149 CrossRef CAS.
- A. A. Balandin, S. Gjpsj, W. Bao, I. Calizo, D. Teweldebrhan, F. Miao and N. Chun, Nano Lett., 2008, 8, 902–907 CrossRef CAS.
- M. J. Allen, V. C. Tung and R. B. Kaner, Chem. Rev., 2009, 110, 132–145 CrossRef.
- M. D. Stoller, S. Park, Y. Zhu, J. An and R. S. Ruoff, Nano Lett., 2008, 8, 3498–3502 CrossRef CAS.
- E. Yoo, J. Kim, E. Hosono, H. Zhou, T. Kudo and I. Honma, Nano Lett., 2008, 8, 2277–2282 CrossRef CAS.
- D. Chen, L. Tang and J. Li, Chem. Soc. Rev., 2010, 39, 3157–3180 RSC.
- M. Pumera, Chem. Soc. Rev., 2010, 39, 4146–4157 RSC.
- H. Wang, L. F. Cui, Y. Yang, H. S. Casalongue, J. T. Robinson, Y. Liang, Y. Cui and H. Dai, J. Am. Chem. Soc., 2010, 132, 13978–13980 CrossRef CAS.
- L. W. Ji, Z. K. Tan, T. R. Kuykendall, A. Aloni, S. D. Xun, E. Lin, V. Battaglia and Y. G. Zhang, Phys. Chem. Chem. Phys., 2011, 13, 7170–7177 RSC.
- S. K. Behera, Chem. Commun., 2011, 47, 10371–10373 RSC.
- S. J. Ding, D. Y. Luan, F. Y. C. Boey, J. S. Chen and X. W. Lou, Chem. Commun., 2011, 47, 7155–7157 RSC.
- Y. Y. Liang, H. L. Wang, H. S. Casalongue, Z. Chen and H. J. Dai, Nano Res., 2010, 3, 701–705 CrossRef CAS.
- S. J. Ding, J. S. Chen, D. Y. Luan, F. Y. C. Boey, S. Madhavi and X. W. Lou, Chem. Commun., 2011, 47, 5780–5782 RSC.
- J. K. Lee, K. B. Smith, C. M. Hayner and H. H. Kung, Chem. Commun., 2010, 46, 2025–2027 RSC.
- X. Zhao, C. M. Hayner, M. C. Kung and H. H. Kung, Adv. Energy Mater., 2011, 1, 1079–1084 CrossRef CAS.
- H. L. Wang, Y. Yang, Y. Y. Liang, J. T. Robinson, Y. G. Li, A. Jackson, Y. Cui and H. J. Dai, Nano Lett., 2011, 11, 2644–2647 CrossRef CAS.
- L. Zhang, J. Liang, Y. Huang, Y. Ma, Y. Wang and Y. Chen, Carbon, 2009, 47, 3365–3368 CrossRef CAS.
- M. Hirata, T. Gotou, S. Horiuchi, M. Fujiwara and M. Ohba, Carbon, 2004, 42, 2929–2937 CAS.
- W. S. Hummers and R. E. Offeman, J. Am. Chem. Soc., 1958, 80, 1339–1339 CrossRef CAS.
- K. Zhang, L. L. Zhang, X. S. Zhao and J. Wu, Chem. Mater., 2010, 22, 1392–1401 CrossRef CAS.
- S. M. Paek, E. Yoo and I. Honma, Nano Lett., 2009, 9, 72–75 CrossRef CAS.
- J. Su, M. H. Cao, L. Ren and C. W. Hu, J. Phys. Chem. C, 2011, 115, 14469–11477 CAS.
- T. Cassagneau, J. H. Fendler, S. A. Johnson and T. E. Mallouk, Adv. Mater., 2000, 12, 1363–1366 CrossRef CAS.
- Z. S. Wu, W. C. Ren, L. B. Gao, B. L. Liu, C. B. Jiang and H. M. Cheng. Carbon, Carbon, 2009, 47, 493–499 CrossRef CAS.
- X. Y. Li, X. L. Huang, D. P. Liu, X. Wang, S. Y. Song, L. Zhou and H. Zhang, J. Phys. Chem. C, 2011, 115, 21567–21573 CAS.
- S. K. Behera, J. Power Sources, 2011, 196, 8669–8674 CrossRef CAS.
- Z. S. Wu, W. C. Ren, L. Wen, L. B. Gao, J. P. Zhao, Z. P. Chen, G. M. Zhou, F. Li and H. M. Cheng, ACS Nano, 2010, 4, 3187–3194 CrossRef CAS.
- L. Taberna, S. Mitra, P. Poizot, P. Simon and J. M. Tarascon, Nat. Mater., 2006, 5, 567–573 CrossRef.
- Y. Yu, L. Gu, C. L. Wang, A. Dhanabalan, P. A. van Aken and J. Maier, Angew. Chem., Int. Ed., 2009, 48, 6485–6489 CrossRef CAS.
- J. Yang, Y. Takeda, N. Imanishi and O. Yamamoto, J. Electrochem. Soc., 2000, 147, 1671–1676 CrossRef CAS.
- B. Lestrie, S. Bahri, I. Sandu, L. Roue and D. Guyomard, Electrochem. Commun., 2007, 9, 2801–2806 CrossRef.
- P. Poizot, S. Laruelle, S. Grugeon, L. Dupont and J.M. Tarascon, Nature, 2000, 407, 496–499 CrossRef CAS.
- P. Lian, X. Zhu, S. Liang, Z. Li, W. Yang and H. Wang, Electrochim. Acta, 2010, 55, 3909–3914 CrossRef CAS.
- H. Liu, G. Wang, J. Wang and D. Wexler, Electrochem. Commun., 2008, 10, 1879–1882 CrossRef CAS.
- Y. He, L. Huang, J. S. Cai, X. M. Zheng and S. G. Sun, Electrochim. Acta, 2010, 55, 1140–1144 CrossRef CAS.
- L. Wang, Y. Yu, P. C. Chen, D.W. Zhang and C.H. Chen, J. Power Sources, 2008, 183, 717–723 CrossRef CAS.
- G. Wang, T. Liu, X. Xie, Z. Ren, J. Bai and H. Wang, Mater. Chem. Phys., 2011, 128, 336–340 CrossRef CAS.
- B. Li, H. Cao, J. Shao, M. Qu and J. H. Warner, J. Mater. Chem., 2011, 21, 5069–5075 RSC.
- D. Chen, G. Ji, Y. Ma, J. Y. Lee and J. Lu, ACS Appl. Mater. Interfaces, 2011, 3, 3078–3083 CAS.
- M. Zhang, D. Lei, X. Yin, L. Chen, Q. Li, Y. Wang and T. Wang, J. Mater. Chem., 2010, 20, 5538–5543 RSC.
- J. Z. Wang, C. Zhong, D. Wexler, N. H. Idris, Z. X. Wang, L. Q. Chen and H. K. Liu, Chem.–Eur. J., 2011, 17, 661–667 CrossRef CAS.
- Q. M. Zhang, Z. C. Shi, Y. F. Deng, J. Zheng, G. C. Liu and G. H. Chen, J. Power Sources, 2012, 197, 305–309 CrossRef CAS.
- Y. F. Deng, Q. M. Zhang, S. D. Tang, L. T. Zhang, S. N. Deng, Z. C. Shi and G. H. Chen, Chem. Commun., 2011, 47, 6828–6830 RSC.
- Y. Wang, F. B. Su, J. Y. Lee and X. S. Zhao, Chem. Mater., 2006, 18, 1347–1353 CrossRef CAS.
- J. S. Zhou, H. H. Song, X. H. Chen, L. J. Zhi, S. B. Yang, J. P. Huo and W. T. Yang, Chem. Mater., 2009, 21, 2935–2940 CrossRef CAS.
- S. L. Jin, H. G. Deng, D. H. Long, X. J. Liu, L. Zhan, X. Y. Liang, W. M. Qiao and L. C. Ling, J. Power Sources, 2011, 196, 3887–3893 CrossRef CAS.
- P. C. Wang, H. P. Ding, T. Bark and C. H. Chen, Electrochim. Acta, 2007, 52, 6650–6655 CrossRef CAS.
- G. Ji, Y. Ma and J. Y. Lee, J. Mater. Chem., 2011, 21, 9819–9824 RSC.
- Y. Li and J. J. Li, J. Phys. Chem. C, 2008, 112, 14216–14219 CAS.
Footnote |
| † Electronic Supplementary Information (ESI) available. See DOI: 10.1039/c2ra22114d |
| This journal is © The Royal Society of Chemistry 2012 |
