DOI:
10.1039/C2RA22086E
(Paper)
RSC Adv., 2012,
2, 12216-12223
Silica nanofibrous membranes with robust flexibility and thermal stability for high-efficiency fine particulate filtration†
Received
9th September 2012
, Accepted 4th October 2012
First published on 8th October 2012
Abstract
Novel silica nanofibrous (SNF) membranes with remarkable flexibility and thermal stability were prepared as high-performance filtration media by a facile combination of electrospinning and sol–gel methods. The flexibility and tensile strength of the SNF membranes can be finely controlled by regulating the calcination temperature and precursor fiber composition. A plausible correlation between the flexibility and crystalline phase of silica was proposed, and the tensile fracture process of the SNF membranes was discussed. Additionally, the mesoporous effect of the SNF membranes was also investigated from the nitrogen physisorption isotherms. Furthermore, the SNF membranes with excellent flexibility (0.0156 gf cm), tensile strength (5.5 MPa), and thermal stability (up to 1000 °C) showed a high filtration efficiency (99.99%) and a low pressure drop (163 Pa) for 300–500 nm sodium chloride aerosols, suggesting a promising candidate for high-temperature filtration applications. This also provides new insight into the design and development of flexible inorganic nanomaterials for various applications.
Introduction
Air pollution is a major health hazard that is responsible for millions of annual excess deaths worldwide. The suspended dusts from metallurgy, steel, electric power, incineration, and cement industries are generally considered to contribute to air pollution. In particular, particulate matter with an aerodynamic diameter of less than 2.5 μm is a robust indicator of mortality and other adverse health effects.1–3 Increasingly stringent regulations for dust emissions from high temperature industrial processes have accelerated the development of filtration media fabricated from high performance fibers. Conventional filtration media such as glass fibers exhibit low heat-resistance (up to 350 °C) and depth loading characteristics in industrial dust environments which would become clogged up over time, and hence reduce the airflow through the media.4 It is well-documented that nanofibrous membranes cause the “slip effect”, which reduces the resistance against the air flow,5 leading to a smaller pressure drop across the media.6,7 Benefiting from higher permeability and a smaller pore size, the nanofibrous membranes could capture the dust particles on the surface, which can be subsequently removed by back flushing or other mechanical means. This implies that nanofiber based composite filters have a higher shelf life when compared with conventional filtration media, and are well suited for air filtration applications.8–10
Electrospinning has gained increasing appeal as a versatile technique that creates sub-micron to nanoscale fibers through an electrically charged jet of polymer solution or melt.11–16 Electrospun fibrous membranes possess several attractive features that make them very attractive in separation technology, such as a large surface-to-volume ratio, high porosity, an interconnected open pore structure, and high permeability.17,18 Based on these characteristics, many investigators have evaluated the air filtration properties of various kinds of membranes, such as polyacrylonitrile, polyamide-66 nano-fiber/nets, polyamide-6, and polyethylene oxide.5,19–21 To date, most studies have focused on polymer membranes, however, the low thermal stability of polymer nanofibers prevents them from being used as high-temperature filtration media. Electrospun inorganic membranes are of particular interest in many separation processes because they can be used under severe conditions due to their chemical and thermal stability.11,22–24 Over the years, considerable effort has been devoted to fabricating inorganic fibers, including SiO2, Al2O3, TiO2, and ZnO, but the brittleness of current inorganic membranes significantly limits their practical applications.25–31 Although our previous study had revealed the formation of silica nanofibrous (SNF) membranes with good flexiblility,32,33 the mechanism of fiber flexibility is still a challenging problem and of great interest. To the best of our knowledge, the development of flexible inorganic nanofibrous membranes in the air filtration domain has not been reported.
In this contribution, we extend our earlier work by developing a new class of flexible and thermally stable SNF membranes for high-performance filtration media by the combination of electrospinning and sol–gel methods (Scheme 1). The morphology, flexibility, and tensile strength of the SNF membranes were investigated by tuning the precursor fiber composition and calcination temperature. Moreover, the filtration performance of the SNF membranes with various fiber diameters and a basis weight for 300–500 nm sodium chloride aerosols at the face velocity of 5.3 and 14.1 cm s−1 was also studied.
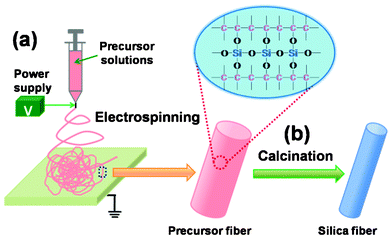 |
| | Scheme 1 Schematic illustration of the fabrication of SNF membranes by a combination of (a) electrospinning and (b) a calcination process. | |
Experimental
Materials
The starting materials included poly (vinyl alcohol) (PVA, Mw = 88 000, Aladdin Chemical Co., China), tetraethyl orthosilicate (TEOS, Lingfeng Chemical Co., Ltd., China), phosphoric acid (H3PO4, Shanghai Chemical Reagents Co., Ltd., China), and pure water with a resistance of 18.2 MΩ. All chemicals were of analytical grade and were used as received without further purification.
Preparation of precursor solutions
PVA solutions were prepared at concentrations of 8, 10, 12, and 14 wt% by dissolving in pure water at 80 °C with vigorous stirring. Silica gel with the molar composition TEOS![[thin space (1/6-em)]](https://www.rsc.org/images/entities/char_2009.gif) :
:![[thin space (1/6-em)]](https://www.rsc.org/images/entities/char_2009.gif) H3PO4
H3PO4![[thin space (1/6-em)]](https://www.rsc.org/images/entities/char_2009.gif) :
:![[thin space (1/6-em)]](https://www.rsc.org/images/entities/char_2009.gif) H2O = 1
H2O = 1![[thin space (1/6-em)]](https://www.rsc.org/images/entities/char_2009.gif) :
:![[thin space (1/6-em)]](https://www.rsc.org/images/entities/char_2009.gif) 0.01
0.01![[thin space (1/6-em)]](https://www.rsc.org/images/entities/char_2009.gif) :
:![[thin space (1/6-em)]](https://www.rsc.org/images/entities/char_2009.gif) 11 was prepared by hydrolysis and polycondensation by the dropwise addition of H3PO4 into TEOS with stirring at room temperature for 6 h. Then 10 g PVA solutions at concentrations of 8, 10, 12, and 14 wt% were dropped slowly into 10 g silica gel and stirred for another 4 h, respectively. Thus, viscous precursor solutions containing various PVA concentrations, used as the electrospinning solutions, were obtained.
11 was prepared by hydrolysis and polycondensation by the dropwise addition of H3PO4 into TEOS with stirring at room temperature for 6 h. Then 10 g PVA solutions at concentrations of 8, 10, 12, and 14 wt% were dropped slowly into 10 g silica gel and stirred for another 4 h, respectively. Thus, viscous precursor solutions containing various PVA concentrations, used as the electrospinning solutions, were obtained.
Electrospinning
The setup for electrospinning was purchased from Shanghai Oriental Flying Nanotechnology Co., Ltd., China (DXES-01). All the fibrous membranes were spun at 17 kV keeping a constant tip-to-collector distance of 22 cm. The positive electrode of the high-voltage power supply was attached to the metal needle tip while the grounded stainless drum was used as the collector wrapped with aluminum foil and rotated at 30 rpm. The feeding rate of the precursor solutions by the syringe pump was 1 mL h−1 throughout. The fabrication chamber was kept at constant temperature (25 °C) and relative humidity (45%). The hybrid nanofibrous (HNF) membranes with different precursor fiber compositions fabricated from 8, 10, 12, and 14 wt% PVA solutions were denoted as HNF1, HNF2, HNF3, and HNF4, respectively.
Fabrication of SNF membranes
The HNF2 fibrous membranes were calcined at 600, 800, 1000, and 1200 °C with a temperature increase rate of 5 °C min−1 in air, respectively, then cooled down to room temperature. Additionally, the various HNF membranes were heated at a heating rate of 5 °C min−1 to 800 °C in air. The SNF membranes resulting from HNF1, HNF2, HNF3, and HNF4 were referred to as SNF1, SNF2, SNF3, and SNF4, respectively.
Characterization
Thermogravimetric analysis (TGA) of hybrid and inorganic fibrous membranes was performed on a thermogravimetric analyzer (TG209F1, NETZSCH, Germany) from 100 to 900 °C with a heating rate of 10 °C min−1 in air. The morphology of the membranes was observed by field emission scanning electron microscopy (FE-SEM) (S-4800, Hitachi Ltd., Japan). The fiber diameter and the distribution of each membrane were measured by an image analyzer (Adobe Photoshop CS2). The crystalline phase was characterized by X-ray diffraction (XRD) (D/Max-2550 PC Rigaku Co., Japan). The bending rigidity (B) of the membranes was recorded using a KES multi-purpose bending tester (KES-FB2S, KATO TECH Co., Japan). The mechanical properties of the membranes were tested on a tensile tester (XQ-1C, Shanghai New Fiber Instrument Co., Ltd., China) with a crosshead speed of 10 mm min−1. Ten specimens from each membrane were tested for tensile behavior. The viscosity, conductivity, and surface tension of the precursor solutions were measured using a viscometer (CNDJ-79, Shanghai Changji Geological Instrument Co., Ltd., China), a conductivity meter (FE30, Mettler-Toledo Group, Switzerland), and a surface tension meter (QBZY-1, Shanghai Fangrui Instrument Co., Ltd., China), respectively. N2 adsorption–desorption isotherms were examined at 77 K by an ASAP 2020 physisorption analyzer (Micromeritics Co., USA).
An automated filter tester was used to measure the filtration efficiency and pressure drop, which was provided by Zhaohui Filter Technology Co. Ltd., China. The tester could deliver charge neutralized monodisperse solid NaCl aerosols that had a mass median diameter of 300–500 nm. The neutralized NaCl aerosols were fed into a filter holder and down through the filter with 10 cm × 10 cm effective area. The filter resistance was measured with the combination of a flow meter and two electronic pressure transducers that detected the pressure drop through the filtration media under testing. All NaCl aerosol tests were conducted at room temperature with a continuous airflow fixed at 5.3 and 14.1 cm s−1, and one of the filtration test times is 20 s.
Results and discussion
Heat-resistant performance of SNF membranes
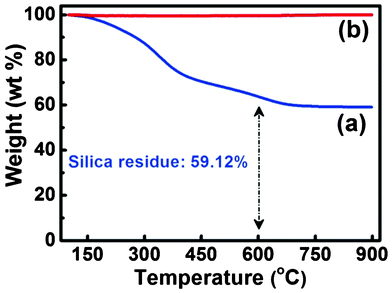
To investigate the thermal stability of the SNF membranes, the hybrid and inorganic membranes were examined by a thermogravimetric analyzer from 100 to 900 °C (Fig. 1). As seen in Fig. 1(a), the weight of the HNF2 membranes decreases substantially in the low temperature region. Weight loss around 100–250 °C could be attributed to desorption of the moisture and a self-condensation reaction of the silanol groups in the curve of the HNF2 membranes.34 Degradation of PVA by dehydration on the polymer side chain results in weight loss at 250–350 °C while the weight loss from 400 to 600 °C occurs as the C–C bonds of the polymer are cleaved.35,36 A total weight loss of 40.88% is observed in the range 100–600 °C. A ceramic yield of 59.12% remained from 600 to 900 °C with the chemical composition SiO2, which is close to the theoretical content of silica in HNF2 membranes (59.02%). Additionally, no weight loss of the inorganic SNF membranes from 100 to 900 °C is observed in Fig. 1(b), which confirms the remarkable thermal stability of the membranes.
The representative FE-SEM images of SNF membranes at various calcination temperatures are shown in Fig. 2, which reveal that the morphology greatly changes with increasing temperature. As the temperature increased from 600 to 1000 °C (Fig. 2(a) to (c)), the membranes still maintained flexibility and a randomly oriented fiber morphology with a fiber diameter of 200–300 nm. The membranes at a calcination temperature of 800 °C exhibited the thinnest diameter and uniform morphology, which make them optimal candidates for capturing nano-sized particles in the filtration application. When the calcination temperature of HNF2 membranes was 1200 °C, the SNF membranes became extremely fragile and broke easily. Additionally, it can be clearly seen that the membranes exhibited a fracture fiber morphology and the average fiber diameter was 240 nm (Fig. 2(d)). The brittleness of the SNF membranes could be caused by the fracture of a single fiber in the membranes. Moreover, the melting phenomenon could be more clearly presented on the contact surface between two silica fibers, which was marked with the red ellipse (inset of Fig. 2(d)).
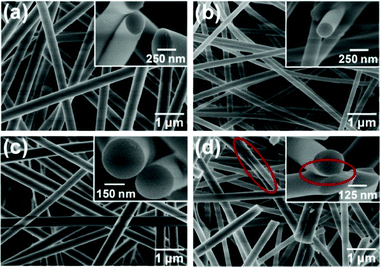 |
| | Fig. 2 FE-SEM images of various SNF membranes fabricated from HNF2 membranes with varied calcination temperatures: (a) 600, (b) 800, (c) 1000, and (d) 1200 °C, respectively. The insets are the corresponding cross-section images. | |
To clarify the influence of the calcination temperature on the crystalline phase, XRD patterns from 10° to 50° of various SNF membranes are displayed in Fig. 3. The weak and broad diffraction peaks around 14.1° and 20.9° indicate that a few grains exist in the amorphous phase of silica, which are attributed to the quartz (JCPDS No. 82-1553) and tridymite (JCPDS No. 75-0638) phases of silica, respectively.37 With increasing the calcination temperature of the HNF2 membranes from 600 to 1200 °C, the broad hump at 14.1° diminishes and shifts to a higher 2θ value (20.9°), implying the phase transition of the grain from quartz to tridymite in the amorphous phase.38 At 600 °C, the grain size of the peak at 14.1° is 2.29 nm, which is estimated using the Scherrer formula from XRD peak broadening.39 With increasing the temperature to 800 °C, the relative intensity of the peak at 14.1° weakens and the grain size is 2.23 nm, meanwhile, a new peak is presented at 20.9°. The phase transition of the grain from the quartz to the tridymite phase starts at about 1000 °C, and is completed at about 1200 °C. The grain size of the peak at 20.9° from 1000 to 1200 °C is 1.74 and 1.77 nm, respectively. It is worth noting that the quartz phase of the grain in the amorphous silica phase fabricated from the calcination temperatures from 600 to 1000 °C was retained.
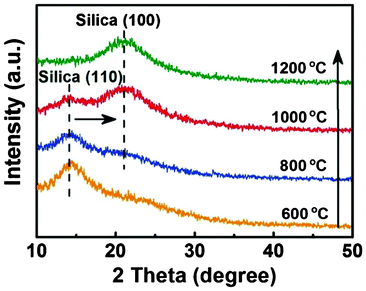 |
| | Fig. 3 XRD patterns of various SNF membranes fabricated from HNF2 membranes at varied calcination temperatures: 600, 800, 1000, and 1200 °C, respectively. | |
Effect of calcination temperature on the mechanical properties of SNF membranes
The mechanical properties of the SNF membranes, including flexibility and tensile strength, were studied by KES bending and tensile testers, respectively. The flexibility of the membranes can be characterized by a bending tester, and a lower B usually means better flexibility.40Fig. 4(a) shows the results of the SNF membranes fabricated from the HNF2 membranes with different calcination temperatures: 600, 800, and 1000 °C, respectively. According to the manual of the device, the B of Grosberg's model is computed. The slopes are computed respectively between κ = 0.5 cm−1 and κ = 1.5 cm−1 for s1 and between κ = −0.5 cm−1 and κ = −1.5 cm−1 for s2:| |  | (1) |
| |  | (2) |
where κ is the curvature of membranes; M is the bending hysteresis of membranes; s1 is the bending rigidity of membranes with rotating a half circle; and s2 is the bending rigidity of membranes with rotating the other half circle.
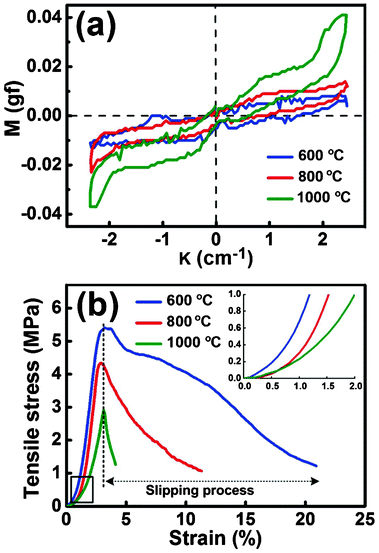 |
| | Fig. 4 (a) KES-FB2S tests and (b) tensile stress–strain curves of various SNF membranes fabricated from HNF2 membranes at varied calcination temperatures: 600, 800, and 1000 °C, respectively. Inset: the tensile stress–strain curves over the low strain range (strain < 2%) of various SNF membranes. | |
Combining eqn (1)–(3), we can obtain the B values of the SNF membranes. The lower calcination temperature for the SNF membranes resulted in a smaller B value and better flexibility, with B values of 0.0015, 0.0037, and 0.0076 gf cm for SNF membranes from 600, 800, and 1000 °C, respectively. Compared with the high calcination temperatures (800 and 1000 °C), the membranes from 600 °C possessed an excellent flexibility, which could be attributed to the larger grain size (2.29 nm) of the quartz phase than the membranes from 800 °C.41 On further increasing the temperature to 1000 °C, the diameter and volume of the silica fiber increased greatly (Fig. 2(c)), which could be attributed to the phase transition from the quartz to the tridymite phase that started at about 1000 °C (Fig. 3) and caused the biggest B value among the three samples. From these results, we could conclude that the grain size in amorphous silica played important roles in the flexibility of the SNF membranes.
The tensile stress–strain curves for various SNF membranes are presented in Fig. 4(b). One can clearly see an interesting phenomenon from Fig. 4(b) and Table S1† that the highest tensile strength of SNF membranes corresponds to the lowest calcination temperature. The SNF membranes fabricated at 600 °C exhibited a relatively high tensile strength (5.4 MPa), an elongation at the break value (21.9%), and a tensile modulus (152 MPa), compared with the other membranes from the high calcination temperatures (800 and 1000 °C). As can be seen from Fig. 4(b), all the samples showed a nonlinear elastic behavior at first under a stress load, and then the tensile stress–strain curves exhibited a typical linear increase until fracture due to the significant “pull out” and the slip of individual silica fibers along the stress direction, which is shown in Fig. 5. The diameter of the silica fibers remained unchanged before and after the tension test, which are shown in the digital photographs and FE-SEM images of the SNF membranes (calcination temperature of 800 °C) before tension (Fig. 5(a) and (c)) and after failure (Fig. 5(b) and (d)), respectively. Meanwhile, the proposed mechanism of the tensile fracture process for the SNF membranes is shown in Fig. 5(e).
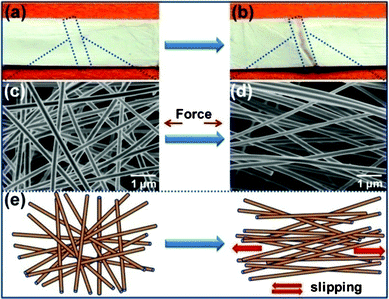 |
| | Fig. 5 Photographs show (a) before tension and (b) after failure of the SNF membranes fabricated from HNF2 membranes with a calcination temperature of 800 °C, respectively. (c) and (d) FE-SEM images show the SNF membranes before and after failure, respectively. (e) Proposed mechanism of the tensile fracture process for SNF4 membranes. | |
Morphology and mechanical properties of SNF filtration membranes
Fig. 6 presents typical FE-SEM images of the SNF membranes fabricated from precursor fibers with various PVA contents (35.72, 40.97, 45.45, and 49.30 wt%) combined with subsequent heating treatment at 800 °C. The average fiber diameters of SNF1, SNF2, SNF3, and SNF4 were 160, 205, 303, and 448 nm (for the fiber diameter distribution see Fig. S1†), respectively, which clearly shows that the fiber diameter increased regularly with increasing the PVA content in the precursor fibers. A similar result has also been reported in previous studies.32,33 Compared with other SNF membranes, the sample SNF1 membranes were composed of the thinnest fibers with minority beads along the fiber axis (Fig. 6(a)), which could be attributed to the utilization of the precursor solutions with low viscosity (60 cps) (ESI, Table S2†) during the electrospinning process.42 In comparison with SNF1 membranes, SNF2 membranes exhibited a smooth and larger fiber diameter (Fig. 6(b)), which could be attributed to the higher viscosity of the precursor solutions (130 cps) and bigger PVA content in the precursor fibers (40.97 wt%). On further increasing the PVA content to 45.45 and 49.30 wt%, the fiber diameters increased obviously (303 and 448 nm) (Fig. 6(c) and (d)). These results suggest that the precursor fiber composition plays an important role in determining the morphology of SNF membranes.
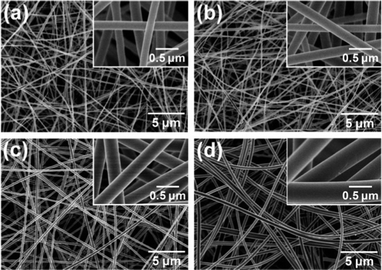 |
| | Fig. 6 FE-SEM images of (a) SNF1, (b) SNF2, (c) SNF3, and (d) SNF4 membranes. | |
As discussed previously, the SNF membranes exhibited a good flexibility and high tensile strength fabricated at various calcination temperatures, and the grain size in amorphous silica played an important role in the flexibility of the SNF membranes. To examine the effect of the precursor fiber composition on the flexibility, the KES bending test was also operated on the SNF membranes. The B values of the SNF1, SNF2, SNF3, and SNF4 membranes were 0.0020, 0.0037, 0.0156, and 0.0169 gf cm (ESI, Fig. S2(a)†), respectively. Increasing the PVA content in the precursor fibers enhanced the B values of the membranes as well as decreased their flexibility, which could be caused by the diameter of the obtained silica fibers increasing from 160 to 448 nm. Fig. S2(b)† shows the typical tensile stress–strain curves of the SNF membranes with various fiber diameters, and the detailed mechanical properties data are listed in Table S3.† It can be clearly seen that the tensile strength of membranes depends not only on the calcination temperature (Fig. 4(c)) but also on the fiber diameter. The SNF4 membranes with the largest fiber diameter (448 nm) exhibited the highest tensile strength (7.2 MPa), elongation at the break value (24.5%), and a tensile modulus (146 MPa). The results indicate that the SNF membranes have a good mechanical behavior for filtration media.
Evaluation of the filtration performance of SNF membranes
The filtration performance of charge neutralized NaCl aerosols in the 300–500 nm size range for SNF membranes are shown in Fig. 7. Fig. 7(a) compares the filtration efficiency and pressure drop of SNF1, SNF2, SNF3, and SNF4 membranes at the face velocity of 5.3 cm s−1. Meanwhile, the SNF3 membranes show the best filtration efficiency compared to SNF1, SNF2, and SNF4 membranes with a similar basis weight of 2.60 g m−2. The filtration efficiency of SNF3 membranes is over 99.70% at the face velocity of 5.3 cm s−1, even if the SNF3 membranes have a lower relative pressure drop (65 Pa) with a fiber diameter of 303 nm. On the basis of the efficiencies (η) of the filters and the pressure drops across the filters (ΔP), the quality factor (QF) is defined as:| |  | (4) |
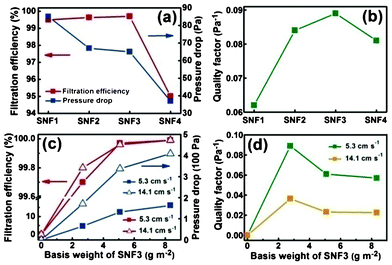 |
| | Fig. 7 Filtration performance of various SNF membranes. (a) Filtration efficiency and pressure drop and (b) QF values of SNF1, SNF2, SNF3, and SNF4 membranes at the face velocity of 5.3 cm s−1. (c) Filtration efficiency and pressure drop and (d) QF values variation versus basis weight of SNF3 membranes under the face velocity of 5.3 and 14.1 cm s−1. | |
QF represents the ratio between the filtration efficiency measure and the pressure drop. A filter with a greater filtration efficiency and/or a lower pressure drop than another will have higher QF. Thus, a filter of better performance should have a higher efficiency and a larger QF. Fig. 7(b) shows the comparison of the QF values of SNF1, SNF2, SNF3, and SNF4 membranes are 0.062, 0.084, 0.089, and 0.081 Pa−1, respectively. The QF value indicated that the best filtration media was the SNF3 membranes, whose efficiency was the highest in the entire measured size-range.
Fig. 7(c) shows the filtration efficiency and pressure drop of the SNF3 membranes with different basis weights under a face velocity of 5.3 and 14.1 cm s−1, respectively. The membranes of different basis weights (2.67, 5.08, and 8.33 g m−2) were fabricated by different spinning times (4, 8, and 12 h). The filtration efficiency and pressure drop of membranes with 8.33 g m−2 are over 99.99% and 163 Pa at 5.3 cm s−1, respectively. When the face velocity increased from 5.3 to 14.1 cm s−1, the pressure drop rose rapidly with the increased basis weight in Fig. 7(c), however, the filtration efficiency remained unchanged. The pressure drop was quite linearly dependent on the basis weight, which can also be seen in Fig. 7(c). A linearity dependency was also obtained by Schreuder and Gibson with the increased basis weight and this can be expected.43 The QF as a function of the SNF3 membranes’ basis weight under face velocities of 5.3 and 14.1 cm s−1 are shown in Fig. 7(d). From Darcy's Law, the pressure drop across the filter increases linearly with face velocity.42 As seen in Fig. 7(c), the filtration efficiency is generally unchanged with the increase in face velocity. Hence, QF as an indicator of filtration performance should become lower at high face velocity, which is depicted in Fig. 7(d). The QF of the SNF3 membrane filter decreases with basis weight, and most rapidly at initial values of the basis weight. To have a better filtration performance, it is recommended to adopt the lowest possible face velocity when the SNF membrane filter is used. More importantly, it is more cost-effective to use a lower basis weight of the membranes due to the relatively high QF, which is of great importance for practical applications. Evidently, the as-prepared SNF membranes could be applied as a promising high performance filtration media for dust filtration from high temperature industrial processes.
The filtration process of SNF3 membranes is shown in Fig. 8. It is clearly shown that the top (Fig. 8(a)) and bottom (Fig. 8(b)) surfaces of the membranes have few particles after filtration, which could be attributed to the larger pore size of the membranes than the NaCl aerosol particles (the yellow lines in Fig. 8(a)). The proposed filtration process was discussed from the FE-SEM images of membranes, and it was concluded that the NaCl aerosols particles were depth loading in the membranes, while almost all NaCl aerosol particles were trapped in the top layer of membranes (Fig. 8(c)) without penetrating into the deeper layers of the membranes (Fig. 8(e)). In order to illustrate the filtration process, the simple three-dimensional (3D) structure model from the FE-SEM images (Fig. 8) of the SNF filtration membranes has been proposed in Scheme 2. The filtration efficiency has been improved with ultrafine fiber diameters and the pressure drop has been decreased with the air channels (the red channels in Scheme 2 (b)) in the filtration membranes. Full 3D particle filtration modelling (Scheme 2 (a)) using such a 3D structure model representing the real filter structure has been utilized considering the gravity segregation, interception, electrostatic interaction, and inertial impaction between the NaCl aerosols and the fiber surface (Scheme 2 (c)).43
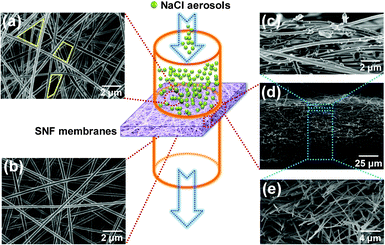 |
| | Fig. 8 FE-SEM images of SNF3 membranes after filtration: (a) top surface; (b) bottom surface; (c), (d), and (e) cross-section with different magnifications, respectively. | |
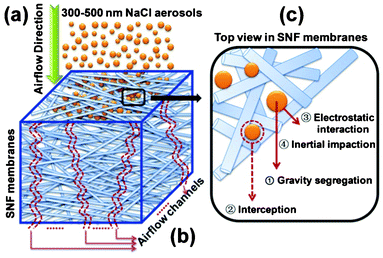 |
| | Scheme 2 (a) The filtration process of SNF membranes for 300–500 nm NaCl aerosols, (b) the airflow channels of SNF membranes, and (c) the interaction between silica nanofibers and NaCl aerosols. | |
To further study the filtration mechanism, N2 adsorption–desorption isotherms were measured at 77 K to examine the pore width of the SNF filtration membranes. The relevant curves displayed in Fig. 9(a) exhibited type IV with a H3 hysteresis loop, revealing characteristics of mesopores within the as-prepared SNF membranes.44,45 The narrow hysteresis loop during the overall pressure change indicated that the mesopores are open, thus, there is no significant interruption between the capillary evaporation and condensation for N2.46 The inset in Fig. 9(a) displays the Brunauer–Emmett–Teller (BET) surface area of the SNF membranes, revealing a remarkable increase of the surface area due to the decreasing diameter of silica nanofibers (Fig. 6). Fig. 9(b) displays the pore size distributions of the SNF filtration membranes, which presents that the pores in the membranes are mainly in the range 25–50 nm, which agrees very well with the nitrogen physisorption data. The mesoporous SNF membranes caused high performance filtration for fine particulates as a new observation, which was defined as the “mesoporous effect”. In this case, the filtration performance of nanofibrous membranes is dependent on both the fiber diameter and the nanofibrous membranes arising from the mesoporous effect. The results demonstrated the major contributing role of the mesoporous effect of SNF membranes on deciding the high performance filtration for fine particulate, which is consistent with the FE-SEM analysis (Fig. 8).
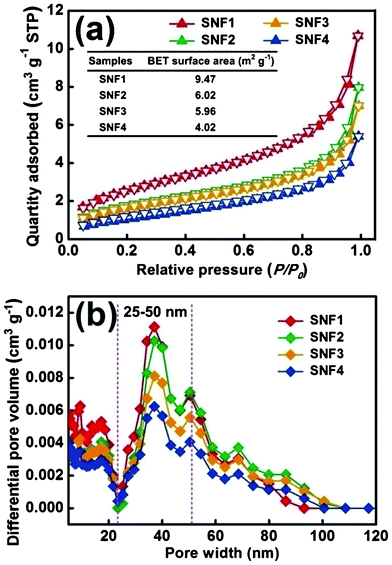 |
| | Fig. 9 (a) Nitrogen physisorption isotherms of SNF1, SNF2, SNF3, and SNF4 membranes. (b) The differential pore volume as a function of pore width. | |
Conclusions
In summary, robust flexible SNF membranes for high-performance filtration media have been successfully developed by electrospinning and sol–gel techniques, which showed excellent thermal stability up to 1000 °C. The morphology and crystalline phase of SNF membranes played an important role in the mechanical properties, including flexibility and tensile strength. Additionally, the “pull out” and sliding phenomena among the silica fibers were investigated in the fracture process of the SNF membranes. Meanwhile, the SNF3 membranes exhibited good flexibility (0.0156 gf cm), relatively high tensile strength (5.5 MPa), strain at break (23.5%), and tensile modulus (114 MPa), which also showed excellent filtration performances towards NaCl aerosols in terms of a high filtration efficiency (99.99%) and relatively low pressure drop (163 Pa). More significantly, SNF membranes with a robust mesoporous effect possessed great potential for applications as high-temperature filtration media to intercept fine particles with sizes in the nanometer range. This work opens up the avenue of exploring the use of flexible inorganic nanofibrous membranes for more practical applications.
Acknowledgements
This work is supported by the National Natural Science Foundation of China (No. U1232116 and 51173022), the Innovation Program of Shanghai Municipal Education Commission (11ZZ59), the “Dawn” Program of Shanghai Education Commission (10SG32), the Huo Yingdong Foundation (131070), the Scientific Research Foundation for Returned Overseas Chinese Scholars, Ministry of Education of China, the Program for New Century Talents of the University in China, and the Fundamental Research Funds for the Central Universities.
References
- G. Oberdörster, J. Ferin, R. Gelein, S. Soderholm and J. Finkelstein, Environ. Health Perspect., 1992, 97, 193–199 Search PubMed.
- S. Yim and S. Barrett, Environ. Sci. Technol., 2012, 46, 4291–4296 CrossRef CAS.
- P. Nelson, Energy Fuels, 2007, 21, 477–484 CrossRef CAS.
- V. Thavasi, G. Singh and S. Ramakrishna, Energy Environ. Sci., 2008, 1, 205–221 CAS.
- S. Hosseini and H. Tafreshi, Powder Technol., 2010, 201, 153–160 CrossRef CAS.
- J. Deitzel, J. Kleinmeyer, D. Harris and N. Beck, Polymer, 2001, 42, 261–272 CrossRef CAS.
- R. Gopal, S. Kaur, Z. Ma and C. Chan, J. Membr. Sci., 2006, 281, 581–586 CrossRef CAS.
- T. Subbiah, G. Bhat, R. Tock, S. Parameswaran and S. Ramkumar, J. Appl. Polym. Sci., 2005, 96, 557–569 CrossRef CAS.
- R. Barhate and S. Ramakrishna, J. Membr. Sci., 2007, 296, 1–8 CrossRef CAS.
- B. Ding, M. Wang, X. Wang, J. Yu and G. Sun, Mater. Today, 2010, 13, 16–27 CrossRef CAS.
- D. Li and Y. Xia, Adv. Mater., 2004, 16, 1151–1170 CrossRef CAS.
- J. Du, P. Che, U. Aich, E. Tan, H. Kim, S. Sampathkumar and K. Yarema, Bioorg. Med. Chem. Lett., 2011, 21, 4980–4984 CrossRef CAS.
- J. Lin, X. Wang, B. Ding, J. Yu, G. Sun and M. Wang, Crit. Rev. Solid State Mater. Sci., 2012, 37, 94–114 CrossRef CAS.
- B. Ding, E. Kimura, T. Sato, S. Fujita and S. Shiratori, Polymer, 2004, 45, 1895–1902 CrossRef CAS.
- C. Huang, S. Chen, D. Reneker, C. Lai and H. Hou, Adv. Mater., 2006, 18, 668–671 CrossRef CAS.
- X. Wang, B. Ding, J. Yu and M. Wang, Nano Today, 2011, 6, 510–530 CrossRef CAS.
- A. Greiner and J. H. Wendorff, Angew. Chem., Int. Ed., 2007, 46, 5670–5703 CrossRef CAS.
- C. Wessel, R. Ostermann, R. Dersch and B. Smarsly, J. Phys. Chem. C, 2011, 115, 362–372 CAS.
- F. Ma, Y. Ou, Y. Yang, Y. Liu, S. Xie, J. Li, G. Cao, R. Proksch and J. Li, J. Phys. Chem. C, 2010, 114, 22038–22043 CAS.
- N. Wang, X. Wang, B. Ding, J. Yu and G. Sun, J. Mater. Chem., 2012, 22, 1445–1452 RSC.
- N. Barakat, M. Khil, F. Sheikh and H. Kim, J. Phys. Chem. C, 2008, 112, 12225–12233 CAS.
- D. Li, Y. Wang and Y. Xia, Nano Lett., 2003, 3, 1167–1171 CrossRef CAS.
- Y. Li, W. Xiao, K. Xiao, L. Berti, J. Luo, H. Tseng, G. Fung and K. Lam, Angew. Chem. Int. Ed., 2012, 51, 2864–2869 CAS.
- X. Mao, B. Ding, M. Wang and Y. Yin, Carbohydr. Polym., 2010, 80, 839–844 CrossRef CAS.
- C. Shao, H. Kim, J. Gong, B. Ding, D. Lee and S. Park, Mater. Lett., 2003, 57, 1579–1584 CrossRef CAS.
- P. Zhu, Y. Wu, M. Reddy, A. Nair, B. Chowdari and S. Ramakrishna, RSC Adv., 2012, 2, 531–537 RSC.
- H. Dai, J. Gong, H. Kim and D. Lee, Nanotechnology, 2002, 13, 674–677 CrossRef CAS.
- V. Ganesh, A. Nair, H. Raut, T. Walsh and S. Ramakrishna, RSC Adv., 2012, 2, 2067–2072 RSC.
- H. Kokubo, B. Ding, T. Naka, H. Tsuchihira and S. Shiratori, Nanotechnology, 2007, 18, 165604 CrossRef.
- B. Ding, H. Kim, C. Kim, M. Khil and S. Park, Nanotechnology, 2003, 14, 532–537 CrossRef CAS.
- B. Ding, J. Kim, E. Kimura and S. Shiratori, Nanotechnology, 2004, 15, 913–917 CrossRef CAS.
- M. Guo, B. Ding, X. Li, X. Wang, J. Yu and M. Wang, J. Phys. Chem. C, 2010, 114, 916–921 CAS.
- F. Zhao, X. Wang, B. Ding, J. Lin, J. Hu, Y. Si, J. Yu and G. Sun, RSC Adv., 2011, 1, 1482–1488 RSC.
- W. Huang, S. Cui, K. Liang, Z. Yuan and S. Gu, J. Phys. Chem. Solids, 2002, 63, 645–650 CrossRef CAS.
- K. Nakane, T. Yamashita, K. Iwakura and F. Suzuki, J. Appl. Polym. Sci., 1999, 74, 133–138 CrossRef CAS.
- F. Suzuki, K. Nakane and J. Piao, J. Mater. Sci., 1996, 31, 1335–1340 CrossRef CAS.
- R. Hemley, A. Jephcoat, H. Mao, L. Ming and M. Manghnani, Nature, 1988, 334, 52–54 CrossRef CAS.
- D. Lakshtanov, S. Sinogeikin and J. Bass, Phys. Chem. Miner., 2007, 34, 11–22 CrossRef CAS.
- P. Yang, D. Zhao, D. Margolese, B. Chmelka and G. Stucky, Nature, 1998, 396, 152–155 CrossRef CAS.
- E. De Bilbao, D. Soulat, G. Hivet and A. Gasser, Exp. Mech., 2010, 50, 333–351 CrossRef.
- R. Tangirala, J. Baker, A. Alivisatos and D. Milliron, Angew. Chem., 2010, 122, 2940–2944 CrossRef.
- K. Onozuka, B. Ding, Y. Tsuge, T. Naka, M. Yamazaki, S. Sugi, S. Ohno, M. Yoshikawa and S. Shiratori, Nanotechnology, 2006, 17, 1026–1031 CrossRef CAS.
- G. Schreuder, P. Gibson, K. Senecal, M. Sennett, J. Walker, W. Yeomans, D. Ziegler and P. Tsai, J. Adv. Mater-Covina., 2002, 34, 44–55 Search PubMed.
- Y. Si, T. Ren, B. Ding, J. Yu and G. Sun, J. Mater. Chem., 2012, 22, 4619–4622 RSC.
- J. Lin, B. Ding, J. Yang, J. Yu and G. Sun, Nanoscale, 2012, 4, 176–182 RSC.
- Y. Si, T. Ren, Y. Li, B. Ding and J. Yu, Carbon, 2012, 50, 5176–5185 CrossRef CAS.
Footnote |
| † Electronic Supplementary Information (ESI) available. See DOI: 10.1039/c2ra22086e |
|
| This journal is © The Royal Society of Chemistry 2012 |
Click here to see how this site uses Cookies. View our privacy policy here. 
![[thin space (1/6-em)]](https://www.rsc.org/images/entities/char_2009.gif) :
:![[thin space (1/6-em)]](https://www.rsc.org/images/entities/char_2009.gif) H3PO4
H3PO4![[thin space (1/6-em)]](https://www.rsc.org/images/entities/char_2009.gif) :
:![[thin space (1/6-em)]](https://www.rsc.org/images/entities/char_2009.gif) H2O = 1
H2O = 1![[thin space (1/6-em)]](https://www.rsc.org/images/entities/char_2009.gif) :
:![[thin space (1/6-em)]](https://www.rsc.org/images/entities/char_2009.gif) 0.01
0.01![[thin space (1/6-em)]](https://www.rsc.org/images/entities/char_2009.gif) :
:![[thin space (1/6-em)]](https://www.rsc.org/images/entities/char_2009.gif) 11 was prepared by hydrolysis and polycondensation by the dropwise addition of H3PO4 into TEOS with stirring at room temperature for 6 h. Then 10 g PVA solutions at concentrations of 8, 10, 12, and 14 wt% were dropped slowly into 10 g silica gel and stirred for another 4 h, respectively. Thus, viscous precursor solutions containing various PVA concentrations, used as the electrospinning solutions, were obtained.
11 was prepared by hydrolysis and polycondensation by the dropwise addition of H3PO4 into TEOS with stirring at room temperature for 6 h. Then 10 g PVA solutions at concentrations of 8, 10, 12, and 14 wt% were dropped slowly into 10 g silica gel and stirred for another 4 h, respectively. Thus, viscous precursor solutions containing various PVA concentrations, used as the electrospinning solutions, were obtained.
