Electroactivity of graphene oxide on different substrates†
Alessandra
Bonanni
and
Martin
Pumera
*
School of Physical and Mathematical Science, Division of Chemistry and Biological Chemistry, Nanyang Technological University, 21 Nanyang Link, Singapore. E-mail: pumera@ntu.edu.sg; Fax: (+ 65) 6791-1961
First published on 11th September 2012
Abstract
Graphene oxide is known to be electroactive on carbon materials due to the reduction of various inherent oxygen functionalities on its surface. In this work, we show that the characteristic reduction peak of graphene oxide is masked when the reduction is performed on different platforms (i.e. gold or platinum) apart from the usual carbon platform. Moreover, we demonstrated that the presence of gold nanoparticles (AuNPs) on the carbon platform has a strong influence on the reduction peak of graphene oxide nanoplatelets (GONPs). The influence of AuNP sizes and concentrations on the electrochemical reduction of GONPs was assessed as well. Finally, by XPS characterization we demonstrated that even though the reduction wave was not evident on the voltammogram, the reduction still occurred on the AuNP-modified carbon surfaces. Our findings can be very useful for those who are interested in exploiting the electroactivity of graphene oxide.
Introduction
There has been a great interest in graphene and its related materials since its successful isolation in 2004.1 Both reduced and oxidized graphene materials are currently used for applications in different fields such as solar cells,2 energy storage,3 nano-biodevices and electrochemistry.4–6 In particular, graphene oxide has demonstrated to be a very attractive material for numerous electrochemical studies and applications.7,8 In fact, the various oxygen functionalities on graphene oxide can be exploited either for the functionalization of its surface or for quantification of its oxygen containing groups through direct electrochemical reduction signals.9–12 The reduction signal of graphene oxide on a carbon surface has been shown by several authors who initially intended on obtaining a reduced graphene material by means of electrochemistry.11,13–15 The carbon surface has typically been selected as a platform for the electrochemical reduction of graphene oxide. In this study, we wish to show that by choosing a different surface for the electrochemical reduction, such as gold or platinum electrodes, the characteristic reduction peak of graphene oxide is not evident. By extending the study to a AuNP-modified glassy carbon surface, we would also like to demonstrate that the presence of AuNPs on the working platform can “mask” the appearance of the characteristic reduction peak. Despite the various platforms of electrodes, the reduction of GONPs occurs in all cases as demonstrated by XPS analyses. These findings are important for exploiting the electrochemical reduction of graphene oxide.Experimental
Materials
Stacked graphite nanoplatelets were obtained from Strem Chemicals (Newburyport, MA, USA) and have been characterized in detail previously.16 PBS buffer solution (10 mM sodium phosphate buffer, 0.1 M NaCl, pH 7.0) was used for electrochemical measurements. The gold nanoparticles used in this study were provided by Sigma Aldrich (Singapore) and British BioCell International (Cardiff, UK).All solutions were prepared using Milli-Q water (resistivity 18.2 MΩ cm). Glassy carbon electrodes were purchased from EcoChemie (The Netherlands). The three-electrode cell included the glassy carbon working electrode, a Ag/AgCl reference electrode, and a platinum counter electrode.
Equipment
X-ray photoelectron spectroscopy (XPS) was carried out with a Phoibos 100 spectrometer equipped with a monochromatic Mg X-ray source (SPECS, Germany). The high-resolution spectra for C1s have been recorded.Electrochemical measurements were performed with an Autolab potentiostat PGSTAT302 (Eco Chemie, The Netherlands) driven by GPES software, version 4.9. Cyclic voltammetry (CV) measurements were performed in PBS buffer solution.
Procedure
Graphene oxide nanoplatelets (GONPs) were prepared in bulk amounts by following conventional procedures:17 a modified Hummers' method was followed to produce graphite oxide nanoplatelets from graphite nanoplatelets.18,19 The oxidation of the graphite nanoplatelets was achieved by using a mixture of NaNO3, H2SO4 and KMnO4; the obtained graphite oxide powder was then dispersed in ultrapure water and ultrasonicated for 3 h to obtain graphene oxide nanoplatelets.20For electrode modification, 1 μL of AuNP solution was dropcasted on a glassy carbon electrode surface and allowed to dry at room temperature. After that, 1 μL of a GONP 1 mg ml−1 suspension in Milli-Q water was dropcasted onto the prepared AuNP-modified electrode and allowed to dry as before. For comparison of the effect of different AuNP sizes on the GONP reduction peak, experiments were performed using the same amount of gold fixed at 0.01%. This meant that the following concentrations were used to drop-cast on the electrode surface: AuNP-5 nm: 5.00 × 10¹³ part mL−1; AuNP-10 nm: 5.70 × 10¹² part mL−1; AuNP-20 nm: 8.25 × 10¹¹ part mL−1; AuNP-40 nm: 9.00 × 10¹⁰ part mL−1; AuNP-80 nm: 1.10 × 10¹⁰ part mL−1; AuNP-150 nm: 1.66 × 10⁹ part mL−1; AuNP-250 nm: 3.60 × 10⁸ part mL−1.
Results and discussion
We initially studied the electrochemical reduction of graphene oxide nanoplatelets at Pt, Au and glassy carbon (GC) electrode surfaces. The cyclic voltammograms for the reduction of the GONPs on the Pt, Au and GC electrodes are presented in Fig. 1. As displayed in the figure, a clear reduction peak was observed on the glassy carbon surface, due to the reduction of oxygen containing groups such as epoxides, aldehydes, and peroxides10 present on the GONP material. On the other hand, the cyclic voltammetries performed on the gold and platinum platforms did not give any reduction peaks. This is due to the much narrower potential windows of the Au and Pt platforms compared to carbon, which do not allow the reduction peak to be observed. In fact, it is also well known that the evolution of hydrogen occurs at more positive potentials on Au and Pt surfaces as compared to the carbon substrate,21 thus resulting in significant background currents which hinder the observation of any other signals within this potential window (see the ESI, Fig. S1†). | ||
| Fig. 1 Cyclic voltammograms for GONP reduction signals on the platinum electrode (Pt—grey curve), gold electrode (Au—blue curve), and glassy carbon electrode (GC—red curve). Experiments were performed in 10 mM PBS buffer solution, pH 7 and at a scan rate of 20 mV s−1. | ||
To further investigate the behaviour and extent to which the gold surface affects the electrochemistry of graphene oxide nanoplatelets, we modified the glassy carbon surface with a layer of gold nanoparticles (AuNPs). As shown in Fig. 2, a similar behaviour in the GONP reduction peak appearance as on the gold electrode was observed when the surface of the glassy carbon electrode was modified with gold nanoparticles. We proceeded to investigate the influence of various sizes and concentrations of AuNPs on the electrochemical reduction behavior of the GONPs. The appearance of the reduction signal was strongly dependent on the AuNP size and concentration, as we will show in the following text.
 | ||
| Fig. 2 Cyclic voltammograms for the GONP reduction signal on glassy carbon (red line) and on the AuNP-modified glassy carbon surface (blue line). Experiments were performed in 10 mM PBS buffer solution, pH 7 and at a scan rate of 20 mV s−1. | ||
We first studied the influence of different AuNP sizes containing the same amount of gold on the appearance of the GONP voltammetric peak.
Fig. 3 illustrates the variation of the GONP reduction peak area for the GC electrode surfaces modified with AuNPs ranging from 5 to 250 nm diameter. As shown from the lower peak areas in the figure, the reduction peak was strongly masked by smaller AuNPs, mainly that from 5 to 20 nm. An increase in the peak area was then observed for AuNPs between 40 and 150 nm. Thereafter, a slight decrease in the peak area was recorded for 250 nm AuNPs. This can be explained by considering the fact that with the same amount of gold, the number of nanoparticles mL−1 decreases from small to large nanoparticles. Hence, a higher number of smaller AuNPs produces a more effective coverage effect on glassy carbon surfaces compared to a lower number of larger AuNPs. As such, the masking of the reduction peak was more significant when a larger number of smaller AuNPs was used to modify the GC surface. In fact, due to the large coverage of the electrode surface the behaviour of the system resembles that of a bare gold electrode, where hydronium reduction occurs at less negative potentials compared to GC electrodes, thus masking the GONP reduction signal. On the contrary, when the GC was modified with a smaller number of larger AuNPs, the area and magnitude of the reduction voltammetric peak increased and approached similar values obtained from unmodified GC surfaces (see the red bar in the Fig. 3 histograms).
 | ||
| Fig. 3 Histograms representing the GONP reduction peak area obtained on different diameter AuNP-modified glassy carbon surfaces. Experimental conditions: GONP concentration 1 mg ml−1; AuNPs from stock solution (gold colloid concentration 0.01%). Concentrations used were the following: AuNP-5 nm: 5.00 × 10¹³ part mL−1; AuNP-10 nm: 5.70 × 10¹² part mL−1; AuNP-20 nm: 8.25 × 10¹¹ part mL−1; AuNP-40 nm: 9.00 × 10¹⁰ part mL−1; AuNP-80 nm: 1.10 × 10¹⁰ part mL−1; AuNP-150 nm: 1.66 × 10⁹ part mL−1; AuNP-250 nm: 3.60 × 10⁸ part mL−1. Standard deviations correspond to five experiments. | ||
Fig. 4 illustrates the concentration dependence obtained for the reduction peak area of GONPs on glassy carbon electrodes modified with a similar size of AuNP at different concentrations, from stock solution (concentration of 8.25 × 10¹¹ particles mL−1) up to 1![[thin space (1/6-em)]](https://www.rsc.org/images/entities/char_2009.gif) :5000 dilutions. As shown in the figure, upon decreasing the concentration of AuNPs on the glassy carbon surface, the reduction signal kept increasing to ultimately give a similar GONP reduction behaviour as that of a bare glassy carbon surface. A linear trend was obtained for the AuNP concentration ranging from 1 × 10¹⁰ to 1 × 10¹¹ particles mL−1. The cyclic voltammograms obtained for the linear part are shown in the inset. It is clear that changing from a more concentrated solution (1.65 × 10¹¹ particles mL−1—light grey line) to a more diluted one (8.25 × 10⁹ particles mL−1—dashed black line), the peak started to appear and grow to finally provide a response which was very similar to the one obtained from glassy carbon (dotted red curve). In order to understand whether the masking of the reduction peak occurring in the presence of AuNPs corresponded to the inhibition of the electrochemical reduction process, we employed the X-ray photoelectron spectroscopy (XPS) technique. XPS is a powerful tool to investigate the amount of oxygen containing groups on graphenic surfaces. The amount of oxygen containing groups at GONPs was investigated by XPS before and after the GONPs were electrochemically reduced, both in the absence and presence of AuNPs on the carbon electrode surface.
:5000 dilutions. As shown in the figure, upon decreasing the concentration of AuNPs on the glassy carbon surface, the reduction signal kept increasing to ultimately give a similar GONP reduction behaviour as that of a bare glassy carbon surface. A linear trend was obtained for the AuNP concentration ranging from 1 × 10¹⁰ to 1 × 10¹¹ particles mL−1. The cyclic voltammograms obtained for the linear part are shown in the inset. It is clear that changing from a more concentrated solution (1.65 × 10¹¹ particles mL−1—light grey line) to a more diluted one (8.25 × 10⁹ particles mL−1—dashed black line), the peak started to appear and grow to finally provide a response which was very similar to the one obtained from glassy carbon (dotted red curve). In order to understand whether the masking of the reduction peak occurring in the presence of AuNPs corresponded to the inhibition of the electrochemical reduction process, we employed the X-ray photoelectron spectroscopy (XPS) technique. XPS is a powerful tool to investigate the amount of oxygen containing groups on graphenic surfaces. The amount of oxygen containing groups at GONPs was investigated by XPS before and after the GONPs were electrochemically reduced, both in the absence and presence of AuNPs on the carbon electrode surface.
 | ||
| Fig. 4 The calibration curve for the GONP reduction peak area towards different AuNP concentrations on the GC surface. AuNP diameter: 20 nm. Standard deviations correspond to five experiments. Inset: cyclic voltammograms showing GONP reduction peaks for different AuNP concentrations on GC: 1.65 × 10¹¹ part mL−1 (light grey line); 8.25 × 10¹⁰ part mL−1 (grey line); 1.65 × 10¹⁰ part mL−1 (black line); 8.25 × 10⁹ part mL−1 (dashed black line); unmodified GC (dashed red line). Experiments were performed in 10 mM PBS buffer solution, pH 7 and at a scan rate of 20 mV s−1. | ||
Fig. 5 shows the C1s core level spectra for the GONPs before and after the electrochemical reduction on both the GC (part A) and the AuNP-modified GC (part B) surfaces. Two dominant peaks were obtained for the untreated GONPs in both cases. The first peak centered at 284.5 eV is relative to the binding energy of the C![[double bond, length as m-dash]](https://www.rsc.org/images/entities/char_e001.gif) C sp2 state, while the second peak centered at 286.5 eV includes the oxygen functionalities on the GONP surface. After the electrochemical reduction of the GONPs on the GC platform, only the peak relative to the CC sp2 carbon was observed in the spectra (Fig. 5A), whilst the peak due to the oxygen functionalities was almost completely suppressed, indicating that the electrochemical reduction was effective. A very similar profile was obtained when the reduction occurred on the AuNP-modified GC surface (Fig. 5B). This means that even though the voltammetric reduction peak was not present on the AuNP-modified GC surface, (see Fig. 2, blue curve) the electrochemical reduction occurred nevertheless.
C sp2 state, while the second peak centered at 286.5 eV includes the oxygen functionalities on the GONP surface. After the electrochemical reduction of the GONPs on the GC platform, only the peak relative to the CC sp2 carbon was observed in the spectra (Fig. 5A), whilst the peak due to the oxygen functionalities was almost completely suppressed, indicating that the electrochemical reduction was effective. A very similar profile was obtained when the reduction occurred on the AuNP-modified GC surface (Fig. 5B). This means that even though the voltammetric reduction peak was not present on the AuNP-modified GC surface, (see Fig. 2, blue curve) the electrochemical reduction occurred nevertheless.
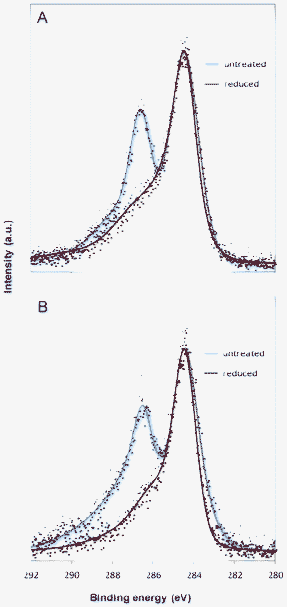 | ||
| Fig. 5 High resolution XPS characterization of the GONPs before (untreated, blue curve) and after electrochemical reduction (reduced, red curve). A: Reduction performed on the GC surface. B: Reduction performed on the AuNP-modified GC surface. AuNP diameter used for the experiment: 20 nm. | ||
Conclusions
In this work, we have studied the electrochemical reduction of graphene oxide nanoplatelets (GONPs) on different surfaces such as carbon, platinum and gold. We showed that the characteristic reduction peak obtained on the carbon surface is not observable when the reduction is carried out on platinum and gold surfaces. We further studied how the reduction peak of the GONPs was influenced by the presence of gold nanoparticles (AuNPs) with different sizes and concentrations on the surface of a glassy carbon electrode. With additional characterizations of the material by the XPS technique, we demonstrated that even in the absence of the characteristic reduction peak, the reduction of GONPs still occurs on the AuNP-modified GC surface. We believe that our study can be very useful in the field of graphene electrochemistry to gain better insights on the performance of the material on different platforms.References
- K. S. Novoselov, A. K. Geim, S. V. Morozov, D. Jiang, Y. Zhang, S. V. Dubonos, I. V. Grigorieva and A. A. Firsov, Science, 2004, 306, 666 CrossRef CAS.
- F. Bonaccorso, Z. Sun, T. Hasan and A. C. Ferrari, Nat. Photonics, 2010, 4, 611 CrossRef CAS.
- M. I. Hoffert, K. Caldeira, G. Benford, D. R. Criswell, C. Green, H. Herzog, A. K. Jain, H. S. Kheshgi, K. S. Lackner, J. S. Lewis, H. D. Lightfoot, W. Manheimer, J. C. Mankins, M. E. Mauel, L. J. Perkins, M. E. Schlesinger, T. Volk and T. M. L. Wigley, Science, 2002, 298, 981 CrossRef CAS.
- M. Pumera, Chem. Rec., 2009, 9, 211 CrossRef CAS.
- Y. Y. Shao, J. Wang, H. Wu, J. Liu, I. A. Aksay and Y. H. Lin, Electroanalysis, 2010, 22, 1027 CrossRef CAS.
- A. Bonanni, A. H. Loo and M. Pumera, TrAC, Trends Anal. Chem., 2012, 37, 12 CrossRef CAS.
- S. Mao, H. H. Pu and J. H. Chen, RSC Adv., 2012, 2, 2643 RSC.
- Y. Wang, Z. Li, J. Wang, J. Li and Y. Lin, Trends Biotechnol., 2011, 29, 205 CrossRef CAS.
- A. Bonanni, A. Ambrosi and M. Pumera, Chem.–Eur. J., 2012, 18, 4541 CrossRef CAS.
- E. L. K. Chng and M. Pumera, Chem.–Asian J., 2011, 6, 2899 CrossRef CAS.
- H. L. Guo, X. F. Wang, Q. Y. Qian, F. B. Wang and X. H. Xia, ACS Nano, 2009, 3, 2653 CrossRef CAS.
- A. Bonanni, C. K. Chua, G. C. Zhao and M. Pumera, ACS Nano, 2012 DOI:10.1021/nn301359y.
- M. Zhou, Y. L. Wang, Y. M. Zhai, J. F. Zhai, W. Ren, F. A. Wang and S. J. Dong, Chem.–Eur. J., 2009, 15, 6116 CrossRef CAS.
- A. Ambrosi, A. Bonanni, Z. Sofer, J. S. Cross and M. Pumera, Chem.–Eur. J., 2011, 17, 10763 CrossRef CAS.
- A. Bonanni, A. Ambrosi and M. Pumera, Chem.–Eur. J., 2012, 18, 1668 CrossRef CAS.
- A. Ambrosi, T. Sasaki and M. Pumera, Chem.–Asian J., 2010, 5, 266 CrossRef CAS.
- J. Y. Luo, L. J. Cote, V. C. Tung, A. T. L. Tan, P. E. Goins, J. S. Wu and J. X. Huang, J. Am. Chem. Soc., 2010, 132, 17667 CrossRef CAS.
- W. S. Hummers and R. E. Offeman, J. Am. Chem. Soc., 1958, 80, 1339 CrossRef CAS.
- L. J. Cote, F. Kim and J. X. Huang, J. Am. Chem. Soc., 2009, 131, 1043 CrossRef CAS.
- J. I. Paredes, S. Villar-Rodil, A. Martinez-Alonso and J. M. D. Tascon, Langmuir, 2008, 24, 10560 CrossRef CAS.
- H. Krassen, S. Stripp, G. von Abendroth, K. Ataka, T. Happe and J. Heberle, J. Biotechnol., 2009, 142, 3 CrossRef CAS.
Footnote |
| † Electronic Supplementary Information (ESI) available. See DOI: 10.1039/c2ra22079b |
| This journal is © The Royal Society of Chemistry 2012 |