Electrochemically-driven and dynamic enhancement of drug metabolism via cytochrome P450 microsomes on colloidal gold/graphene nanocomposites†
Minghe
Huang
,
Xuan
Xu
,
Hao
Yang
and
Songqin
Liu
*
State Key Laboratory of Bioelectronics, School of Chemistry and Chemical Engineering, Southeast University, Jiangning District 211189, Nanjing, Jiangsu Province, P.R. China. E-mail: liusq@seu.edu.cn; Fax: +86 25 52090618; Tel: +86 25 52090613
First published on 12th October 2012
Abstract
Cytochrome P450 enzymes (cyt P450s) are iron-heme proteins involved in the metabolism of both endogenous and exogenous compounds. Accurate and rapid in vitro mimicking of the natural metabolic pathways has attracted significant interest from enzyme engineers. Herein, we describe the electrochemically driven and dynamic enhancement of drug metabolism, which is based on the cyt P450 3A4 (CYP3A4) isozyme microsomes with cyt P450 reductase (CPR) immobilized on colloidal gold/graphene nanocomposites via electrostatic interactions. Direct and reversible electron transfer between the electrode and CYP3A4/CPR-microsomes was observed with a formal potential of −0.482 ± 0.003 V. The bioelectrocatalytic response of the P450-electrode has been validated by the catalysis of nifedipine. Through the application of the rotating disk electrode, the corresponding kinetic parameters, namely the Michaelis–Menten constant and the heterogeneous reaction rate constant, were calculated to be 1.30 μM and 7.12 cm s−1, respectively. The inhibition effect of ketoconazole on the oxidation of nifedipine was also investigated and the IC50 value was calculated to be 0.23 μM. The bioelectrocatalytic products were analyzed through high performance liquid chromatography-mass spectrometry (HPLC-MS) measurements. This new format of the cyt P450s system could probe the catalytic pathway with voltammetric kinetic analyses, and facilitated electronically-driven bioreactor and biosensor applications.
1 Introduction
As a member of the iron-heme monooxygenase superfamily, cytochrome P450 enzymes (cyt P450s) expressed in the human liver are involved in the phase I metabolism of a variety of compounds, including certain classes of drugs and xenobiotics.1,2 The P450 isozymes catalyze a variety of chemical reactions, including hydroxylation, O-dealkylation, and N-oxidation. Some enzymes evolve to generate reactive metabolites that trigger toxic effects through reactions with DNA, proteins, or other biomolecules.3 This metabolism is the initial step in the biotransformation and elimination of a wide variety of drugs and environmental pollutants from the body. Therefore, cyt P450s-based biosensors have become increasingly important to screen drug metabolism and predict the potential toxicity of compounds as early as possible in the drug discovery process. The most predominant P450 isoform, cyt P450 3A4 (CYP3A4), plays a vital role in the metabolism of 50% of clinical drugs, such as the 6β-hydroxylation of testosterone, the oxidation of nifedipine, and the N-demethylation of erythromycin and dextromethorphan.4 However, CYP3A4 is selectively inhibited by ketoconazole, midazolam, and troleandomycin.Cyt P450s metabolize substrates in the liver by a complex pathway that features the donation of electrons from NADPH via cyt P450 reductase (CPR) to the enzyme's iron-heme center.5 Cytochrome b5 has been shown to serve as the second electron donor for some cyt P450s.6 Efforts have been made to explore the potential application of cyt P450s in bioreactors or biosensors, but researchers have had to face difficulties from the limited stability of the multi-enzyme system and the need to regenerate the cofactor NADPH. The electrode could be used as an alternative source of electrons, in place of NADPH, to provide a cost-effective and easy method for cyt P450s catalysis metabolite formation in vitro. However, the direct electron transfer of P450 enzymes on bare electrodes has proven to be difficult to achieve, because of the deeply buried heme centers and the instability of the biological matrix that tended to denature upon interaction with the electrode surface.7 An ideal way to modify the electrodes was to immobilize cyt P450s on an appropriate substrate to provide a suitable environment for retaining their native conformational state and catalytic activity. Rusling first reported the electrochemistry of P450cam on film-modified electrodes.8 Farmer et al. reported the electrocatalytic reduction of nitrite, nitric oxide, and nitrous oxide using thermophilic cyt P450 119 in didodecylammonium bromide (DDAB) film.9 More recently, direct electrochemistry and electrocatalysis of P450 BM3,10 human 1A2,11 and 3A412 have been confirmed on polyelectrolyte-modified electrodes. Gilardi and co-workers have previously reported the successful covalent immobilization of cyt P450s on gold electrodes using a self-assembled monolayer.7 The catalytic activity of the cyt P450s was determined using p-nitrophenol as a substrate, and the amount of the electrocatalysis product (p-nitrocatechol) was determined spectrophotometrically. Mie and co-workers immobilized microsomes containing CYP 3A4 and CPR on hydrophobic electrodes.13 The electrochemically-driven metabolism of testosterone was detected in their later studies. This feature article worked on the utilization of electrons from an electronic source for donation from CPR to CYP 3A4 to directly mimic the natural catalytic pathway on an electrode.
Recently, nanomaterial-based biosensors have become a promising platform for direct electrochemistry and electrocatalysis investigations. Electrochemical studies have shown that carbon nanotubes are capable of facilitating electron transfer and enhancing electrocatalytic activity.14 The polyacrylic resin nanoparticles synthesized by our group possessed uniformity and good biocompatibility, which qualified them as a good matrix for protein immobilization.15 The direct electrochemical and electrocatalytic behavior of the immobilized cyt P450 2B6 (CYP 2B6) on zirconium dioxide nanoparticles was investigated by our group.16 Graphene, as a “rising star” carbon nanomaterial, has attracted significant attention in both the experimental and theoretical scientific communities due to its unique physical properties, such as great mechanical strength, excellent electrical conductivity, and high specific surface area.17 On the basis of these attractive properties, graphene could act as an effective modifier for the immobilization of redox enzymes. However, graphene sheets tend to aggregate, owing to the π–π stacking tendency and van der Waals interactions, which might lead to great technical difficulties in the applications of graphene.18 Nevertheless, aggregation could be overcome by covalent or non-covalent methods. Among the non-covalent strategies, poly(diallyldimethylammonium chloride) (PDDA), an ordinary positively charged polyelectrolyte, could be adsorbed on the surface of graphene sheets through π–π and electrostatic interactions, to greatly improve the dispersity of graphene in water.19,20 Au nanoparticles (Au NPs) have received considerable attention because of their large specific surface area, good biocompatibility, and high conductivity.21 It has been shown that decorated Au NPs could be used to simulate the appropriate bioenvironment to maintain redox proteins in their native state.22 In the past years, our laboratory has fabricated a biocompatible film by entrapping CYP 2B6 isozyme microsomes into Au–chitosan, and realized the direct electrochemistry of CYP 2B6 and applied electrocatalysis toward three common clinical drugs.23 Au NPs have also been used as electron transfer mediators and as ‘electric wires’ for enhancing the electron transfer rate between immobilized redox proteins and the electrode surface. Ramanaviciene and co-workers have previously investigated and estimated the influence of gold nanoparticles as redox mediators for dissolved glucose oxidase activity.24 The enzymatic reaction rate in the presence of Au nanoparticles was higher than without Au nanoparticles. Au NPs could give immobilized biomolecules more freedom in orientation, which made the active sites closer to the metal particle surface, and therefore the electron transfer easier.25
In this paper, we presented a novel platform that accurately mimicked the natural cyt P450s catalytic pathway on electrodes using layer-by-layer films that combined microsomal CPR with human liver CYP3A4. This platform could then serve as a method of choice to investigate direct electron transfer, metabolism and enzyme inhibition. The resulting nanocomposite was designed by combining the excellent conductivity of PDDA-functionalized graphene with the biocompatibility of Au NPs. Microsomes contained lipid, Cyt P450s, CPR, and cyt b5. The human cyt P450s (pI > 8) had a net positive charge, whereas microsomes had net negative charges due to the phospholipids and the slightly acidic pI values of CPR and cyt b5.26–28 Hence, the positive hybrid, through absorbing a PDDA membrane to the nanocomposite, was obtained and subsequent CYP3A4/CPR-microsomes were successfully bound to the surface of the hybrid through electrostatic interactions. Moreover, electrocatalysis by the immobilized enzyme was further confirmed by analysis when the product formed. Nifedipine (NIF), a calcium channel antagonist, was predominantly metabolized by CYP3A4 to dehydronifedipine (DNIF).46 Ketoconazole was used to illustrate the applicability of the product to establish drug–drug interactions involving enzyme inhibition.
2 Experimental
2.1 Materials
Cytochrome P450 3A4 isozyme microsomes expressed in baculovirus-infected insect cells (human, recombinant), poly(diallyldimethylammonium chloride) (PDDA, Mw 200![[thin space (1/6-em)]](https://www.rsc.org/images/entities/char_2009.gif) 000–350000, 20 wt% in water), nifedipine (≥98%, powder), and ketoconazole (≥98%, powder) were obtained from Sigma Aldrich Chemical Co. HAuCl4·4H2O (Au% = 47.8%), Hydrazine hydrate (≥85%) and trisodium citrate dehydrate (≥99%) were purchased from Nanjing Reagent Co. (Nanjing, China). Graphite oxide was purchased from Nanjing XFNANO Materials Tech Co. (Nanjing, China). Phosphate buffer solution (PBS, 0.1 M, pH 7.4) was prepared by mixing the stock standard solutions of K2HPO4 and KH2PO4. Other reagents were of analytical reagent grade and were used as received. Doubly distilled water was used throughout the study.
000–350000, 20 wt% in water), nifedipine (≥98%, powder), and ketoconazole (≥98%, powder) were obtained from Sigma Aldrich Chemical Co. HAuCl4·4H2O (Au% = 47.8%), Hydrazine hydrate (≥85%) and trisodium citrate dehydrate (≥99%) were purchased from Nanjing Reagent Co. (Nanjing, China). Graphite oxide was purchased from Nanjing XFNANO Materials Tech Co. (Nanjing, China). Phosphate buffer solution (PBS, 0.1 M, pH 7.4) was prepared by mixing the stock standard solutions of K2HPO4 and KH2PO4. Other reagents were of analytical reagent grade and were used as received. Doubly distilled water was used throughout the study.
2.2 Instrumentation
Zeta potential analysis was performed by a Nano-Z Zetasizer nanoparticle analyzer (Malvern Instruments Ltd, USA). The FT-IR spectra of the samples were obtained on a Bruker Tensor 27 instrument (Bruker corpo-ration, Germany) with dry KBr pellets. Raman spectra were collected with a Labram HR800 Laser Raman spectrophotometer (Jobin Yvon, France) with an excitation wavelength of 514.5 nm. UV-Vis absorption spectra were captured on a UV-2450 spectrometer (Shimadzu, Japan). The morphology of the as-prepared nanomaterials were analyzed with a Tecnai G2 transmission electron microscope (TEM, FEI, Netherland) at an acceleration voltage of 200 kV. Electrochemical measurements were performed on a CHI 660C workstation with a traditional three-electrode system including a modified glassy carbon electrode (GCE, d = 3 mm), a Pt wire and a saturated calomel electrode (SCE) as the working, auxiliary and reference electrodes, respectively. The catalytic products were analyzed using high-performance liquid chromatography (HPLC) and electrospray ionization-mass spectrometry (ESI-MS). A Thermo series Accela HPLC system (Thermo, San Jose, CA, USA) was used in this study. A solution of 10 μL sample was injected onto a Thermo Syncronis C18 column (150 × 2.1 mm, particle size 5 μm). Separation was performed using a mobile phase of methanol and 0.1% formic acid at a flow rate of 350 μL min−1. For ESI-MS, a LTQ XL linear ion trap mass spectrometer (Thermo, San Jose, CA, USA) was operated in full scan at 3.0 kV spray voltage, −30 V capillary voltage, and 300 °C capillary temperature. To allow ESI, HPLC separation was carried out using methanol and 0.1% formic acid at a flow rate of 350 μL min−1 while coupled to ESI-MS.2.3 Synthesis of PDDA-functionalized graphene nano-sheets
The graphene oxide (GO) was obtained by exfoliation of graphite oxide under ultrasonication in a water bath for 2 h. The obtained brown dispersion was centrifugated at 3000 rpm for 30 min to remove any unexfoliated graphite oxide. Dialysis was performed to completely remove any residual salts and acids. Then, 20 mL of the as-prepared graphene oxide (1.0 mg mL−1) dispersion was mixed with 0.5 mL of 20 wt% PDDA solution and 0.1 mL hydrazine hydrate. After reaction at 100 °C for 24 h, the resulting materials were centrifuged, and washed with distilled water to remove excess hydrazine and PDDA. Finally, the resulting materials were dried in a vacuum oven for 24 h to obtain the PDDA-functionalized graphene (PDDA/G).2.4 Synthesis of citrate-capped Au nanoparticles
All the pieces of glassware used in the experimental procedures were thoroughly cleaned in a bath of freshly prepared HNO3/HCl (3:1, v/v), rinsed completely with doubly distilled water, and dried prior to use. The colloidal Au NPs were synthesized according to the procedure described by Turkevich et al.29 The resultant solution was filtered through a 0.22 μm cellulose nitrate filter and stored in a brown bottle at 4 °C. The as-synthesized Au NPs had a diameter of about 13 nm, which was determined by TEM (Fig. S1†). The UV-Vis absorption spectrum was centered at 518 nm, which was consistent with well-dispersed, spherical Au NPs in aqueous media (Fig. S5†).
2.5 Assembly of Au NPs on PDDA-functionalized graphene nano-sheets
Briefly, 1.0 mg PDDA/G was dispersed in 2 mL of distilled water under sonication to form a homogeneous black suspension. Then, a total of 100 μL PDDA/G suspension was added dropwise into 4 mL of Au NPs solution under stirring for 2 h. After that, the mixture was mildly ultrasonicated for 2 min, followed by aging overnight. After washing thoroughly with distilled water, the sediment was collected by centrifugation to obtain Au/PDDA/G nanocomposites.2.6 Construction of CYP3A4/CPR-microsomes/PDDA/Au/PDDA/G/GCE biosensor
The as-prepared Au/PDDA/G nanocomposite was added to 2.0 mL of 2 mg mL−1 PDDA solution containing 50 mM NaCl. The mixture was then vigorously shook for 20 min, centrifuged at 6000 rpm for 5 min, washed thoroughly with distilled water, and redispersed in water to a final volume of 1.0 mL to obtain PDDA/Au/PDDA/G nanocomposites. Then, 5 μL of the as-prepared PDDA/Au/PDDA/G nanocomposites was dropped on the pretreated GCE and dried in a desiccator. Then, 5 μL of CYP3A4/CPR-microsomes was coated on the resultant electrode and dried at 4 °C for 12 h. The model of the CYP3A4/CPR-microsomes biosensor is illustrated in Scheme 1.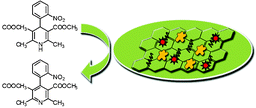 | ||
| Scheme 1 Illustration of fabricate the model of the CYP3A4/CPR-microsomes biosensor. | ||
3 Results and discussion
3.1 Characterization of the PDDA/Au/PDDA/G nanocomposites
PDDA/G was prepared by a simple wet-chemical route. The noncovalent adsorption of positively charged PDDA greatly enhanced the dispersity of graphene in water by upto one month (Fig. S2†). The conversion of graphene oxide to graphene by hydrazine was proved by Raman spectroscopy. As shown in Fig. S3†, GO displayed two prominent peaks at 1588 and 1356 cm−1, which corresponded to the G and D bands, respectively.30 The intensity ratio of the D band to the G band increased from 1.24 to 1.71 after chemical reduction which confirmed the successful reduction of graphene oxide to graphene.31 Upon PDDA adsorption, the G band of graphene up-shifted from 1588 to 1599 cm−1, which indicated the occurrence of electron transfer from graphene to the adsorbed PDDA.32,33 The formation of the stable PDDA-functionalized graphene was further characterized by FT-IR spectra (Fig. S4†). All the results suggested that PDDA was successfully modified on the as-synthesized graphene nano-sheets.The typical TEM image of the as-prepared Au/PDDA/G nanocomposites showed that graphene could serve as a template for orderly decorating with Au NPs via electrostatic interactions, and that the attached Au nanoparticles had a well-scattered distribution on the PDDA/G supports (Fig. 1A and B). The Au/PDDA/G nanocomposites produced a clear UV-vis absorption peak at 268 nm, which corresponded to the overlap of absorption bands of PDDA/G. In addition, the red shift and broadening of the absorption band for Au/PDDA/G, compared with that of Au NPs in solution, was caused by an increase of nanoparticle size due to aggregation (Fig. S5†). This confirmed the successful decoration of PDDA/G with Au NPs.
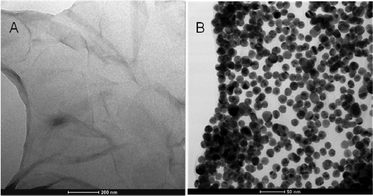 | ||
| Fig. 1 Typical TEM images of (A) PDDA/G and (B) the as-prepared Au/PDDA/G hybrid. | ||
The resulting Au/PDDA/G nanocomposites were further modified with PDDA in order to fine tune the surface charge of Au/PDDA/G in preparation for enzyme immobilization. The assembly process was demonstrated by zeta potential measurements (Fig. S6†). The mean zeta potential for GO was negative (−49.9 mV). After functionalization with PDDA, the PDDA/G showed a positive zeta potential (+48.3 mV), indicating that graphene was successfully functionalized by the positively charged PDDA. Then, owing to the modification with Au NPs, the surface potential of modified PDDA/G had a negative zeta potential of −29.2 mV. After further modification with PDDA, the zeta potential dramatically changed from negative to positive (+45.3 mV) which was attributed to the assembly of PDDA on the surface of the Au/PDDA/G nanocomposites.
3.2 Direct electrochemistry of CYP3A4/CPR-microsomes immobilized on PDDA/Au/PDDA/G nanocomposites
Fig. 2 shows the cyclic voltammograms of different modified electrodes in 0.1 M PBS, pH 7.4 at 100 mV s−1. In an anaerobic solution, a couple of well-defined redox peaks at −0.512 and −0.455 V were observed for the CYP3A4/CPR-microsomes/PDDA/Au/PDDA/G/GCE (Fig. 2, curve b), whereas no redox waves were observed for PDDA/Au/PDDA/G/GCE in the absence of CYP3A4/CPR-microsomes (Fig. 2, curve a). Thus, the responses on the CYP3A4/CPR-microsomes/PDDA/Au/PDDA/G/GCE could be attributed exclusively to the redox of the electroactive center of CYP3A4/CPR-microsomes. The formal potential of CYP3A4 calculated from the average of potentials at scan rates ranging from 100 to 500 mV s−1 was −0.482 ± 0.003 V. The formal potential was slightly negatively shifted in contrast to the reported value (−0.41 V) of the formal potential determined by a titration method for CYP3A4 bound to lipids,34 and around −0.40 V for CYP/CPR-microsomes on naphthalenethiolate-coated electrode.13 These results were probably due to the interactions between cyt P450s and the nanoparticles or the surface of the electrode, which could slightly alter the chemical environment and destabilize the heme group.35 Based on Laviron's method,36 the electron transfer rate constant (Ks) of CYP3A4/CPR-microsomes on PDDA/Au/PDDA/G/GCE was calculated to be 1.56 s−1 at the scan rate of 100 mV s−1. With the increase of scan rates, both redox peak currents and peak-to-peak separation increased. Anodic and cathodic peak currents were proportional to the scan rates (Fig. S7†). Thus, the electrode reaction was typical of surface-controlled quasi-reversible process. By comparison, the CYP3A4/CPR-microsomes/PDDA/G modified electrode displayed a pair of ill-defined and irreversible redox peaks at −0.424 and −0.496 V (Fig. S8†). The ΔEp was 72 mV at a scan rate of 100 mV s−1, and Ks was calculated to be 1.11 s−1, compared with 57 mV and 1.56 s−1 on CYP3A4/CPR-microsomes/PDDA/Au/PDDA/G/GCE under the same conditions, which indicated a slower electron transfer rate on the nanocomposite without Au NPs. Au NPs are a well known bio-nanomaterial and have been widely utilized as a mediator to immobilize a biomolecule to efficiently retain its activity.37 These results demonstrated that the nanocomposite PDDA/Au/PDDA/G provided a conductive and favorable microenvironment for the immobilized CYP3A4/CPR-microsomes by combining the good biocompatibility of Au NPs, excellent electron transport properties and the large surface area of graphene.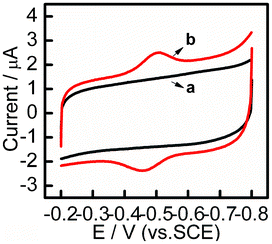 | ||
| Fig. 2 CV curves obtained for (a) PDDA/Au/PDDA/G and (b) CYP3A4/CPR-microsomes/PDDA/Au/PDDA/G modified GCE at a scan rate of 100 mV s−1 in anaerobic 0.1 M PBS, pH 7.4. | ||
3.3 Electrocatalysis behavior of CYP3A4/CPR-microsomes/PDDA/Au/PDDA/G
The catalytic behavior of the CYP3A4/CPR-microsomes/PDDA/Au/PDDA/G modified electrode was studied by cyclic voltrammetric measurements (Fig. S9†). The bioelectrocatalytic behavior towards nifedipine was also explored by rotating disk voltammetry (RDV, 1000 rpm) in aerobic pH 7.4 0.1 M phosphate buffer. Compared with stationary enzyme electrode, the rotating disk enzyme electrode has provided an ideal system for elucidating and understanding the various effects contributing to surface-bound biocatalysis.38 Firstly, parameters related to the rotating disk electrode measurements were in the steady-state for the reduction of the impact of the mass transfer process on the electrode kinetics since the diffusion condition of the electrode surface became stable with the electrode inherent rotation. Secondly, the rate of mass transport of substrate from the bulk solution to an electrode could be effectively controlled through the change of rotation speed of the electrode. Thirdly, the rotating enzyme electrode should give much faster response than a stationary electrode, shortening the analysis time due to the convective diffusion nature of the electrode. It was clear that the reduction peak current increased at −0.5 V along with successive injections of nifedipine to a continuously stirred PBS solution (Fig. 3A). The apparent Michaelis–Menten constant (Kmapp) provided an indication of the enzyme-substrate kinetics. According to the Lineweaver–Burk form of the Michaelis–Menten equation:38 1/Iss = (1/Imax) + (Kmapp /ImaxC), where Iss is the steady-state current, Imax is the maximum current under saturating substrate conditions, Kmapp is the apparent Michaelis–Menten constant and C is the concentration of substrates in the solution. Here Kmapp was obtained by the analysis of slope and intercept of the reciprocals of the steady-state current versus nifedipine concentration, from which the linear regression equation was determined to be I (μA−1) = 0.02111C (μM−1) + 0.02452 (R2 = 0.96) (Fig. 3B). Kmapp was calculated to be 1.30 μM, which was remarkably lower than the value reported in other literatures.39 The smaller value of Kmapp showed that the bound CYP3A4/CPR-microsomes to the PDDA/Au/PDDA/G hybrid electrode obtained higher enzymatic activity. By varying the electrode rotation speed, the rates of substrate mass transport on enzymatic catalysis have been investigated. The voltammetric profiles in aerobic pH 7.4 0.1 M phosphate buffer showed that the current was enhanced by an increase of the rotation rate from 600 to 2200 rpm (Fig. 3C). The corresponding Koutecky–Levich plots (i−1vs. ω−1/2) at various electrode potentials showed good linearity, which was considered as typical first-order reaction kinetics (Fig. 3D). The kinetic parameters could be analyzed on the basis of the Koutecky–Levich equations:40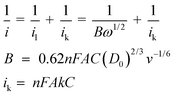 | (1) |
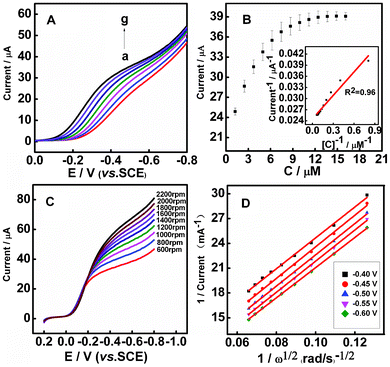 | ||
| Fig. 3 (A) CYP3A4/CPR-microsomes/PDDA/Au/PDDA/G films in electrochemical biocatalysis. Influence of increasing nifedipine concentration on rotating disk voltammograms (1000 rpm) in aerobic 0.1 M PBS, pH 7.4. (a–g: 0, 1.24, 2.48, 3.72, 4.96, 6.2, 7.44 μM). (B) Calibration plots illustrating the electrode response to nifedipine addition; (inset) double-reciprocal plot of catalytic current and the concentration of nifedipine. (C) Rotating disk electrode linear sweep voltammograms of CYP3A4/CPR-microsomes/PDDA/Au/PDDA/G in aerobic 0.1 M PBS, pH 7.4 with various rotation rates at the scan rate of 20 mV s−1. (D) Koutecky–Levich plot of i−1versus ω−1/2 at different electrode potentials. | ||
Electrolysis and HPLC-MS analyses were used to confirm the electrode-driven drug metabolism reactions. Electrolysis was conducted at an applied potential of −0.5 V (vs. SCE) in the presence of 20 μM nifedipine for 1 h. The catalytic products were collected and analyzed. The total ion chromatogram illustrated in Fig. 4B for the nifedipine-containing solution showed three peaks at 6.01, 6.15 and 6.29 min, whereas only two peaks at 6.13 and 6.27 min were observed for the pure nifedipine solution in Fig. 4A. Thus, the peak at 6.01 min was attributed to the product of dehydronifedipine after the electrolysis procedure. The mass spectrometer was set to generate and to select the protonated pseudo-molecular ion ([M+H]+) at m/z 346.96 for NIF and m/z 345.16 for DNIF (Fig. 4C and 4D). Results were consistent with previous reports on the metabolic reactions of NIF catalyzed by CYP3A4.47,48
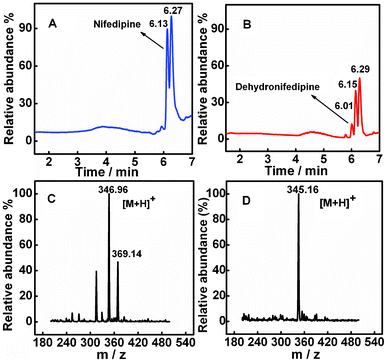 | ||
| Fig. 4 (A) The ion chromatogram of pure nifedipine. (B) The total ion chromatogram of the reaction mixture after 1h of electrolysis (−0.5 V vs. SCE) using CYP3A4/CPR-microsomes/PDDA/Au/PDDA/G in 7 mL of 0.1 M PBS, pH 7.4 with 20 μM nifedipine. Mass spectra of NIF (C) and DNIF (D) illustrating the base peak ions, m/z 346.69 and m/z 345.16, as the protonated molecular ions of nifedipine and dehydronifedipine, respectively. | ||
3.4 Inhibition study with known CYP3A4 inhibitors
Ketoconazole is a known inhibitor of cytochrome P450-mediated nifedipine metabolism.37 Inhibition studies with varying concentrations of ketoconazole from 0 to 0.68 μM were performed by addition into the aerobic solution with constant nifedipine concentration. The current versus the ketoconazole concentration is shown in Fig. 5. Ketoconazole strongly inhibited nifedipine oxidation in human liver microsomes with an IC50 value of 0.23 μM which was similar to previously reported values.39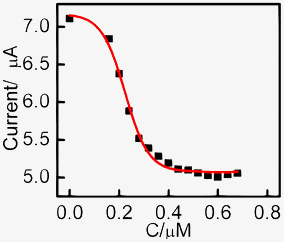 | ||
| Fig. 5 Change in bioelectrocatalytic current at −0.5 V vs. SCE upon addition of increasing concentration of ketoconazole. | ||
4 Conclusions
In summary, we have successfully fabricated PDDA/Au/PDDA/G nanocomposites, and constructed a novel cyt P450s/CPR microsome biosensor that efficiently monitors substrate metabolism and enzyme inhibition using the strategy of electrochemically-driven and dynamic enhancement. The platform based on in vitro screening for this specific metabolic pathway of P450 enzymes has provided accurate and precise kinetic parameters. This system may have potential for driving the development of drug discovery and the assessment of toxicity of chemicals in food and the environment. Besides, this novel bioelectronic system also offers potential value in various interactions between drugs and cytochrome P450 enzymes, such as for two or more drugs competing for the same enzyme, one drug metabolism based on several kinds of enzymes and multiple enzymes involved in cascade reactions. Other applications include efficient biosensors for bioreactors in chemical synthesis and the design of biological fuel cells.49 These goals are currently being pursued in our laboratory.Acknowledgements
This work is supported by the Key Program (21035002) of the National Natural Science Foundation of China, the National Basic Research Program of China (No.2010CB732400), the National Natural Science Foundation of China (Grant Nos. 20875013, 21175021) the Key Program (BK2010059) of the Natural Science Foundation of Jiangsu province, the Open Foundation of the State Key Laboratory of Bioelectronics, the Foundation for Excellent Doctoral Dissertation from Southeast University (YBJJ1112) and the Scholarship Award for Excellent Doctoral Student granted by the Ministry of Education.References
- M. J. Coon, Annu. Rev. Pharmacol., 2005, 45, 1 CrossRef CAS.
- F. P. Guengerich, Chem. Res. Toxicol., 2001, 14, 611 CrossRef CAS.
- J. A. Kramer, J. E. Sagartz and D. L. Morris, Nat. Rev. Drug Discovery, 2007, 6, 636 CrossRef CAS.
- F. P. Guengerich, Annu. Rev. Pharmacol., 1999, 39, 1 CrossRef CAS.
- S. Krishnan, J. B. Schenkman and J. F. Rusling, J. Phys. Chem. B, 2011, 115, 8371 CrossRef CAS.
- T. Shimada, R. L. Mernaugh and F. P. Guengerich, Arch. Biochem. Biophys., 2005, 435, 207 CrossRef CAS.
- L. H. Mak, S. J. Sadeghi, A. Fantuzzi and G. Gilardi, Anal. Chem., 2010, 82, 5357 CrossRef CAS.
- Y. M. Lvov, Z. Q. Lu, J. B. Schenkman, X. L. Zu and J. F. Rusling, J. Am. Chem. Soc., 1998, 120, 4073 CrossRef CAS.
- C. E. Immoos, J. Chou, M. Bayachou, E. Blair, J. Greaves and P. J. Farmer, J. Am. Chem. Soc., 2004, 126, 4934 CrossRef CAS.
- B. D. Fleming, Y. Tian, S. G. Bell, L.-L. Wong, W. Urlacher and H. A. O. Hill, Eur. J. Biochem., 2003, 270, 4082 CrossRef CAS.
- C. Estavillo, Z. Q. Lu, I. Jansson, J. B. Schenkman and J. F. Rusling, Biophys. Chem., 2003, 104, 291 CrossRef CAS.
- S. Joseph, J. F. Rusling, Y. M. Lvov, T. Friedberg and U. Fuhr, Biochem. Pharmacol., 2003, 65, 1817 CrossRef CAS.
- Y. Mie, M. Suzuki and Y. Komatsu, J. Am. Chem. Soc., 2009, 131, 6646 CrossRef CAS.
- L. N. Wu, X. J. Zhang and H. X. Ju, Anal. Chem., 2007, 79, 453 CrossRef CAS.
- P. Li, Y. Li, D. Li and S. Liu, Electroanalysis., 2010, 22, 1 CAS.
- L. Peng, X. Yang, Q. Zhang and S. Liu, Electroanalysis, 2008, 20, 803 CrossRef CAS.
- K. S. Novoselov, A. K. Geim, S. V. Morozov, D. Jiang, Y. Zhang, S. V. Dubonos, I. V. Grigorieva and A. A. Firsov, Science, 2004, 306, 666 CrossRef CAS.
- S. Niyogi, E. Bekyarova, M. E. Itkis, J. L. McWilliams, M. A. Hamon and R. C. Haddon, J. Am. Chem. Soc., 2006, 24, 7720 CrossRef.
- K. P. Liu, J. J. Zhang, G. H. Yang, C. M. Wang and J. Zhu, Electrochem. Commun., 2010, 12, 402 CrossRef CAS.
- S. Zhang, Y. Shao, H. Liao, M. H. Engelhard, G. Yin and Y. Lin, ACS Nano, 2011, 5, 1785 CrossRef CAS.
- J. M. Pingarron, P. Y. Sedeno and A. G. Cortes, Electrochim. Acta, 2008, 53, 5848 CrossRef CAS.
- A. L. Crumbliss, J. Stonehuerner, R. W. Henkens, J. Zhao and J. P. O'Daly, Biosens. Bioelectron., 1993, 8, 331 CrossRef CAS.
- S. Liu, L. Peng, X. Yang, Y. Wu and L. He, Anal. Biochem., 2008, 375, 209 CrossRef CAS.
- A. Ramanaviciene, G. Nastajute, V. Snitka, A. Kausaite, N. German, D. Barauskas-Memenas and A. Ramanavicius, Sens. Actuators, B, 2009, 137, 483 CrossRef.
- S. Q. Liu, D. Leech and H. X. Ju, Anal. Lett., 2003, 36, 1 CrossRef CAS.
- S. Krishnan, A. Abeykoon, J. B. Schenkman and J. F. Rusling, J. Am. Chem. Soc., 2009, 131, 16215 CrossRef CAS.
- J. B. Schenkman and J. F. Rusling, J. Am. Chem. Soc., 2011, 133, 1459 CrossRef.
- S. Krishnan, D. Wasalathanthri, L. Zhao, J. B. Schenkman, I. Jansson, Y. Lvov, J. F. Rusling, S. Boussaad and N. J. Tao, Arch. Biochem. Biophys., 2001, 385, 78 CrossRef.
- J. Turkevich, P. C. Stevenson and J. Hillier, Discuss. Faraday Soc., 1951, 11, 55 RSC.
- Z. J. Wang, J. Zhang, P. Chen, X. Z. Zhou, L. Y. Yang, S. X. Wu, L. Niu, Y. Han, L. H. Wang, P. Chen, F. Boey, Q. C. Zhang, B. Liedberg and H. Zhang, Biosens. Bioelectron., 2011, 26, 3881 CrossRef CAS.
- S. Wang, D. Yu, L. Dai, D. W. Chang and J.-B. Baek, ACS Nano, 2011, 5, 6202 CrossRef CAS.
- A. M. Rao, P. C. Eklund, S. Bandow, A. Thess and R. E. Smalley, Nature, 1997, 388, 257 CrossRef CAS.
- X. Qi, K.-Y. Pu, X. Zhou, H. Li, B. Liu, F. Boey, W. Huang and H. Zhang, Small, 2010, 6, 663 CrossRef CAS.
- A. Das, Y. V. Grinkova and S. G. Sligar, J. Am. Chem. Soc., 2007, 129, 13778 CrossRef CAS.
- A. J. Bard and L. R. Faulkner, Electrochemical Methods: Fundamentals and Applications, John Wiley, New York, 1980 Search PubMed.
- E. J. Laviron, J. Electroanal. Chem., 1979, 101, 19 CrossRef CAS.
- M. H. Yang, F. L. Qu, Y. J. Li, Y. He, G. L. Shen and R. Q. Yu, Biosens. Bioelectron., 2007, 23, 414 CrossRef CAS.
- R. A. Kamin and G. S. Wilson, Anal. Chem., 1980, 52, 1198 CrossRef CAS.
- J. Jiang, J. P. Wang, H. Cai, H. B. Li and Y. Q. Deng, Catal. Commun., 2011, 12, 694 CrossRef CAS.
- R. Liu, D. Wu, X. Feng and K. Mullen, Angew. Chem., 2010, 122, 2619 CrossRef.
- N. Sultana, J. B. Schenkman and J. F. Rusling, J. Am. Chem. Soc., 2005, 127, 13460 CrossRef CAS.
- L. H. Mak, S. J. Sadeghi, A. Fantuzzi and G. Gilardi, Anal. Chem., 2010, 82, 5357 CrossRef CAS.
- A. Fantuzzi, L. H. Mak, E. Capria, V. Dodhia, P. Panicco, S. Collins and G. Gilardi, Anal. Chem., 2011, 83, 3838 CrossRef.
- P. Panicco, V. R. Dodhia, A. Fantuzzi and G. Gilardi, Anal. Chem., 2011, 83, 2179 CrossRef CAS.
- V. E. V. Ferrero, L. Andolfi, G. Di Nardo, S. J. Sadeghi, A. Fantuzzi, S. Cannistraro and G. Gilardi, Anal. Chem., 2008, 80, 8438 CrossRef CAS.
- J. K. Racha, Z. S. Zhao, N. Olejnik, N. Warner, R. Chan, D. Moore and H. Satoh, Drug Metab. Pharmacokinet., 2003, 18, 128 CrossRef CAS.
- X. Wang, J. Li, Y. Lu, X. Chen, M. Huang, B. Chowbay and S. Zhou, J. Chromatogr., B: Anal. Technol. Biomed. Life Sci., 2007, 852, 534 CrossRef CAS.
- B. Streel, C. Zimmer, R. Sibenaler and A. Ceccato, J. Chromatogr., B: Biomed. Sci. Appl., 1998, 720, 119 CrossRef CAS.
- A. Ramanavicius and A. Ramanaviciene, Fuel Cells, 2009, 9, 25 CrossRef CAS.
Footnote |
| † Electronic Supplementary Information (ESI) available. See DOI: 10.1039/c2ra22014h |
| This journal is © The Royal Society of Chemistry 2012 |