DOI:
10.1039/C2RA21853D
(Paper)
RSC Adv., 2012,
2, 12812-12817
The efficiency of DPPH as a polarising agent for DNP-NMR spectroscopy†
Received
17th August 2012
, Accepted 24th October 2012
First published on 25th October 2012
Abstract
The free radical 2,2-diphenyl-1-picrylhydrazyl (DPPH) was tested as a polarising agent for fast dissolution dynamic nuclear polarisation (DNP) NMR spectroscopy. DPPH was found to be reasonably soluble in sulfolane and the optimum concentration for DNP is 20–40 mM depending upon whether short polarisation times or the maximum signal intensity is needed. W-band ESR measurements revealed that the ESR linewidth D of DPPH is intermediate between that of BDPA and 4-oxo-TEMPO. Several thousand-fold NMR signal enhancements in the liquid-state were achieved for 13C, 15N, 89Y, and 109Ag compounds, demonstrating that DPPH can be added to the list of polarising agents for DNP-NMR spectroscopy. Furthermore, the hydrophobic DPPH free radical can be easily filtered out from the dissolution liquid when water is used as the dissolution solvent.
1 Introduction
Nuclear magnetic resonance (NMR) is a relatively insensitive spectroscopic technique as a result of the inherently low magnetic moments of nuclei. The NMR signal is proportional to the nuclear polarisation P, which is governed by the Boltzmann distribution of nuclear spins on the Zeeman energy levels.1 Dynamic nuclear polarisation (DNP) relieves the sensitivity problem of NMR by transferring the high electron thermal polarisation to the nuclear spins via microwave irradiation at moderate magnetic field and cryogenic temperature.2–5 While DNP was commonly used in the production of polarised targets for particle and nuclear physics experiments, it was not until 2003 that a fast dissolution device was integrated with a dynamic nuclear polariser operating close to 1 K, allowing several thousand-fold NMR signal enhancements of various nuclei in the liquid state.6 With this capability, the application of DNP has thus been extended to chemistry and biomedical NMR spectroscopy and imaging,7–9 with the requirement that the nucleus of interest should have long spin–lattice relaxation time T1 which corresponds to the hyperpolarisation lifetime.
The source of the electron thermal polarisation is a central component of the DNP process. In the thermal mixing regime,2–5 which occurs when the electron spin resonance (ESR) linewidth D is larger than or comparable to the nuclear Larmor frequency, higher nuclear polarisation can be achieved using free radicals with narrow ESR linewidth. Small linewidths translate to low electron heat capacity and thus lower spin temperature of the electron dipolar system, which results in lower equilibrium spin temperatures with the coupled nuclear Zeeman system.10–12 Currently, the most commonly used free radical polarising agents for fast dissolution DNP-NMR include the trityls (e.g. OX063), nitroxides (e.g. TEMPO), and their derivatives.13–15 In addition, the carbon-centered stable free radical 1,3-bisdiphenylene-2-phenylallyl or BDPA (see Fig. 1) was also found to be an efficient polarising agent for DNP-NMR spectroscopy and has the added benefit of easy removal from aqueous dissolution liquids by simple mechanical filtration.16
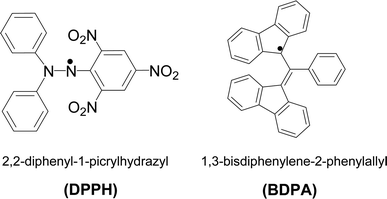 |
| | Fig. 1 The structures of the free radical polarising agents discussed in this work. | |
The violet-colored stable free radical 2,2,-diphenyl-1-picrylhydrazyl or DPPH (see structure in Fig. 1) was first synthesized by Goldschmidt and Renn in 1922.17 Due to its stability and nonreactivity with oxygen, DPPH has been used to test the antioxidant properties of a variety of natural and synthetic products.18–24 In addition, polycrystalline DPPH has been suggested as a standard for high field ESR calibration because of the linearity of its linewidth broadening with increasing magnetic field.25 DPPH has been mentioned in the DNP literature before where it has been used to generate highly polarised frozen samples in the solid-state at low temperatures.26–30 However, this free radical has not been tested as a polarising agent in fast dissolution DNP experiments probably due to the difficulty of finding appropriate glassing agents. Here, we have found that, similar to the BDPA free radical,16 DPPH is substantially soluble in sulfolane and other solvents such as dimethyl sulfoxide (DMSO). The availability of a variety of free radical polarising agents for hyperpolarisation is important for two main reasons: first, some radicals are not chemically compatible with certain substrates as attested by trityl OX063, which does not work with silver compounds;31 and second, free radicals with broad linewidth such as the nitroxide-based TEMPO are more effective for 1H–13C DNP cross polarisation experiments than the narrow D free radicals trityl OX063 and BDPA.32 Thus, the aim of this work was to test whether DPPH can be added to the list of polarising agents for fast dissolution DNP-NMR spectroscopy.
2 Materials and methods
Materials
The DPPH and BDPA free radicals, [1-13C]ethyl acetate, [13C]urea, [15N]choline, Y(OTf)3, and the crypt-222 ligand were all purchased from commercial sources (Sigma-Aldrich, St. Louis, MO, USA). In addition, a DPPH-derivative, 2,2-di(4-tert-octylphenyl)-1-picrylhydrazyl (see results in the ESI†) was also obtained from Sigma-Aldrich. The compounds Ag(crypt-222)OTf and pentaerythrityl tetraazide were synthesized as described in previous works.31,33 All solvents used in this project were also acquired from commercial sources.
Electron spin resonance
The ESR measurements described in this work were performed at the National High Magnetic Field Laboratory in Tallahassee, FL, USA. W-band ESR was carried out on a commercial E680 W-band ESR spectrometer (Bruker, Billerica, MA, USA) and a Bruker TE011 cylindrical cavity with a base temperature of ∼5 K. 0.15 mm ID quartz capillary tubes were used as containers for DPPH and BDPA samples. The ESR spectra were taken by the electron spin echo method and the electron T1e recovery curves were recorded by saturation recovery.
Hyperpolarisation
Small sample aliquots (40–100 μL) were polarised using the commercial HyperSense polariser (Oxford Instruments, Abingdon, UK) operating at 3.35 T and 1.4 K with a 100 mW microwave source. The final concentration of DPPH in the frozen samples was 20 mM.
(a) [1-13C]ethyl acetate: DPPH (1.6 mg) was dissolved in sulfolane (100 μL) and the solution was mixed with an equal volume of [1-13C]ethyl acetate. 40 μL aliquots were polarised in the HyperSense for 1 h. Methanol (4 mL) was used as the dissolution solvent. (b) [13C]urea: [13C]urea (25 mg) was dissolved in a solution containing 100 μL dimethyl sulfoxide and 100 μL sulfolane. 1.6 mg DPPH was added into the solution. 50 μL aliquots were polarised in the HyperSense for 2 h. Water (4 mL) was used as dissolution solvent. (c) [15N]choline: 90 mg of [15N]choline was dissolved in a solution of 150 μL sulfolane and 150 μL dimethyl sulfoxide. DPPH (2.36 mg) was added into the solution. 50 μL aliquots were polarised in the HyperSense for 3 h. Water (4 mL) was used as the dissolution solvent. (d) 15N natural abundance pentaerythrityl tetraazide. Pentaerythrityl tetraazide (118 mg) was dissolved in a solution containing 200 μL dimethyl sulfoxide and 200 μL sulfolane. DPPH (3.2 mg) was added to the solution. 100 μL aliquots were polarised in the HyperSense for 3 h. Methanol (4 mL) was used as the dissolution solvent. (e) 89Y(OTf)3: yttrium trifluoromethanesulfonate (98 mg) was dissolved in a solution of 200 μL sulfolane and 200 μL diethylene glycol monobenzyl ether. DPPH (3.2 mg) was added to the solution. 100 μL aliquots were polarised in the HyperSense for 5 h. Water (4 mL) was used as the dissolution solvent. (f) 109Ag(crypt-222)OTf: Ag(crypt-222)OTf (77.6 mg) was dissolved in a solution of 200 μL dimethyl sulfoxide and 200 μL sulfolane. DPPH (3.2 mg) was added into the solution. 100 μL aliquots were polarised in the HyperSense for 5 h. Methanol (4 mL) was used as the dissolution solvent. Cleaning of the HyperSense Teflon transfer line after dissolution of DPPH samples was done with 4 mL methanol (2×), then with 4 mL water (2×).
Liquid-state NMR measurements
All NMR measurements were performed at 298 K in a 9.4 T high resolution NMR spectrometer (Varian/Agilent Technologies, Santa Clara, CA, USA). Transfer of the dissolution liquid (transfer time = 8 s) from the polarised to a 10 mm NMR tube inside the 9.4 T magnet was done using a Teflon tube line. The NMR spectra were processed using ACD Labs version 12 software (Advanced Chemistry Development, Inc., Toronto, Canada). The NMR enhancement ε was calculated by taking the ratio of the integrated NMR signal in the hyperpolarised state over the thermal equilibrium NMR signal as described previously.11 In the case of 15N natural abundance azide and the ultra low-γ nuclei 89Y and 109Ag where acquiring a acceptable thermal NMR signal in the dissolution liquid is difficult, a concentrated reference sample was used: neat 15N natural abundance nitrobenzene, 3 M aqueous YCl3 solution,11 and 3 M aqueous AgNO3 solution,31 respectively. Liquid-state T1 values were obtained from the decay of the hyperpolarised NMR signal. The decay was monitored in a 1 mL sample by applying a small flip angle detection pulse. The data were fitted with an equation34 that incorporates loss of hyperpolarised magnetisation due to rf pulsing (as described by the parameters rf flip angle θflip and repetition time TR) and T1 relaxation (ESI†). The T1 recovery curves were analysed using Igor Pro version 6 (Wavemetrics, Inc., Portland, OR, USA).
3 Results and discussion
3.1 W-band ESR measurements
The ESR properties of the free radical have a great influence on the efficiency of the polarisation transfer. Therefore, we have recorded the ESR spectrum of DPPH at the same field (W-band, ∼94 GHz) at which the DNP polariser operates. Fig. 2a shows the W-band ESR spectra of DPPH (20 mM in 1![[thin space (1/6-em)]](https://www.rsc.org/images/entities/char_2009.gif) :1 v/v sulfolane:DMSO) and BDPA (20 mM in 1:1 v/v sulfolane:DMSO) samples taken at 100 K. The ESR spectra were recorded in 20 mM radical solutions since the optimum concentration of DPPH for the DNP of [1-13C]ethyl acetate was found to be 20–40 mM (ESI†). The base-to-base linewidth D of DPPH is approximately 290 MHz, which is intermediate between the ESR D of BDPA (62 MHz) and 4-oxo-TEMPO (465 MHz; ESI†). The asymmetric features of the DPPH spectra are attributed to the substantial g-anisotropy and hyperfine interaction of the paramagnetic electron with quadrupolar 14N nuclei. Fig. 2b and Fig. 2c show the recovery of the electronic magnetisation of the DPPH sample at 100 K (T1e = 1.87 ms) and 5 K (T1e = 30.1 ms), respectively, measured using the saturation recovery method. Analogous to the relaxation behaviour of the TEMPO radical in concentrated solution (40 mM) and at high magnetic field, a bi-exponential recovery equation was found to be appropriate to fit the electronic magnetisation recovery data. The longer component is attributed to T1e relaxation and the shorter component is ascribed to cross relaxation effects.35 In comparison, BDPA has longer W-band electronic T1e's at the same concentration and glassing conditions: 21.8 ms at 100 K and 176.4 ms at 5 K (ESI†). This relaxation behavior may be qualitatively attributed to the smaller g-anisotropy and hyperfine interaction of the carbon-centered BDPA than the N-centered DPPH. It is currently difficult to fit the DPPH ESR spectrum but previous estimates on the principal values of the g-tensor of DPPH in magnetically dilute polystyrene at 220 GHz yielded gx = 2.00435, gy = 2.00367, and gz = 2.00245.36
:1 v/v sulfolane:DMSO) and BDPA (20 mM in 1:1 v/v sulfolane:DMSO) samples taken at 100 K. The ESR spectra were recorded in 20 mM radical solutions since the optimum concentration of DPPH for the DNP of [1-13C]ethyl acetate was found to be 20–40 mM (ESI†). The base-to-base linewidth D of DPPH is approximately 290 MHz, which is intermediate between the ESR D of BDPA (62 MHz) and 4-oxo-TEMPO (465 MHz; ESI†). The asymmetric features of the DPPH spectra are attributed to the substantial g-anisotropy and hyperfine interaction of the paramagnetic electron with quadrupolar 14N nuclei. Fig. 2b and Fig. 2c show the recovery of the electronic magnetisation of the DPPH sample at 100 K (T1e = 1.87 ms) and 5 K (T1e = 30.1 ms), respectively, measured using the saturation recovery method. Analogous to the relaxation behaviour of the TEMPO radical in concentrated solution (40 mM) and at high magnetic field, a bi-exponential recovery equation was found to be appropriate to fit the electronic magnetisation recovery data. The longer component is attributed to T1e relaxation and the shorter component is ascribed to cross relaxation effects.35 In comparison, BDPA has longer W-band electronic T1e's at the same concentration and glassing conditions: 21.8 ms at 100 K and 176.4 ms at 5 K (ESI†). This relaxation behavior may be qualitatively attributed to the smaller g-anisotropy and hyperfine interaction of the carbon-centered BDPA than the N-centered DPPH. It is currently difficult to fit the DPPH ESR spectrum but previous estimates on the principal values of the g-tensor of DPPH in magnetically dilute polystyrene at 220 GHz yielded gx = 2.00435, gy = 2.00367, and gz = 2.00245.36
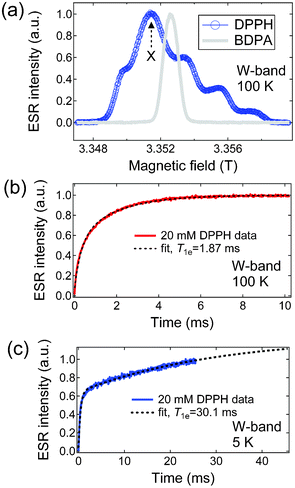 |
| | Fig. 2 (a) W-band ESR spectra of DPPH (20 mM in 1:1 v/v sulfolane:DMSO) and BDPA (20 mM in 1:1 v/v sulfolane:DMSO) taken at 100 K. Point X indicates the region where the subsequent electronic T1e measurements were measured. (b) Electronic T1e recovery curves at 100 K and (c) 5 K. The dashed lines are fits to a bi-exponential recovery equation where the longer component gives the T1e values (ESI†). | |
3.2
13C DNP in the solid-state
Fig. 3 displays the 13C microwave DNP spectrum, a plot of NMR signal enhancement as a function of microwave irradiation frequency near the ESR Larmor frequency of the free radical, of 1:1 v/v [1-13C]ethyl acetate doped with 20 mM DPPH at 3.35 T and 1.4 K. The up and down arrows indicate the positive P(+) and negative P(−) polarisation peaks, which correspond to minimum positive and negative spin temperatures, respectively. The microwave DNP spectrum of [1-13C]ethyl acetate sample doped with a DPPH derivative, 2,2-di(4-tert-octylphenyl)-1-picrylhydrazyl (Sigma-Aldrich, St. Louis, MO, USA) shows almost identical features, with a slight downfield shift of both polarisation peaks (ESI†). The microwave DNP spectrum of 1:1 v/v [1-13C]ethyl acetate:sulfolane doped with 20 mM BDPA is also shown in Fig. 2a for comparison. The polarisation peak separation |P(+)−P(−)| for the DPPH-doped sample is around 190 MHz whereas |P(+)−P(−)| = 60 MHz for the BDPA-doped sample; these values reflect the size of their ESR lineshapes, in qualitative agreement with the Borghini model26 of DNP spectra. Since the DPPH and BDPA samples have identical glassing components and concentration, a direct comparison can be made as to the level of nuclear polarisation that can be achieved with these free radicals. Experimental data (ESI†) show that a 13C solid-state nuclear polarisation of ∼11% can be achieved for the BDPA-doped [1-13C]ethyl acetate sample whereas the DPPH-doped sample only achieved about 5% polarisation. The higher polarisation level achieved with BDPA is expected because its narrow D corresponds to lower specific heat capacity of the electron dipolar system, thus leading to lower spin temperature (higher nuclear polarisation) of the nuclear Zeeman system in the thermal mixing DNP process.10–12 This type of behavior is also observed in other systems, i.e. the narrow D trityl OX063 yield higher 13C nuclear polarisation for [1-13C]pyruvate than the large D TEMPO under similar sample conditions.11,12 While the narrow D free radicals BDPA and trityl OX063 yield relatively higher DNP enhancements for low-γ nuclei such as 13C due to comparable electron dipolar energy <SD> and nuclear Zeeman energy <Iz>, these free radicals are less efficient in the thermal mixing DNP of high-γ nuclei such as 1H using the same microwave power and polariser conditions because of an energy mismatch between <Iz> and <SD>.37 Large D free radicals such as TEMPO can polarise protons via thermal mixing more efficiently, and thus are more appropriate polarising agents for 1H–13C low temperature DNP cross polarisation experiments.32 Although we are currently not equipped to perform such experiments, the large D of DPPH may provide similar advantages in DNP polarisation transfer studies in addition to providing substantial DNP enhancements on low-γ nuclear spins.
![13C microwave DNP spectra of the [1-13C]ethyl acetate sample doped with DPPH (•) and BDPA (■) at 3.35 T and 1.4 K. The up and down arrows indicate the positive (P(+) = 94.02 GHz) and negative (P(−) = 94.21 GHz) polarisation peaks of the DPPH-doped sample, respectively.](/image/article/2012/RA/c2ra21853d/c2ra21853d-f3.gif) |
| | Fig. 3
13C microwave DNP spectra of the [1-13C]ethyl acetate sample doped with DPPH (•) and BDPA (■) at 3.35 T and 1.4 K. The up and down arrows indicate the positive (P(+) = 94.02 GHz) and negative (P(−) = 94.21 GHz) polarisation peaks of the DPPH-doped sample, respectively. | |
3.3 Hyperpolarised 13C compounds in the liquid-state
The NMR signal amplification of long-T113C (spin-1/2, γ = 10.705 MHz T−1) spins has been a major goal of fast dissolution DNP-NMR technology because of the biological importance of carbon.6–9 We have found that DPPH is fairly soluble in sulfolane (at least 100 mM) however unlike BDPA,16 it does not require sonication to be fully dissolved in sulfolane. It is well suited for the dissolution DNP of organic compounds provided that they are soluble or miscible with the sulfolane based glassing mixtures. For example, a liquid-state NMR enhancement ε of 5300-fold was achieved for [1-13C]ethyl acetate (13C T1 = 45 s) at 9.4 T and 298 K 8 s after dissolution with methanol. Other organic compounds that could be polarised with DPPH in a similar way include benzene and methyl pyruvate. DPPH can also polarise water-soluble compounds such as [13C]urea (T1 = 44 s) which yielded an ε = 3200-fold enhancement when polarised in a sulfolane-DMSO glassing matrix as shown in Fig. 4b. DPPH works like BDPA:16 after dissolution with water, the DPPH radical precipitates out of the aqueous solution and can be filtered out using a 0.2-micron syringe filter. UV-Vis spectroscopy (ESI†) confirmed the absence of DPPH in the solution after this filtration process. We have also tried polarising [1-13C]pyruvic acid with DPPH, however, the radical seems to react with pyruvic acid as the color changed from violet to yellow, and consequently no DNP enhancement was observed.
![(a) Representative hyperpolarised (θflip = 0.5°) and thermal (θflip = 90°, 16 scans) 13C NMR signals of [1-13C]ethyl acetate (64 mM in methanol) taken at 9.4 T and 298 K. Average NMR enhancement ε = 5300 ± 450; T1 = 45 s. (b) Hyperpolarised (θflip = 1°) and thermal (θflip = 90°, 16 scans) NMR signals of [13C]urea (25.6 mM in water). Average NMR enhancement ε = 3200 ± 520; T1 = 44 s. The insets are the corresponding structures of the studied compounds.](/image/article/2012/RA/c2ra21853d/c2ra21853d-f4.gif) |
| | Fig. 4 (a) Representative hyperpolarised (θflip = 0.5°) and thermal (θflip = 90°, 16 scans) 13C NMR signals of [1-13C]ethyl acetate (64 mM in methanol) taken at 9.4 T and 298 K. Average NMR enhancement ε = 5300 ± 450; T1 = 45 s. (b) Hyperpolarised (θflip = 1°) and thermal (θflip = 90°, 16 scans) NMR signals of [13C]urea (25.6 mM in water). Average NMR enhancement ε = 3200 ± 520; T1 = 44 s. The insets are the corresponding structures of the studied compounds. | |
3.4 Hyperpolarised 15N compounds in the liquid-state
Nitrogen is another major component of biomolecules, thus an important target nucleus for fast dissolution DNP-NMR. Fig. 5a displays the hyperpolarised and thermal 15N (spin-1/2, γ = 4.3143 MHz T−1) NMR signals of 15N-enriched choline. Choline is an important substrate in the production of cellular phospholipids via the Kennedy pathway38 and hyperpolarised 15N-enriched choline was used to measure choline kinase activity.39 It was shown elsewhere40–43 that in the thermal mixing regime, where the ESR linewidth is greater than or comparable to the nuclear Larmor frequency, two or more nuclei can be polarised at the same microwave irradiation frequency. Since the linewidth of DPPH is larger than the 13C and 15N Larmor frequencies, the expected predominant DNP mechanism for both 13C and 15N DNP with DPPH is thermal mixing. This is corroborated by a previous work43 which shows that the DNP spectra of 13C and 15N nuclei polarised with trityl OX063 almost overlap. Thus, we have polarised the 15N samples at P(+) = 94.02 GHz, the same microwave irradiation frequency used for polarising 13C samples. Due to the long T1 (215 s) of the quarternary 15N in choline in solution, a large NMR signal enhancement (ε = 6300-fold) could be achieved at 9.4 T and 298 K as measured 8 s after dissolution with water. The DPPH free radical could be rapidly removed from the aqueous 15N choline solution using a syringe filter, an important consideration for future in vivo experiments. DPPH can also provide significant 15N NMR signal enhancements for compounds that contain 15N at natural abundance (0.36%) as shown in Fig. 5b. The hyperpolarised 15N NMR spectrum of the pentaerythrityl tetraazide in methanol solution shows three distinct peaks corresponding to the CH2-linked (left peak, T1 = 64 s, ε = 4500), central (middle peak, T1 = 147 s, ε = 5400), and terminal (right peak, T1 = 122 s, ε = 5200) 15N's of the four azide arms which are symmetrically arranged around the pentaerythrityl backbone. As mentioned earlier, a thermal NMR spectrum of this 15N natural abundance compound in mM concentration was difficult to obtain, thus neat 15N natural abundance nitrobenzene was used as the thermal NMR reference signal for the calculation of NMR signal enhancement. Other 15N natural abundance compounds that have been shown to be polarised by DPPH include acetonitrile and pyridine.
![(a) Representative hyperpolarised (θflip = 5°) and thermal (θflip = 90°) 15N NMR signals of [15N]choline (26.7 mM in water) taken at 9.4 T and 298 K. Average NMR enhancement ε = 6300 ± 700; T1 = 215 s. (b) Hyperpolarised (θflip = 90°) and thermal (θflip = 90°, 1 scan) NMR signals of 15N natural abundance pentaerythrityl tetraazide (31 mM in methanol). Average enhancements: (CH2-linked 15N, left peak) ε = 4500 ± 470, T1 = 64 s; (central 15N, middle peak) ε = 5400 ± 510, T1 = 147 s; (terminal 15N, right peak) ε = 5200 ± 380, T1 = 122 s. The insets are the corresponding structures of the studied compounds.](/image/article/2012/RA/c2ra21853d/c2ra21853d-f5.gif) |
| | Fig. 5 (a) Representative hyperpolarised (θflip = 5°) and thermal (θflip = 90°) 15N NMR signals of [15N]choline (26.7 mM in water) taken at 9.4 T and 298 K. Average NMR enhancement ε = 6300 ± 700; T1 = 215 s. (b) Hyperpolarised (θflip = 90°) and thermal (θflip = 90°, 1 scan) NMR signals of 15N natural abundance pentaerythrityl tetraazide (31 mM in methanol). Average enhancements: (CH2-linked 15N, left peak) ε = 4500 ± 470, T1 = 64 s; (central 15N, middle peak) ε = 5400 ± 510, T1 = 147 s; (terminal 15N, right peak) ε = 5200 ± 380, T1 = 122 s. The insets are the corresponding structures of the studied compounds. | |
3.5 Hyperpolarised ultra low-γ compounds in the liquid-state
We have been interested in hyperpolarising ultra low-γ nuclei11,31 such as 89Y (spin-1/2, γ = 2.0864 MHz T−1, 100% natural abundance) and 107,109Ag (107Ag: spin-1/2, 1.723 MHz T−1, 48.17% natural abundance; 109Ag: spin-1/2, 1.9808 MHz T−1, 51.83% natural abundance) because of their extremely long spin lattice relaxation times (up to 500 s). Long T1 values correspond to long lifetimes of the hyperpolarised state, an important attribute for the design of hyperpolarised NMR spectroscopy or imaging probes. Fig. 6a illustrates that DPPH can provide large NMR signal enhancement (ε = 5400-fold) on 89Y-trifluoromethanesulfonate (T1 = 460 s) in aqueous solution. A 3 M aqueous solution of YCl3 was used as the thermal NMR reference signal to estimate the 89Y NMR signal enhancement. DPPH was also compatible with Ag+ although only a modest enhancement of 1300-fold was obtained for 109Ag(crypt-222)OTf (T1 = 95 s) in methanol solution as shown in Fig. 6b.
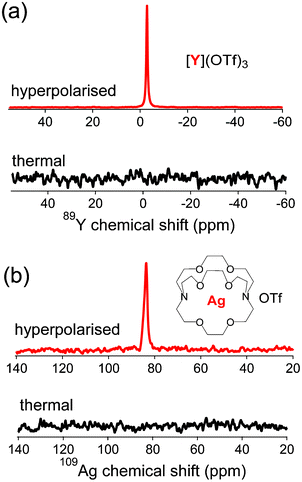 |
| | Fig. 6 (a) Representative hyperpolarised (θflip = 90°) and thermal (θflip = 90°, 1 scan) 89Y NMR spectra of Y(OTf)3 (11.4 mM in water) taken at 9.4 T and 298 K. Average NMR enhancement ε = 5400 ± 600, T1 = 460 s. (b) Hyperpolarised (θflip = 90°) and thermal (θflip = 90°, 1 scan) 109Ag NMR spectra of Ag(crypt-222)OTf (7.7 mM in MeOH). Average NMR enhancement ε = 1300 ± 400, T1 = 95 s. The insets are the corresponding structures of the studied compounds. | |
Conclusions
In conclusion, we have demonstrated that the stable free radical DPPH can be used as a polarising agent for fast dissolution DNP-NMR spectroscopy. The W-band ESR data show that it has a linewidth intermediate between that of carbon-centered BDPA and nitroxide-based TEMPO free radicals. Several thousand-fold NMR signal enhancements have been achieved for 13C, 15N, 89Y, and 109Ag compounds in the liquid state after dissolution, proving that this free radical can be used for the DNP-NMR characterization of a variety of compounds. In addition, the water-insoluble DPPH free radical can be easily removed from the dissolution liquid by filtration when water is used as the solvent.
Acknowledgements
This work is supported by the National Institutes of Health (NIH) grant numbers R21EB009147 and NIBIB RR02584. L.S. acknowledges the support of the National High Magnetic Field Laboratory (NHMFL) UCGP grant no. 5080; C.K. thanks the Department of Defense (W81XWH-12-1-0134) for the financial support. The ESR measurements were done at the NHMFL which is supported by the National Science Foundation (NSF) through the Cooperative Agreement No. DMR-0654118, the U.S. Department of Energy (DOE), and the State of Florida.
References
-
A. Abragam, Principles of Nuclear Magnetism, Oxford University Press, England, 1961 Search PubMed.
- A. Abragam and M. Goldman, Rep. Prog. Phys., 1978, 41, 395 CrossRef CAS.
- W. de Boer, J. Low Temp. Phys., 1976, 22, 185 CrossRef CAS.
- D. G. Crabb and W. Meyer, Annu. Rev. Nucl. Part. Sci., 1997, 47, 67 CrossRef CAS.
- R. A. Wind, M. J. Duijvestijn, C. Van der Lugt, A. Manenchijn and J. Vriend, Prog. Nucl. Magn. Reson. Spectrosc., 1985, 17, 33–67 CrossRef CAS.
- J. H. Ardenkjær-Larsen, B. Fridlund, A. Gram, G. Hansson, L. Hansson, M. H. Lerche, R. Servin, M. Thaning and K. Golman, Proc. Natl. Acad. Sci. U. S. A., 2003, 100, 10158–10163 CrossRef.
- F. A. Gallagher, M. I. Kettunen and K. M. Brindle, Prog. Nucl. Magn. Reson. Spectrosc., 2009, 55, 285 CrossRef CAS.
- J. Kurhanewicz, D. B. Vigneron, K. Brindle, E. Y. Chekmenev, A. Comment, C. H. Cunningham, R. J. DeBerardinis, G. G. Green, M. O. Leach, S. S. Rajan, R. R. Rizi, B. D. Ross, W. S. Warren and C. R. Malloy, Neoplasia, 2011, 13, 81 Search PubMed.
- K. M. Brindle, S. E. Bohndiek, F. A. Gallagher and M. I. Kettunen, Magn. Reson. Med., 2011, 66, 505 CrossRef.
- J. Heckmann, W. Meyer, E. Radtke, G. Reicherz and S. Goertz, Phys. Rev. B, 2006, 74, 134418 CrossRef.
- L. Lumata, A. K. Jindal, M. E. Merritt, C. Malloy, A. D. Sherry and Z. Kovacs, J. Am. Chem. Soc., 2011, 133, 8673–8680 CrossRef CAS.
- L. Lumata, M. E. Merritt, C. R. Malloy, A. D. Sherry and Z. Kovacs, J. Phys. Chem. A, 2012, 116, 5129–5138 CrossRef CAS.
- C. Gebellieri, V. Mugniani, J. C. Paniagua, N. Roques, M. Oliveros, M. Feliz, J. Vecenia and M. Pons, Angew. Chem., Int. Ed., 2010, 49, 3360 CrossRef.
- J. C. Paniagua, V. Mugniani, C. Gabellieri, M. Feliz, N. Roques, J. Veciana and M. Pons, Phys. Chem. Chem. Phys., 2010, 12, 5824 RSC.
- S. Macholl, H. Johannesson and J. H. Ardenkjaer-Larsen, Phys. Chem. Chem. Phys., 2010, 12, 5804 RSC.
- L. Lumata, S. J. Ratnakar, A. Jindal, M. Merritt, C. Malloy, A. D. Sherry and Z. Kovacs, Chem.–Eur. J., 2011, 17, 10825–10827 CrossRef CAS.
- S. Goldschmidt and K. Renn, Ber. Dtsch. Chem. Ges., 1922, 55, 628–643 CrossRef.
- M. J. Ajitha, S. Mohanlal, C. H. Suresh and A. Jayalekshmy, J. Agric. Food Chem., 2012, 60, 3693–3699 CrossRef CAS.
- A. K. Goyal, S. K. Middha and A. Sen, J. Nat. Pharm., 2012, 1, 40–45 Search PubMed.
- H. Izuta, Y. Narahara, M. Shimazawa, S. Mishima, S. Kondo and H. Hara, Biol. Pharm. Bull., 2009, 32, 1947–1951 CAS.
- L. Rackova, M. Oblozinsky, V. Kettmann and L. Bezakova, J. Inflammation, 2007, 4, 15 CrossRef.
- D. Bandoniene, M. Murkovic, W. Pfannhauser, P. R. Venskutonis and D. Gruzdiene, Eur. Food Res. Technol., 2002, 214, 143–147 CrossRef CAS.
- M. Okawa, J. Kinjo, T. Nohara and M. Ono, Biol. Pharm. Bull., 2001, 24, 1202–1205 CAS.
- P. Ionita, Chem. Pap., 2005, 59, 11–16 CAS.
- J. Krzystek, A. Sienkiewicz, L. Pardi and L. C. Brunel, J. Magn. Reson., 1997, 125, 207–211 CrossRef CAS.
- M. Borghini, Phys. Rev. Lett., 1968, 20, 419–421 CrossRef CAS.
- J. Z. Hu, J. Zhou, B. Yang, L. Li, J. Qiu, C. Ye, M. S. Solum, R. A. Wind, R. J. Pugmire and D. M. Grant, Solid State Nucl. Magn. Reson., 1997, 8, 129–137 CrossRef CAS.
- R. D. Bates Jr., B. E. Wagner and E. H. Poindexter, J. Phys. Chem., 1976, 80, 320–323 CrossRef.
- B. Yang, J. Feng, J. Zhou, L. Li, C. Ye, J. Hu, R. J. Pugmire and D. M. Grant, Acta Phys. Sin., 1998, 7, 106–114 CAS.
- J. R. Stewart, J. Chem. Phys., 1971, 54, 492–495 CrossRef CAS.
- L. Lumata, M. E. Merritt, Z. Hashami, S. J. Ratnakar and Z. Kovacs, Angew. Chem., Int. Ed., 2012, 51, 525–527 CrossRef CAS.
- S. Jannin, A. Bornet, S. Colombo and G. Bodenhausen, Chem. Phys. Lett., 2011, 517, 234–236 CrossRef CAS.
- W. Hayes, H. M. I. Osborn, S. D. Osborne, R. A. Rastall and B. Ramagnoli, Tetrahedron, 2003, 59, 7983–7996 CrossRef CAS.
- B. R. Patyal, J. H. Gao, R. F. Williams, J. Roby, B. Saam, B. A. Rockwell, R. J. Thomas, D. J. Stolarski and P. T. Fox, J. Magn. Reson., 1997, 126, 58 CrossRef CAS.
- C. T. Farrar, D. A. Hall, G. J. Gerfen, S. J. Inati and R. G. Griffin, J. Chem. Phys., 2001, 114, 4922 CrossRef CAS.
- S. V. Kolaczkowski, J. T. Cardin and D. E. Budil, Appl. Magn. Reson., 1999, 16, 293–298 CrossRef CAS.
- J. Wolber, F. Ellner, B. Fridlund, A. Gram, H. Johannesson, G. Hansson, L. H. Hansson, M. H. Lerche, S. Mansson, R. Servin, M. Thaning, K. Golman and J. H. Ardenkjaer-Larsen, Nucl. Instrum. Methods Phys. Res., Sect. A, 2004, 526, 173–181 CrossRef CAS.
- E. P. Kennedy and S. B. Weiss, J. Biol. Chem., 1956, 222, 193–214 CAS.
- C. Gabellieri, S. Reynolds, A. Lavie, G. S. Payne, M. O. Leach and T. R. Eykyn, J. Am. Chem. Soc., 2008, 130, 4598–4599 CrossRef CAS.
- W. de Boer, M. Borghini, K. Morimoto, T. O. Niinikoski and F. Udo, J. Low Temp. Phys., 1974, 15, 249 CrossRef CAS.
- S. Reynolds and H. Patel, Appl. Magn. Reson., 2008, 34, 495–508 CrossRef CAS.
- L. Lumata, M. Merritt, C. Malloy, A. D. Sherry and Z. Kovacs, Appl. Magn. Reson., 2012, 43, 69–79 CrossRef CAS.
- I. J. Day, J. C. Mitchell, M. J. Snowden and A. L. Davis, Magn. Reson. Chem., 2007, 45, 1018–1021 CrossRef CAS.
Footnote |
| † Electronic Supplementary Information (ESI) available. See DOI: 10.1039/c2ra21853d |
|
| This journal is © The Royal Society of Chemistry 2012 |
Click here to see how this site uses Cookies. View our privacy policy here.