Hydrothermal synthesis of tin doped ceria-zirconia solid solutions with enhanced thermal stability and oxygen storage capacity†
Qiang
Dong
*,
Shu
Yin
,
Chongshen
Guo
,
Takeshi
Kimura
and
Tsugio
Sato
Institute of Multidisciplinary Research for Advanced Materials, Tohoku University, 2-1-1 Katahira, Aoba-ku Sendai 980-8577, Japan. E-mail: dong@tagen.tohoku.ac.jp; Fax: +81-22-217-5598; Tel: +81-22-217-5599
First published on 18th October 2012
Abstract
A facile hydrothermal synthesis of tin doped ceria-zirconia (Ce0.5Zr0.43Sn0.07O2) solid solutions was carried out using Ce(NH4)2(NO3)6, Zr(NO3)3·2H2O and SnCl4·5H2O as the starting materials. The synthesized Ce0.5Zr0.43Sn0.07O2 particles were characterized for their oxygen storage capacity (OSC) for automotive catalysis applications. For the characterization, X-ray diffraction, transmission electron microscopy and the Brunauer-Emmet-Teller (BET) technique were employed. The OSC values of all samples were measured using thermogravimetric-differential thermal analysis. Ce0.5Zr0.43Sn0.07O2 solid solutions with a BET surface area of 246 m2 g−1 exhibited a considerably high OSC of 1425 μmol-O g−1. The incorporation of tin ions in the lattice of the ceria based catalyst greatly enhanced the thermal stability and OSC. The influence of cation radius on the thermal stability and OSC was also discussed.
1. Introduction
Ceria (CeO2)-based materials have been recognized as an important component of three-way catalysts (TWCs) because of their excellent oxygen storage capacity (OSC).1,2 The major role of ceria-based materials is the OSC and maintaining an air/fuel ratio around 14.7 during engine operation, since TWCs have high pollutant conversion efficiency only under a narrow operation window of the air/fuel ratio.3 Since the 1990s, CeO2–ZrO2 solid solutions have gradually replaced pure CeO2 as OSC materials in TWCs to reduce the emission of toxic pollutants (CO, NOx, hydrocarbons, etc.) from automobile exhausts, because of their enhanced OSC performance and improved thermal stability at elevated temperatures.4–8The redox property of CeO2 can be greatly enhanced by incorporating zirconium ions (Zr4+) into the lattice to form a solid solution.9–11 Nagai et al. have suggested that enhancing the homogeneity of Ce and Zr atoms in the CeO2–ZrO2 solid solutions can improve the OSC performance.12 The detailed structure and property of CeO2–ZrO2 solid solutions were reported in review article by Monte and Kašpar.7 This review included the results of reducing performance for a series of samples with gradually elevated Ce contents, and a possible mechanism of structural changes in the reducing process was proposed. Fornasiero et al. have reported that an optimum composition, like Ce0.5Zr0.5O2 (molar ratio of Ce![[thin space (1/6-em)]](https://www.rsc.org/images/entities/char_2009.gif) :
:![[thin space (1/6-em)]](https://www.rsc.org/images/entities/char_2009.gif) Zr = 1
Zr = 1![[thin space (1/6-em)]](https://www.rsc.org/images/entities/char_2009.gif) :
:![[thin space (1/6-em)]](https://www.rsc.org/images/entities/char_2009.gif) 1) can exist as a cubic phase, which can have a considerably high redox property.13 Using density functional theory, Wang et al. found that in a series of Ce1−xZrxO2 solutions with a content of 50% ZrO2 possess the lowest formation energy of the O vacancy, therefore, Ce0.5Zr0.5O2 exhibits the best OSC performance.14 Recently, many researchers have paid a lot of attention to preparing Ce0.5Zr0.5O2 solutions with a homogeneous composition, good dispersion of particles, narrow particle size distribution, better crystallinity and high surface area in order to improve OSC and redox properties for catalytic applications.15–20
1) can exist as a cubic phase, which can have a considerably high redox property.13 Using density functional theory, Wang et al. found that in a series of Ce1−xZrxO2 solutions with a content of 50% ZrO2 possess the lowest formation energy of the O vacancy, therefore, Ce0.5Zr0.5O2 exhibits the best OSC performance.14 Recently, many researchers have paid a lot of attention to preparing Ce0.5Zr0.5O2 solutions with a homogeneous composition, good dispersion of particles, narrow particle size distribution, better crystallinity and high surface area in order to improve OSC and redox properties for catalytic applications.15–20
Although Ce0.5Zr0.5O2 solid solutions have been studied extensively, there are few reports on the preparation of Ce0.5Zr0.5−xMxO2 in the literature. SnO2 has been widely used as an oxidation catalyst as it can reversibly undergo the Sn4+ ⇔ Sn2+ reaction at relatively lower temperatures.21,22 Sasikala et al. have reported the preparation of Ce1−xSnxO2 by a co-precipitation method and they observed low surface area for the as-prepared Ce1−xSnxO2 with low oxidation/reduction temperature.22 Through a single step solution combustion method using tin oxalate precursor, Ce1−xSnxO2 solid solutions have been prepared, which show high oxygen storage capacity compared to Ce1−xZrxO2, however, the Ce0.8Sn0.2O2 solid solution is only stable up to 700 °C in air.23 Considering the smaller cation radius (eight-coordination) of Sn4+ (0.081 nm) than those of Zr4+ (0.084 nm) and Ce4+ (0.097 nm),24 the incorporation of Sn4+ into Ce–Zr solid solutions may enhance the oxygen release reaction to form larger Ce3+.25 In the present work, we describe the preparation and characterization of Ce0.5Zr0.43Sn0.07O2 solid solutions with high surface area via a facile hydrothermal route. Further experimental results show that introducing tin ions enhances the thermal stability and OSC even after calcination at 1000 °C for 20 h. The OSC of CeO2 and Ce0.5Zr0.5O2 prepared via the same method is compared.
2. Experimental
All chemicals used were of analytical grade and were purchased from Kanto Chemical Co. Inc., Japan (purity 99.999%). The chemicals were used without further purification.2.1 Catalysts preparation
The stoichiometric amounts of (NH4)2Ce(NO3)6 (6 mmol), ZrO(NO3)2 (4.8 mmol) and SnCl4·5H2O (1.2 mmol) were dissolved in 60 ml distilled water. NH4OH solution was slowly dropped into the above mixed solution, and the pH value was maintained at 9. The yellow mixed solution was introduced in a 100 ml Teflon®-lined autoclave, which was maintained at 200 °C for 24 h, then cooled to room temperature naturally. The obtained products were washed with distilled water three times, and dried in air at 100 °C for 12 h to form the as-prepared fresh samples. Finally, the fresh samples were calcined at 1000 °C for 20 h in air atmosphere to evaluate the thermal stability. The same synthesis route was employed for the preparation of the CeO2 and Ce0.5Zr0.5O2.2.2 OSC analysis
The OSC of fresh samples and calcined samples at 1000 °C for 20 h was determined using a thermogravimetric-differential thermal analysis (TG-DTA, Rigaku TAS-200). Before the measurement, the samples were held in flowing air at 600 °C for 30 min to remove residual water and other volatile gases. The mixed gas of H2–N2 (H2, 17.1%), (100 cm3 min−1) and air (100 cm3 min−1) was flowed alternatively at 600 °C. Finally OSC was analyzed after getting the TGA profile.2.3 Characterization
The phase composition of the sample was determined by X-ray diffraction analysis (XRD, Shimadzu XD-D1) using graphite-monochromized Cu-Kα radiation. The morphology and size of the samples were determined by a transmission electron microscopy (TEM, JEOL JEM-2010). The specific surface area was measured using a BET (NOVA 4200e) surface area and pore size analyzer. The element analysis of the sample was carried out by an inductively coupled plasma atomic emission spectrometry measurement (ICP-AES, SPECTRO ARCOS EOP) after dissolving the sample by an acid digestion method. The sample shows the composition of Ce/Zr/Sn = 0.5![[thin space (1/6-em)]](https://www.rsc.org/images/entities/char_2009.gif) :
:![[thin space (1/6-em)]](https://www.rsc.org/images/entities/char_2009.gif) 0.43
0.43![[thin space (1/6-em)]](https://www.rsc.org/images/entities/char_2009.gif) :
:![[thin space (1/6-em)]](https://www.rsc.org/images/entities/char_2009.gif) 0.07.
0.07.
3. Results and discussion
All products of (a) CeO2, (b) Ce0.5Zr0.5O2 and (c) Ce0.5Zr0.43Sn0.07O2, consisted of single phase of fluorite structure (Fig. 1(a)–(c)). All the diffraction patterns exhibited broad peaks suggesting that fresh samples were nanocrystalline materials. No phase separation was noticed even at such high calcination temperatures of 1000 °C for 20 h, except the increase of particle size (Fig. 1(a′)–(c′)). The crystal sizes of fresh CeO2, Ce0.5Zr0.5O2 and Ce0.5Zr0.43Sn0.07O2 calculated by Scherer's formula were 9, 5 and 3 nm, while those of calcined CeO2, Ce0.5Zr0.5O2 and Ce0.5Zr0.43Sn0.07O2 were 35, 10 and 8 nm, respectively. The calcined samples had a slight shift in diffraction peaks when compared to the pure CeO2 XRD pattern. This shows the formation of the corresponding solid solutions. The calculated lattice parameters of the calcined samples of Ce0.5Zr0.5O2 (a = 0.5384 nm) and Ce0.5Zr0.43Sn0.07O2 (a = 0.5371 nm) are smaller than that of CeO2 (a = 0.5413 nm). The shrinkage of lattice cells may be due to the substitution of smaller cation radius of Zr4+ (0.084 nm) and Sn4+ (0.081 nm) with Ce4+ (0.097 nm).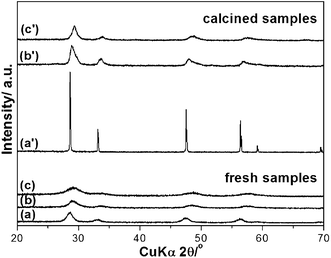 | ||
| Fig. 1 XRD patterns of fresh samples (a) CeO2, (b) Ce0.5Zr0.5O2, (c) Ce0.5Zr0.43Sn0.07O2, and calcined samples (a′) CeO2, (b′) Ce0.5Zr0.5O2 and (c′) Ce0.5Zr0.43Sn0.07O2. | ||
The morphology and size of the fresh and calcined samples (1000 °C for 20 h) were observed by TEM as shown in Fig. 2. For fresh samples, the particles seem to be partly dispersed and formed small agglomerates (Fig. 2(a)–(c)), and single particles exhibited a spherical-like morphology with diameters of 9–12 nm, 5–8 nm and 3–5 nm for CeO2, Ce0.5Zr0.5O2 and Ce0.5Zr0.43Sn0.07O2, respectively, which are in agreement with the crystallite size calculated from Scherer's formula. The particle size increased after calcination at 1000 °C for 20 h because of aggregation, and the particle sizes were found to increase to 90–100 nm, 50–55 nm and 30–35 nm for the CeO2, Ce0.5Zr0.5O2 and Ce0.5Zr0.43Sn0.07O2 samples as shown in Fig. 2(a′)–(c′), respectively.
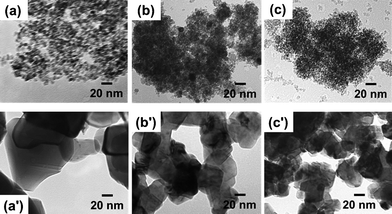 | ||
| Fig. 2 TEM images of fresh samples (a) CeO2, (b) Ce0.5Zr0.5O2, (c) Ce0.5Zr0.43Sn0.07O2, and calcined samples (a′) CeO2, (b′) Ce0.5Zr0.5O2 and (c′) Ce0.5Zr0.43Sn0.07O2. | ||
BET nitrogen adsorption-desorption analysis was undertaken to measure the specific surface area of all samples. As a result, the fresh sample of Ce0.5Zr0.43Sn0.07O2 showed much higher surface area (246 m2 g−1) than that of CeO2 (119 m2 g−1) and Ce0.5Zr0.5O2 (168 m2 g−1, Fig. 3(a)–(c)). After calcination at 1000 °C for 20 h in air the specific surface areas of CeO2 (3 m2 g−1) and Ce0.5Zr0.5O2 (8 m2 g−1) decreased to less than 10 m2 g−1, but the sample of Ce0.5Zr0.43Sn0.07O2 exhibited a relatively high BET specific surface area of 24 m2 g−1 (Fig. 3(a′)–(c′)).
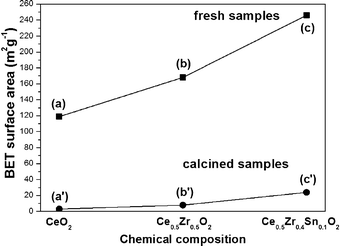 | ||
| Fig. 3 BET specific surface areas of fresh samples (a) CeO2, (b) Ce0.5Zr0.5O2, (c) Ce0.5Zr0.43Sn0.07O2, and calcined samples (a′) CeO2, (b′) Ce0.5Zr0.5O2 and (c′) Ce0.5Zr0.43Sn0.07O2. | ||
The OSC values of fresh samples and the calcined samples were determined at 600 °C with a continuous flow of H2–N2 gas and air alternately.26,27Fig. 4 shows the typical TG profiles of the CeO2, Ce0.5Zr0.5O2 and Ce0.5Zr0.43Sn0.07O2 samples. The TG profile shows the oxygen release/storage performance of the CeO2, Ce0.5Zr0.5O2 and Ce0.5Zr0.43Sn0.07O2 samples at 600 °C with time. As a result, Ce0.5Zr0.43Sn0.07O2 exhibited the higher OSC of 1425 μmol-O g−1, when compared to that of CeO2 (84 μmol-O g−1) and Ce0.5Zr0.5O2 (721 μmol-O g−1) sample (Table 1). It is accepted that the OSC is dependent on the specific surface area, it is obvious that Ce0.5Zr0.43Sn0.07O2 exhibited the highest specific surface area and highest OSC values. Considering platinum pan was used in TG-DTA, the pan could not contribute to OSC even at high temperatures. Therefore, the highest OSC value of 1425 μmol-O g−1 is close to the theoretical maximum value of OSC (1710 μmol-O g−1).
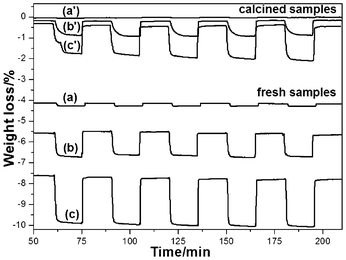 | ||
| Fig. 4 TG profiles of fresh and calcined samples (1000 °C, 20 h) at 600 °C, which show oxygen release/storage properties. Fresh samples: (a) CeO2, (b) Ce0.5Zr0.5O2 and (c) Ce0.5Zr0.43Sn0.07O2. Calcined samples: (a′) CeO2, (b′) Ce0.5Zr0.5O2 and (c′) Ce0.5Zr0.43Sn0.07O2. | ||
| Chemical composition | OSC of fresh samples (μmol-O g−1) | OSC of calcined samples (μmol-O g−1) |
|---|---|---|
| CeO2 | 84 | 13 |
| Ce0.5Zr0.5O2 | 721 | 449 |
| Ce0.5Zr0.43Sn0.07O2 | 1425 | 1067 |
| Ce0.5Zr0.4Ti0.1O2 | 906 | 339 |
| Ce0.5Zr0.4Fe0.05Nb0.05O2 | 1112 | 654 |
The OSC of the CeO2, Ce0.5Zr0.5O2 and Ce0.5Zr0.43Sn0.07O2 samples decreased after calcination at 1000 °C for 20 h to 13 μmol-O g−1, 449 μmol-O g−1 and 1067 μmol-O g−1 (Table 1), respectively. The decrease in OSC is due to the increase in particle size and decrease in BET surface area because of the sustained high temperature calcination. In order to examine the OSC performance and stability, oxygen release/storage cycles were measured, and Ce0.5Zr0.43Sn0.07O2 retained the same OSC value and the specific surface area (23 m2 g−1) even after 118 cycles (Fig. S1†). These results indicate that Ce0.5Zr0.43Sn0.07O2 has good OSC performance stability. Moreover, compared with Fig. 2(c) and (c′), the size increased to 9–12 nm for the fresh samples of Ce0.5Zr0.43Sn0.07O2 (Fig. S2(a)†), however, calcined samples (1000 °C for 20 h) kept almost the same morphology and size after treating at 600 °C for 20 h (Fig. S2(b)†).
Recently, incorporating tin into CeO2 has been reported to improve the redox property and oxygen storage capacity at low temperatures.28–30 As the cation radius of Sn4+ (0.077 nm) is smaller than both of Zr4+ (0.084 nm) and Ce4+ (0.097 nm), the incorporation of Sn4+ into Ce–Zr solid solutions may enhance the oxygen release reaction to form larger Ce3+. In the present work, higher surface area is exhibited by Ce0.5Zr0.43Sn0.07O2 solid solutions both before calcination and after calcination compared with Ce0.5Zr0.5O2. The experimental results show that the incorporation of tin ions into Ce–Zr solid solutions also enhances the thermal stability. The Ce0.5Zr0.43Sn0.07O2 solid solutions show considerably higher oxygen storage capacity than Ce0.5Zr0.5O2. The enhanced OSC is not only due to the high surface area but also due to the involvement of Ce4+/Ce3+ and Sn4+/Sn2+ redox couples utilized for H2 oxidation.23 It is proposed that SnO2, being easily reducible, gives out its lattice oxygen for the oxidation reaction, which possibly gets rejuvenated by subtracting oxygen from the adjacent CeO2 molecules.22
Other cations, such as Fe3+ (0.078 nm), Nb5+ (0.074 nm) and Ti4+ (0.074 nm), whose radii are also smaller than both of Zr4+ and Ce4+,24 could also enhance the OSC by incorporating into Ce–Zr solid solutions as shown in Fig. 5 and Table 1. Nb has a similar cation radius to that of Fe. It is better to balance the valency by adding Nb compared to the case of Fe3+ only. It is accepted that Fe3+ might be obtained under hydrothermal treatment conditions, because usually hydrothermal reactions provide an oxidative environment.31,32 The relationship between OSC and cation radius is summarized in Fig. 6. It is indicated that incorporating cation with the radius from 0.074 to 0.084 nm into Ce–Zr solid solutions could enhance the OSC. The OSC (Fig. 5) can be greatly improved by incorporating Sn4+ compared to other cations such as Ti4+, Nb5+ and Fe3+. It was found that the samples incorporating Ti4+, Nb5+ and Fe3+ caused phase separation after calcination at 1000 °C for 20 h as shown in Fig. 7, which resulted in low thermal stability. It was indicated that these cations are too small to stabilize the fluorite structure of Ce–Zr solid solutions. The fresh samples exhibited high specific surface areas, however, they decreased to less than 10 m2 g−1 after calcination as shown in Fig. 8. Therefore, the radius of the incorporated cation might be an important factor which affects thermal stability.
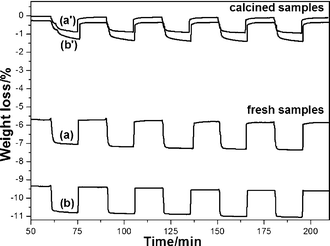 | ||
| Fig. 5 TG profiles after measuring the OSC at 600 °C for fresh and calcined samples (1000 °C, 20 h), which show oxygen release/storage properties. Fresh samples: (a) Ce0.5Zr0.4Ti0.1O2 and (b) Ce0.5Zr0.4Fe0.05Nb0.05O2. Calcined samples: (a′) Ce0.5Zr0.4Ti0.1O2 and (b′) Ce0.5Zr0.4Fe0.05Nb0.05O2. | ||
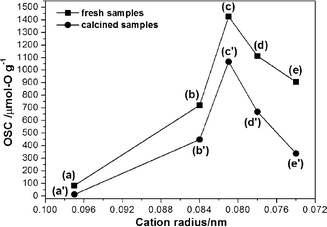 | ||
| Fig. 6 The relationship between OSC and incorporating cation radius. For fresh samples: (a) CeO2, (b) Ce0.5Zr0.5O2, (c) Ce0.5Zr0.43Sn0.07O2, (d) Ce0.5Zr0.4Fe0.05Nb0.05O2 and (e) Ce0.5Zr0.4Ti0.1O2. For calcined samples: (a′) CeO2, (b′) Ce0.5Zr0.5O2, (c′) Ce0.5Zr0.43Sn0.07O2, (d′) Ce0.5Zr0.4Fe0.05Nb0.05O2 and (e′) Ce0.5Zr0.4Ti0.1O2. | ||
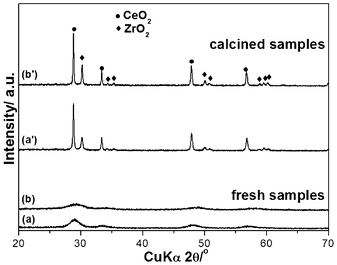 | ||
| Fig. 7 XRD patterns of fresh samples (a) Ce0.5Zr0.4Ti0.1O2 and (b) Ce0.5Zr0.4 Fe0.05Nb0.05O2, and calcined samples (a′) Ce0.5Zr0.4Ti0.1O2 and (b′) Ce0.5Zr0.4 Fe0.05Nb0.05O2. | ||
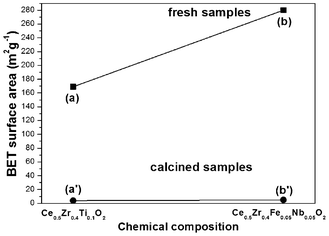 | ||
| Fig. 8 BET specific surface areas of fresh samples (a) Ce0.5Zr0.4Ti0.1O2 and (b) Ce0.5Zr0.4Fe0.05Nb0.05O2, and calcined samples (a′) Ce0.5Zr0.4Ti0.1O2 and (b′) Ce0.5Zr0.4Fe0.05Nb0.05O2. | ||
4. Conclusions
Ce0.5Zr0.43Sn0.07O2 solid solutions with high surface area were successfully synthesized via a facile hydrothermal method. The structures of the fresh samples and calcined samples were characterized by X-ray diffraction. The lattice parameters of Ce0.5Zr0.43Sn0.07O2 solid solution are smaller than those of CeO2 and Ce0.5Zr0.5O2, suggesting the incorporation of Sn4+ into the Ce–Zr solid solutions. The fresh particles showed a spherical-like morphology with diameters of 3–5 nm determined by TEM. Ce0.5Zr0.43Sn0.07O2 solid solutions exhibited a remarkably higher oxygen storage capacity than CeO2 and Ce0.5Zr0.5O2 samples prepared via the same method, even after calcination at 1000 °C for 20 h, indicating the improvement of the OSC and thermal stability due to the incorporation of tin. An appropriate radius range of the incorporating cation is also suggested.Acknowledgements
This work was partly supported by Rare Metal Substitute Materials Development Project of New Energy and Industrial Technology Development Organization (NEDO), Japan and the Management Expenses Grants for National Universities Corporations from the Ministry of Education, Culture, Sports and Science for Technology of Japan (MEXT).References
- H. S. Gandhi, A. G. Piken, M. Shelef and R. G. Delosh, SAE Paper, 1976, 55, 760201 Search PubMed.
- X. Wu, X. Wu, Q. Liang, J. Fan, D. Z. Weng Xie and S. Wei, Solid State Sci., 2007, 9, 636 CrossRef CAS.
- J. Kašpar, P. Fornasiero and N. Hickey, Catal. Today, 2003, 77, 419 CrossRef.
- J. Kašpar, P. Fornasiero and M. Graziani, Catal. Today, 1999, 50, 285 CrossRef.
- J. Kašpar and P. Fornasiero, J. Solid State Chem., 2003, 171, 19 CrossRef.
- R. Di Monte and J. Kašpar, Catal. Today, 2005, 100, 27 CrossRef CAS.
- R. Di Monte and J. Kašpar, J. Mater. Chem., 2005, 15, 633 RSC.
- P. Fornasiero, G. Balducci, R. Di Monte, J. Kašpar, V. Sergo, G. Gubitosa, A. Ferrero and M. Graziani, J. Catal., 1996, 164, 173 CrossRef CAS.
- M. H. Yao, R. J. Baird, F. W. Kunz and T. E. Hoost, J. Catal., 1997, 166, 67 CrossRef CAS.
- K. Kenevey, F. Valdivieso, M. Soustelle and M. Pijolat, Appl. Catal., B, 2001, 29, 93 CrossRef CAS.
- F. Zhang, C. H. Chen, J. C. Hanson, R. D. Robinson, I. P. Herman and S. W. Chan, J. Am. Ceram. Soc., 2006, 89, 1028 CrossRef CAS.
- T. Nagai, T. Nonaka, A. Suda and M. Sugiura, R&D Rev. Toyota CRDL, 2002, 37, 20 Search PubMed.
- P. Fornasiero, R. Di Monte, G. R. Rao, J. Kašpar, S. Meriani, A. Trovarelli and M. Graziani, J. Catal., 1995, 151, 168 CrossRef CAS.
- H. F. Wang, X. Q. Gong, Y. L. Guo, Y. Guo, G. Z. Lu and P. Hu, J. Phys. Chem. C, 2009, 113, 10229 CAS.
- T. Taniguchi, T. Watanabe, N. Matsushita and M. Yoshimura, Eur. J. Inorg. Chem., 2009, 2054 CrossRef CAS.
- M. K. Devaraju, X. W. Liu, K. Yusuke, S. Yin and T. Sato, Nanotechnology, 2009, 20, 405606 CrossRef CAS.
- M. Sanchez-Domingueza, L. F. Liotta, G. D. Carlod, G. Pantaleob, A. M. Veneziab, C. Solansa and M. Boutonnet, Catal. Today, 2010, 158, 35 CrossRef.
- R. O. Fuentes and R. T. Baker, J. Phys. Chem. C, 2009, 113, 914 CAS.
- J. O. Yang and H. M. Yang, J. Phys. Chem. C, 2009, 113, 6921 Search PubMed.
- M. L. Teng, L. T. Luo and X. M. Yang, Microporous Mesoporous Mater., 2009, 119, 158 CrossRef CAS.
- A. Boulahouache, G. Kons, H. G. Lintz and P. Schulz, Appl. Catal., A, 1992, 91, 115 CrossRef CAS.
- R. Sasikala, N. M. Gupta and S. K. Kulshreshtha, Catal. Lett., 2001, 71, 69 CrossRef CAS.
- T. Baidya, A. Gupta, P. A. Deshpandey, G. Madras and M. S. Hegde, J. Phys. Chem. C, 2009, 113, 4059 CAS.
- R. D. Shannon, Acta Crystallogr., Sect. A: Cryst. Phys., Diffr., Theor. Gen. Crystallogr., 1976, 32, 751 CrossRef.
- Q. Dong, S. Yin, C. S. Guo and T. Sato, Catal. Sci. Technol., 2012 10.1039/C2CY20425H.
- D. Y. Wang, Y. J. Kang, V. Doan-Nguyen, J. Chen, R. KÜngas, N. L. Wieder, K. Bakhmutsky, R. J. Gorte and C. B. Murray, Angew. Chem., Int. Ed., 2011, 50, 4378 CrossRef CAS.
- J. Zhang, H. Kumagai, K. Yamamura, S.. Ohara, S. Takami, A. Morikawa, H. Shinjoh, K. Kaneko, T. Adschiri and A. Suda, Nano Lett., 2011, 11, 361 CrossRef CAS.
- R. Lin, Y. J. Zhong, M. F. Luo and W. P. Liu, Indian J. Chem., 2001, 40A, 36 CAS.
- T. B. Nguyen, J. P. Deloume and V. Perrichon, Appl. Catal., A, 2003, 249, 273 CrossRef CAS.
- Y. Z. Chen, B. J. Liaw and C.W. Huang, Appl. Catal., A, 2006, 302, 168 CrossRef CAS.
- M. T. Liang, S. H. Wang, Y. L. Chang, H. I. Hsiang, H. J. Huang, M. H. Tsai, W. C. Juan and S. F Lu, Ceram. Int., 2010, 36, 1131 CrossRef CAS.
- J. Zhang, X. L. Wang, X. H. Xia, C. D. Gu and J. P. Tu, Sol. Energy Mater. Sol. Cells, 2011, 95, 2107 CrossRef CAS.
Footnote |
| † Electronic supplementary information (ESI) available: See DOI: 10.1039/c2ra21766j |
| This journal is © The Royal Society of Chemistry 2012 |
