Dithienylthienothiadiazole-based organic dye containing two cyanoacrylic acid anchoring units for dye-sensitized solar cells
G. D.
Sharma
*a,
J. A.
Mikroyannidis
*b,
M. S.
Roy
c,
K. R. Justin
Thomas
d,
R. J.
Ball
e and
Rajnish
Kurchania
f
aR & D Centre for Engineering and Science JEC Group of Colleges, JEC Campus, Kukas, Jaipur (Raj), 303101, India. E-mail: sharmagd_in@yahoo.com
bChemical Technology Laboratory, Department of Chemistry, University of Patras, GR 26500, Patras, Greece. E-mail: mikroyan@chemistry.upatras.gr
cDefence Laboratory, Jodhpur (Raj), 342011, India
dOrganic Materials Laboratory, Department of Chemistry, Indian Institute of Technology, Roorkee, 247667, Uttrakhand, India
eDepartment of Architecture and Civil Engineering, University of Bath, Bath, BA2 7AY, UK
fDepartment of Physics, Maulana Azad National Institute of Technology (MANIT), 462051, Bhopal (MP(, India
First published on 25th September 2012
Abstract
A new dithienylthienothiadiazole-based organic dye (D) was synthesized by a seven-step synthetic route for use as a sensitizer in dye sensitized solar cells (DSSCs). The dye contains a dithienylthienothiadiazole central unit and two cyanoacrylic acid anchoring side groups. Optical and electrochemical properties of D were evaluated. In addition, density functional theory (DFT) and time dependent density functional theory (TD-DFT) calculations were carried out. A favorable electronic excitation from the highest occupied molecular orbital (HOMO) to the lowest unoccupied molecular orbital (LUMO) indicated that the dye can be used as a sensitizer for DSSC applications. The photovoltaic properties of laboratory scale optimized DSSCs sensitized with D showed a power conversion efficiency (PCE) of 4.22%, which was further improved to 5.47% upon the addition of chenodeoxylic acid (CDCA) as a coadsorbant.
Introduction
Since the seminal work reported in 1991 by O'Regan and Grätzel, dye sensitized solar cells (DSSCs) manufactured from mesoporous anatase TiO2 electrodes have received much attention because they represent a promising alternative to conventional solar cells based on silicon.1 DSSCs based on polypyridyl Ru complexes have been reported with a high point contact concentrator (PCC) of almost 12% under standard AM1.5 sunlight irradiation.2 Although polypyridyl Ru dyes have a high power conversion efficiency (PCE) and long-term stability, the large scale application of these dyes has become a critical problem due to limited resources and the costly purification steps required for their manufacture.3 Fortunately, metal-free dyes could provide a competitive alternative to polypyridyl Ru-based dyes due to their facile modification, high molar coefficient, relatively inexpensive preparation and straightforward compliance with environmentally friendly guidelines.2c,3 These attributes also make them ideal for solid state DSSCs, utilizing thinner TiO2 layers. In particular, it is encouraging to note that a promising photon-to-current conversion efficiency of up to 10.3% has been achieved by Wang et al.4 A common strategy in the design of highly efficient metal-free dyes for DSSCs is linking the electron donor and acceptor (D–A) systems through the π-conjugated bridges. Commonly referred to as D-π-A dyes, these systems have been found to possess photoinduced intramolecular charge transfer (ICT) properties,2c,3 making them suitable for DSSC applications. In recent years, the design and synthesis of D-π-A metal free organic dyes with various donor moieties such as coumarin,5 indoline,6 triarylamine,7 porphyrin,8 squaraine9 and amine free heterocycles10 has led to a number of efficient sensitizers for DSSCs.Organic dyes generally suffer due to their relatively narrow absorption spectra with very poor absorption in the longer wavelength region. However, to realize large photocurrent responses, a sensitizer must possess a broad absorption extending to the near infrared (NIR) region and the absorption spectrum should overlap with the solar emission spectrum to a large extent. In addition to this, the lowest unoccupied molecular orbital (LUMO) of the dye should lie above the conduction band edge of the TiO2 semiconductor electrode to favor electron injection in the conduction band of TiO2. Additionally, the occurrence of the highest occupied molecular orbital (HOMO) of the dye matching with the redox potential of the electrolyte (iodide/tri-iodide) will ensure the regeneration of the dye. Several attempts have been made to fine-tune the above properties in the organic dyes.7–10
It was reported by Won et al.11 that the DSSC based on terthiophene containing organic dye with two anchoring acceptor groups exhibited a higher PCE than its counterpart having one anchoring group. The higher PCE observed in the former dye was attributed to the increased amount of dye adsorbed on to the photoanode surface and the presence of extended conjugation which reinforced electron transfer in terms of Jsc. Similar results were reported by Park et al.,12 for organic dyes with a double electron acceptor anchoring groups on the phenothiazine framework. Yang et al. have recently found that dyes based on carbazole and two acceptor anchoring groups (rhodanine-3-acetic acid) are better than the corresponding dye with a single anchoring group. This was attributed to the beneficial retardation of back electron transfer from TiO2 to the oxidized dye or electrolyte, and enhancement in the charge transfer efficiency in the excited state.13
In search of new metal-free sensitizers for DSSCs, we have synthesized a new organic dye (D) featuring two cyanoacrylic acid anchoring groups bridged by a low band gap chromophore, dithienylthienothiadiazole (Fig. 1). Dye D showed a broad absorption band which extended up to approximately 750 nm. The additional acceptor anchoring group in the sensitizer induced a significant influence on the DSSC performance. In particular, the presence of the two anchoring groups is an advantageous feature of dye D, which increased its binding strength on TiO2. We have investigated the effect of the TiO2 film thickness on the photoanode and found that the PCE increases from 2.75 to 4.22% as thickness increases from 8 to 12 μm. Any further increase in the TiO2 film thickness was found to decrease the PCE. The increase in the PCE has been explained with the help of electrochemical impedance spectra (EIS) measurements. The overall PCE value of the optimized DSSCs (12 μm TiO2 film thickness) sensitized with D was 4.22%, which was further improved to 5.47% following the addition of chenodeoxylic acid (CDCA) as a coadsorbant.
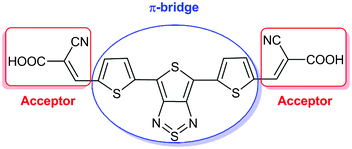 | ||
| Fig. 1 Chemical structure of dye D. | ||
Experimental
Characterization methods
IR spectra were recorded on a Perkin-Elmer 16PC FT-IR spectrometer with KBr pellets. 1H NMR (400 MHz) spectra were obtained using a Bruker spectrometer. Chemical shifts (δ values) are given in ppm with tetramethylsilane as an internal standard.Synthesis of dye D
A flask was charged with a solution of 6 (see Scheme 1) (0.1202 g, 0.392 mmol) and 2-cyanoacetic acid (0.2000 g, 2.353 mmol) in glacial acetic acid (20 mL). A catalytic amount of ammonium acetate was added to this solution. The solution was stirred and refluxed for 24 h under N2. The colour of the solution turned red gradually during the heating period. The solution was subsequently concentrated under reduced pressure. Water containing a few drops of hydrochloric acid was added to the concentrate. The precipitate was filtered and washed with water. The crude product was purified via silica gel column chromatography to afford a solid with a yield of 0.11 g (57%).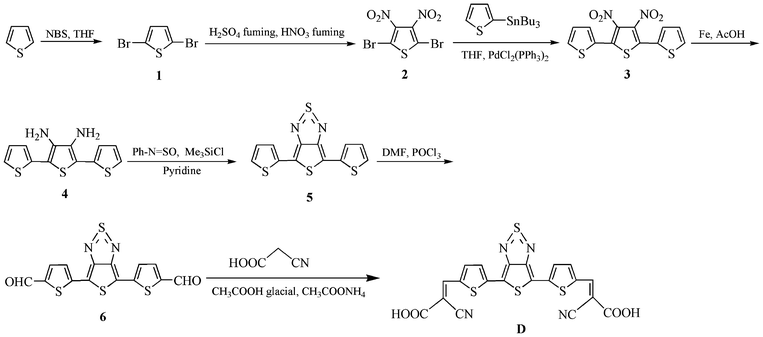 | ||
| Scheme 1 Synthesis of dye D. | ||
FT-IR (KBr, cm−1): 3500–2800 (OH stretching of carboxylic acid); 2210 (C![[triple bond, length as m-dash]](https://www.rsc.org/images/entities/char_e002.gif) N); 1690 (C
N); 1690 (C![[double bond, length as m-dash]](https://www.rsc.org/images/entities/char_e001.gif) O of carboxylic acid).
O of carboxylic acid).
1H-NMR (DMSO-d6) ppm: 8.37 (s, 2H, vinylene); 7.04–6.98 (m, 4H, thiophene). The carboxylic protons were unobserved.
Anal. Calcd for C20H8N4O4S4: C, 48.38; H, 1.62; N, 11.28. Found: C, 47.86; H, 1.90; N, 11.12.
Electrochemical and optical properties
Electrochemical properties of the porphyrin dyes were investigated by cyclic voltammetry (CV) to obtain the HOMO and LUMO levels. The cyclic voltammogram curves were obtained from a three electrode cell in 0.1 M Bu4NPF6 acetonitrile solution at a scan rate of 50 mV s−1. The dye coated TiO2 working electrode, the Pt wire counter electrode and an Ag/AgCl reference electrode were calibrated with ferrocene. All the measured potentials were converted to the NHE (normal hydrogen electrode) scale. The UV-visible absorption spectra of the dye in solution, and adsorbed onto a TiO2 film, were recorded using a Shimadzu UV-spectrophotometer.Computational methods
We have performed theoretical calculations, to understand the electronic structure of dye D and to elucidate the origin of possible vertical transitions using the Gaussian 09W14 (Revision-A.02) program suite. The geometries of the dyes in a vacuum were optimized using density functional theory (DFT) 15 calculations with the hybrid B3LYP16 density function and the 6-31G** basis set. All optimized geometries were subjected to vibrational analysis, and characterized as a minimum due to the absence of imaginary frequencies. At least 20 vertical excitations to the excited state of the dyes were determined with time-dependent DFT (TD-DFT)17 calculations using B3LYP or MPW1K18 density functions. The computations in dimethyl sulfoxide (DMSO) were performed by applying a polarizable continuum model (PCM) employing the integral equation formalism variant (IEFPCM) to describe the electrostatic solute–solvent interactions by the creation of a solute cavity via a set of overlapping spheres.19 The absorption spectra were simulated by using the 20 lowest spin-allowed singlet transitions, mixed Lorentzian-Gaussian lineshape (0.5) and an average full-width at half maximum (3000 cm−1) for all peaks.20Fabrication of DSSCs and characterization
The dye sensitized TiO2 electrode was prepared using the following method: TiO2 paste was prepared by mixing 1 g of TiO2 powder (P25, Degussa, with a crystal structure of 20% rutile and 80% anatase, and a particle size of 20 nm), 0.2 mL of acetic acid and 1 mL of water. Then 60 mL of ethanol was slowly added while sonicating the mixture for 3 h. Finally, Triton X-100 was added and a well dispersed colloidal paste was obtained (TiO2). The whole procedure is slow under vigorous stirring. The mixture was stirred vigorously for 2–4 h at room temperature and then stirred for 4 h at 100 °C to form a transparent colloidal paste. The TiO2 paste was deposited on the fluorine-doped tin oxide (FTO) coated glass substrates by the doctor blade technique. The TiO2 coated FTO films were sintered at 450 °C for 30 min. Before immersing the TiO2 photoanodes into dye solution, these films were soaked in the 0.2 M aqueous TiCl4 solution for 12 h and washed with deionized water and fully rinsed with ethanol. The films were again heated at a temperature of 450 °C, followed by cooling to room temperature and dipping into a 5 × 10⁻⁴ M solution of dye D in DMSO for 12 h at room temperature. To study the effects of chenodeoxylic acid (CDCA) as a coadsorbant on the performance of DSSCs, 10 mM of CDCA was added into the dye solution and then the TiO2 photoanode was dipped into the solution.The Pt counter electrodes were prepared by spin-coating drops of H2PtCl6 solution onto FTO glass before heating at 350 °C for 15 min. To prevent a short circuit, two electrodes were assembled into a sandwich-type cell with a 20 μm thick spacer. One drop of electrolyte solution LiI (0.05 M), I2 (0.5 M), dimethyl-propyl-benzimidiazole iodide (DPMII) (0.6 M), and 4-tert-butylpyridine (TBP) (0.5 M) in acetonitrile solution was deposited onto the surface of the dye-sensitized TiO2 electrode and allowed to penetrate inside the TiO2via capillary action. The Pt coated FTO electrode was then clipped onto the top of the TiO2 working electrode to form the complete DSSC.
The current density–voltage characteristics (J–V) of the devices in darkness and under illumination were measured using a Keithley source meter. A xenon light source coupled with an optical filter provided irradiance (AM 1.5) of 100 mW cm−2 at the device surfaces. Photoaction spectra were measured using a monochromator (Spex 500 M, USA) and the resultant photocurrent with a Keithley electrometer (model 6514) was interfaced to a computer with LABVIEW software. The electrochemical impedance spectra (EIS) measurements were carried out by applying a bias equivalent to the open circuit voltage (Voc) of the device and recorded over a frequency of 10 mHz to 105 Hz with an ac amplitude of 10 mV. The above measurements were recorded with an electrochemical impedance analyser equipped with a frequency response analyser (FRA).
Results and discussion
Synthesis of dye D
Scheme 1 outlines the synthesis of D and its intermediate compounds. In particular, the synthesis of compounds 1–6 has been described in our previous publication.21 Dye D was prepared by the addition of dialdehyde 6 to an excess of 2-cyanoacetic acid (mol ratio 1![[thin space (1/6-em)]](https://www.rsc.org/images/entities/char_2009.gif) :
:![[thin space (1/6-em)]](https://www.rsc.org/images/entities/char_2009.gif) 6) in glacial acetic acid in the presence of a catalytic amount of ammonium acetate. D was characterized by FT-IR and 1H-NMR spectroscopy.
6) in glacial acetic acid in the presence of a catalytic amount of ammonium acetate. D was characterized by FT-IR and 1H-NMR spectroscopy.
Theoretical computations
The computed vertical excitation and frontier orbital energies, oscillator strengths for electronic excitations and compositions of vertical transitions, in terms of molecular orbitals of dye D, are given in Table 1. The electronic distributions observed for selected molecular orbitals contributing significantly to the prominent electronic excitations in the dye D are presented in Fig. 2. An absorption peak at ca. 700 nm is predicted for D with appreciable oscillator strengths (see Table 1 and Fig. 3). This originates due to the electronic excitation from the HOMO to the LUMO. Since in the HOMO and LUMO levels of the dyes the electronic distribution occurs over the entire molecule, this absorption may be described as a π–π* transition. A second absorption occurring below 500 nm is due to the electronic excitation from the HOMO to LUMO + 1. The position of this peak is insensitive to the number of cyanoacrylic acid units present in the dye. The high value of the oscillator strength for absorption in dye D was attributed to the elongation of conjugation in the dye.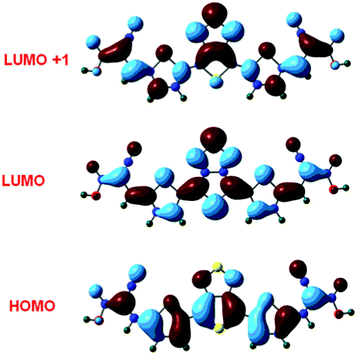 | ||
| Fig. 2 Electronic distributions in the selected molecular orbitals of dye D. | ||
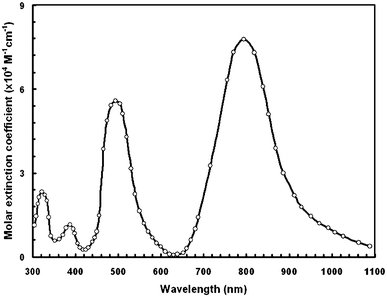 | ||
| Fig. 3 Simulated (B3LYP/6-31G**) electronic spectra for dye D in DMSO medium. | ||
| Phase | Theory | λ max (nm) | f | Assignment | HOMO (eV) | LUMO (eV) | Band Gap (eV) |
|---|---|---|---|---|---|---|---|
| Vacuum | B3LYP | 752 | 0.775 | HOMO → LUMO (100%) | −5.63 | −3.94 | 1.69 |
| 477 | 0.800 | HOMO → LUMO +1 (93%) | |||||
| 311 | 0.160 | HOMO − 7 → LUMO (67%) HOMO − 1 → LUMO +1 (24%) | |||||
| DMSO | B3LYP | 796 | 1.052 | HOMO → LUMO (100%) | −5.49 | −3.79 | 1.70 |
| 494 | 0.756 | HOMO → LUMO +1 (96%) | |||||
| 321 | 0.173 | HOMO − 1 → LUMO +1 (69%) HOMO − 5 → LUMO (24%) | |||||
| Vacuum | MPW1K | 695 | 0.963 | HOMO → LUMO (99%) | −6.39 | −3.71 | 2.68 |
| 408 | 0.766 | HOMO → LUMO +1 (95%) | |||||
| 291 | 0.177 | HOMO − 5 → LUMO (93%) | |||||
| DMSO | MPW1K | 741 | 1.222 | HOMO → LUMO (99%) | −6.27 | −3.57 | 2.70 |
| 421 | 0.736 | HOMO → LUMO +1 (96%) | |||||
| 301 | 0.283 | HOMO − 5 → LUMO (94%) |
Photophysical and electrochemical properties
Preliminary studies of the photophysical and electrochemical properties of dye D sensitizer were conducted. The normalized optical absorption spectra of this dye in DMSO are shown in Fig. 4. In dilute DMSO solution, the dye D exhibited an absorption band in the shorter wavelength region with an absorption peak around 412 nm. An additional absorption band in the longer wavelength region is shown by an absorption peak at 611 nm. The band centered at 412 nm corresponds to the π–π* transition of the conjugated system, while the band at 611 nm (molar extinction coefficient, 1.27 × 10⁴ M−1 cm−1) is assigned to the chemical structure of dithienylthienothiadiazole. The optical band gap (Egopt) estimated from the onset of the absorption edge is 1.67 eV. In the longer wavelength region the absorption band indicates that the number of acceptor groups influences the π–π stacking and also expands the π-conjugation length.22 This trend in the experimentally observed absorption spectra is closely matched by the theoretically computed spectra. We have also recorded the optical absorption in different solvents and found that the optical absorption band does not have a significant effect.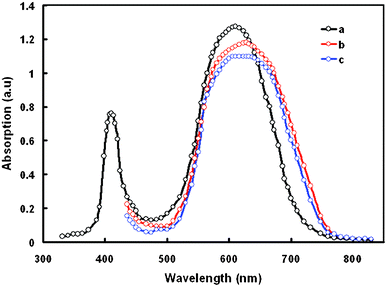 | ||
| Fig. 4 UV-visible absorption spectra of dye D in (a) DMSO solution; (b) adsorbed onto 8 μm TiO2 film; and (c) CDCA-D adsorbed on the TiO2 film. | ||
The absorption spectra of dye D adsorbed onto the TiO2 film is also shown in Fig. 4 which is red-shifted and broadened compared to those of dyes in solution. Generally, when a sensitizer anchors onto nanocrystalline TiO2 surfaces, the deprotonation and aggregation of dye molecules affects the optical absorption profiles. Typically the molecular aggregation contains H- and J-aggregates. Deprotonation and H-aggregation always result in a blue-shift of the absorption peak,23 while J-aggregates mainly lead to a red-shift of the absorption peak. The red-shift and broadening of the absorption band in the absorption spectra on the TiO2 surface can be attributed to the formation of J-aggregates. Such spectral broadening allows the dye molecules to harvest visible light more efficiently. Since dye D has two anchoring groups, these may align horizontally next to the TiO2 surface and thereby slow down the charge recombination.
To evaluate the possibility of electron injection from the LUMO level of dye molecules into the conduction band of TiO2, the electrochemical redox potentials were measured by cyclic voltammetry (CV) using a three electrode cell and electrochemical analyzer. The redox and oxidation potentials of dye D vs. NHE were calibrated by potentials vs. Fc+/Fc and listed in Table 2. The LUMO and HOMO levels of dye D are −1.0 (−3.70 eV) and 1.06 V (−5.76 eV), vs. NHE, respectively. These values are very close to the values estimated from the DFT calculations. The value of oxidation potential (1.06 V) is sufficiently more positive than the iodine redox potential (0.4 vs. NHE),23 indicating that the oxidized dyes can be regenerated from the reduced species in the electrolyte to give an efficient charge separation. The reduction potential (−1.0 V) corresponding to the LUMO (−3.7 eV) of dye D is more negative than the conduction band edge of TiO2 (−0.5 V vs. NHE),23 which provides a sufficient driving force for electron injection. The HOMO level, which corresponds to the oxidation potential, is 1.06 V vs. NHE, and is sufficiently more positive than the I−3/I− redox potential (0.4 V vs. NHE). This indicates that the oxidized dye, formed after the injection of an electron into the conduction band of TiO2, could accept the electron from the I− ion thermodynamically.24
| E gopt (eV) | E ox (V) vs. NHE | E red (V) vs. NHE | E HOMO (eV) | E LUMO (eV) | E gcv (eV) |
|---|---|---|---|---|---|
| a E gopt: the optical band gap value estimated from the onset wavelength in the optical absorption. Egopt = 1240/λonset. b E ox: the oxidation potential (vs NHE). c E red: the reduction potential (vs NHE). EHOMO = −(Eox + 4.7); ELUMO = −(Ered + 4.7). d E gcv: the electrochemical band gap estimated from cyclic voltammetry. | |||||
| 1.67 | 1.06 | −1.0 | −5.76 | −3.70 | 1.86 eV |
To get information about the bonding ability of dye D to the TiO2 surface, we have measured the FTIR spectra of pure dye and dye adsorbed on to the TiO2 film. Pure D showed a characteristic peak of C![[double bond, length as m-dash]](https://www.rsc.org/images/entities/char_e001.gif) O in COOH around 1690 cm−1, but this peak disappeared due to deprotonation and new two peaks attributed to the –COO− group (1592 and 1385 cm−1) were observed for the dye-loaded TiO2 film.25 This indicates that there is strong binding and electronic coupling between TiO2 and dye D.26
O in COOH around 1690 cm−1, but this peak disappeared due to deprotonation and new two peaks attributed to the –COO− group (1592 and 1385 cm−1) were observed for the dye-loaded TiO2 film.25 This indicates that there is strong binding and electronic coupling between TiO2 and dye D.26
Photovoltaic properties
Preparation of the TiO2 film was optimized to obtain a high photovoltaic performance from the DSSC. The thickness of the TiO2 film is one of the most important factors that affect the performance of DSSCs. The J–V characteristics of DSSCs with TiO2 films having thicknesses of 8, 10, 12, 15 and 18 μm are shown in Fig. 5 and the corresponding photovoltaic parameters are listed in Table 3. An increase in the PCE from 2.76 to 4.18% for the DSSC is observed when the thickness of TiO2 increases from 4 to 12 μm. Any further increase in the TiO2 film thickness was found to cause a decrease in the PCE. It has been generally reported that thicker TiO2 films can adsorb more dye molecules onto their surface.27 The results indicate that the diffusion length of photo-excited electrons traveling in the TiO2 particle network is limited to less than around 12 μm. As the electron transporting length becomes longer with the thicker TiO2 films, this may cause a higher probability of recombination and consequently decreases Jsc with a further increase in the thickness of the TiO2 film. Additionally, thicker TiO2 films also show a decrease in Voc, which could be attributed to the increasing probability of recombination, owing to the longer electron traveling path. The fill factor (FF) also decreases with increasing thickness of TiO2 as well, due to the larger series resistance in the thicker TiO2 film.28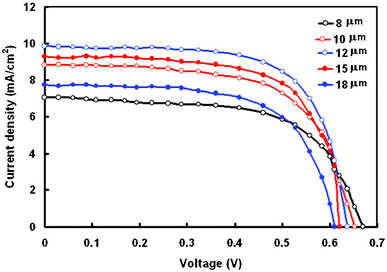 | ||
| Fig. 5 Current density–voltage (J–V) characteristics DSSCs sensitized with dye D under an illumination intensity of 100 mW cm−2, for different thicknesses of TiO2 film. | ||
| Thickness (μm) | J sc (mA cm−2) | V oc (V) | FF | PCE(%) | R ct1(ohm) | R ct2(ohm) |
|---|---|---|---|---|---|---|
| 8 | 7.07 | 0.67 | 0.58 | 2.75 | 3.12 | 31.42 |
| 10 | 8.83 | 0.65 | 0.62 | 3.56 | 3.18 | 28.66 |
| 12 | 9.85 | 0.632 | 0.68 | 4.22 | 3.20 | 26.58 |
| 15 | 9.28 | 0.62 | 0.64 | 3.68 | 3.23 | 28.37 |
| 18 | 7.70 | 0.61 | 0.60 | 2.82 | 3.19 | 30.34 |
Electrochemical impedance spectra (EIS) were used to characterize the charge transport resistance of DSSCs with different thicknesses of TiO2 film, measured under illumination. The Nyquist plots for the DSSCs are shown in Fig. 6a and the equivalent circuit used to estimate the kinetic parameters is shown in Fig. 7. The Ohmic resistance (Rs) in the equivalent circuit corresponds to the overall series resistance. In general, the EIS of a DSSC measured under illumination shows three semicircles in the range of 10 mHz to 100 KHz. The first semicircle (Rct1) represents the charge transfer resistance at the counter electrode and electrolyte.29 Charge transfer resistance at the TiO2/dye/electrolyte interface corresponds to the second semicircle (Rct2). In the low frequency (1–0.01 Hz) the range impedance is associated with the Warburg diffusion process of I−3/I− in the electrolyte (Zw). The values of Rct1 and Rct2 are summarized in Table 3. The value of Rct1 is almost insensitive to the thickness of the TiO2 film, indicating similar charge transfer resistances at the counter electrode and electrolyte. The value of Rct2 decreases with an increase of TiO2 thickness, resulting in an improved photovoltaic performance. However with further increases in the TiO2 film thickness above 12 μm, Rct2 increases, resulting in reduced photovoltaic performances of DSSCs with thicker TiO2 films. We have also measured the EIS at an applied voltage equal to the open circuit voltage (Voc) of the DSSC in darkness to investigate the correlation of electron transport with different thicknesses of TiO2 (Fig. 6b). In these DSSCs, operated in darkness, electron transport though the mesoporous TiO2, and I− is oxidized to I−3 at the counter electrode at the same time.30Fig. 6b shows a Nyquist plot of DSSCs with different thicknesses of TiO2 film, in the dark. The largest circle at the middle frequencies represents the recombination resistance (Rrec), i.e. resistance for the direct transfer of electrons from the conduction band of TiO2 to I−3 at the TiO2/dye/electrolyte interface or in the electrolyte.31
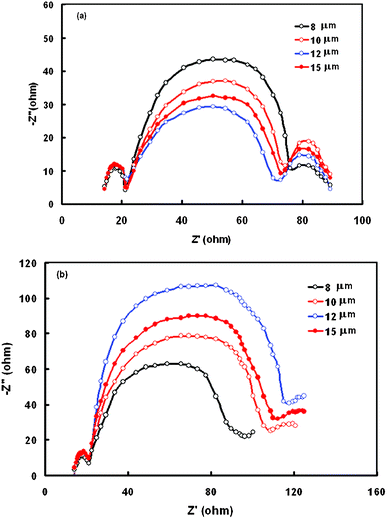 | ||
| Fig. 6 Nyquist plots of the electrochemical spectra of DSSCs sensitized with dye D measured with an external potential of −0.65 V under (a) illumination and (b) in darkness, for different thicknesses of TiO2 film. | ||
 | ||
| Fig. 7 Equivalent circuit used for fitting the EIS data. | ||
The above results showed that the optimized TiO2 film thickness for the photoanode is about 12μm. This resulted in the DSSC being optimized by about 4.22% of PCE, which is low due to the dye aggregation at the TiO2 surface during the sensitization, resulting in a low Jsc. When dye is adsorbed onto the TiO2 surface, π–π stacking of organic dye molecules usually occurs because of the strong intermolecular interactions. Such π–π stacking is advantageous to light harvesting because of its broad feature in the UV-visible absorption spectrum. However, π-stacked aggregation usually has insufficient injection of electrons from the excited state of the dye into the conduction band of TiO2, which increases the recombination of electrons with oxidized dye molecules. Such recombination leads to a dark current and losses in both Jsc and Voc, resulting in a DSSC with a lower PCE.32,33 Use of an additive in the dye solution can reduce π–π stacking and dye aggregation leading to an improved PCE of the DSSC. Further attempts were made to improve the PCE of the DSSC with a TiO2 film thickness of 12 μm, and sensitized with dye D using the CDCA as a coadsorbent in the dye solution. The DSSC fabricated with CDCA coadsorbent showed an improved performance with a PCE of 5.46% with Jsc = 11.52 mA cm−2, Voc = 0.66 V and FF = 0.72. The values of both Jsc and Voc were higher than those without CDCA. This could be the increased competition between the dye and the CDCA molecules for adsorption onto the TiO2 surface.
The incident photon-to-current conversion efficiency (IPCE) of the DSSCs was estimated to be between 400 and 800 nm according to following expression:
| IPCE(λ) = 1240Jsc (mA cm−2)/λ(nm)Pin(mW cm−2) |
| IPCE(λ) = LHE(λ)xϕinjxηcc |
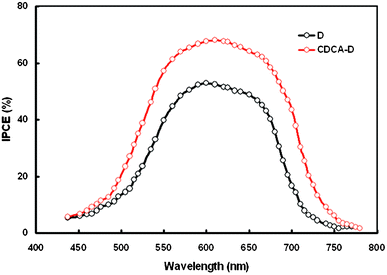 | ||
| Fig. 8 IPCE spectra for DSSCs sensitized with D and CDCA-D. | ||
The LHE (λ) is the number of absorbed photons per number of incident photons and depends mainly on the amount of dye loading at the photoelectrode surface; ϕinj is the quantum yield for the electron injection from the dye excited state (LUMO) to the TiO2 electrode conduction band and ηcc is the efficiency of charge collection. We have recorded the UV-visible absorption spectra of CDCA-D adsorbed on the TiO2 surface and found that with the addition of CDCA in the dye solution, the maximum absorption decreased slightly with slight blue-shift in the absorption peak (as shown in Fig. 4). The amount of dye loading (3.42 × 10⁻⁷ mol cm−2 for D to 3.22 × 10⁻⁷ mol cm−2 for CDCA-D) also decreases which indicates that the dye and CDCA compete for the site on the TiO2 surface in an equilibrium process.34 The strong interaction between adsorbed dye molecules and oxide molecules in the TiO2 surface leads to aggregate formation and consequently, a broadening of the absorption spectrum was observed during the dye adsorption on to the TiO2 surface. This may be attributed to dye–TiO2 interactions, dye–dye interactions or both. The addition of CDCA in the dye solution diminished these interactions at the TiO2 surface,35 leading to a reduction in the dye loading. This means that the LHE was slightly reduced upon the addition of CDCA. Therefore, the IPCE improvement is attributed to the enhancement of electron injection efficiency and/or the charge collection efficiency. After the adsorption of coadsorbant, protons are left on the TiO2 surface and hence the surface becomes positively charged. This results in a positive shift of the conduction band edge, by the coadsorption of CDCA. The positive shift of conduction band edge enlarges the driving force for electron injection, which results in the enhancement in IPCE and Jsc.36 In addition, the coadsorption also breaks up the dye aggregation and the non-aggregated dye molecules are more favorable for the electron injection, leading to an improvement in Jsc.
Since the Voc is theoretically the difference between the quasi-Fermi level of TiO2 under illumination and the redox potential of the redox couple I−3/I−, the positive shift of the conduction band edge upon adsorption of CDCA will result in a decrease in Voc. However, we observed an increase in Voc after the coadsorption of CDCA. This enhancement is attributed to the suppression of recombination between the injected electrons and I−3ion as evidenced from the dark current and EIS spectra. We have observed that the dark current of the DSSC was reduced when CDCA is used as a coadsorbent. Since the dark current is generated due to the recombination of injection electrons and I−3, the low value of dark current indicates that the coadsorption of CDCA leads to a suppression of the recombination between injection electrons and I−3, which favors the increase in Voc.
The EIS spectra in darkness were also recorded to obtain information about the charge recombination in DSSCs. We observed that the radius of the semicircle in the intermediate frequency region, which represents the electron transfer at the TiO2/dye/electrolyte interface, increases with coadsorption of CDCA in the dye. A larger radius of this semicircle implies a lower rate of charge recombination between the injected electrons and I−3. This also indicates an effective suppression of the back reaction of injected electrons and I−3ions. The electron lifetimes (τe) in the TiO2 film, with and without CDCA, were determined from the Bode plots, using τe = 1/2πfmax, where fmax is the frequency value of the characteristic low frequency peak in the Bode phase plot. A longer τe was found for DSSCs with CDCA in the dye solution, which have smaller fmax values than the DSSC without CDCA in the dye solution. This result is in agreement with the higher value of Voc for the DSSC with CDCA added as the coadsorbant into the dye solution.
Conclusions
A new metal-free dye (D) with one dithienylthienothiadiazole central unit and two cyanoacrylic acid anchoring side groups, for use in DSSCs, was synthesized and characterized using optical and electrochemical analysis, and density function theory. The DSSC showed a PCE of 4.22% when the TiO2 film thickness was 12 μm. This was improved further to 5.47% when the coadsorbant CDCA was added to the solution. The higher values of IPCE for the DSSCs with CDCA, compared to those without CDCA in dye solution, were consistent with the values determined for Jsc and PCE. The higher values of recombination resistance and longer electron lifetime determined from the EIS measurements were also consistent with the observed values of Jsc, Voc and PCE.Acknowledgements
The authors (GDS, RK and RJB) wish to thank the UK India Education and Research Initiative (UKIERI II) coordinated by the British Council, New Delhi, India, for financial support through a thematic partnership. RK additionally wishes to thank the Madhya Pradesh Council of Science and Technology, Bhopal, India, for financial support.References
- (a) B. O'Regan and M. Gratzel, Nature, 1991, 353, 737 CrossRef CAS; (b) M. K. Nazeeruddin, A. Kay, I. Rodicio, R. Humphry-Baker, E. Muller, P. Liska, N. Vlachopoulos and M. Gratzel, J. Am. Chem. Soc., 1993, 115, 6382 CrossRef CAS; (c) M. Gratzel, Acc. Chem. Res., 2009, 42, 1788 CrossRef CAS; (d) W. Zhu, Y. Wu, S. Wang, W. Li, X. Li, J. Chen, Z.-S. Wang and H. Tian, Adv. Funct. Mater., 2011, 21, 756–763 CrossRef CAS; (e) J.-L. Bredas, J. E. Norton, J. Cornil and V. Coropceanu, Acc. Chem. Res., 2009, 42, 1691–1699 CrossRef CAS; (f) Y. J. Chang and T. J. Chow, J. Mater. Chem., 2011, 21, 9523–9531 RSC; (g) J. He, W. Wu, J. Hua, Y. Jiang, S. Qu, J. Li, Y. Long and H. Tian, J. Mater. Chem., 2011, 21, 6054–6062 RSC; (h) S. Mathew and H. Imahori, J. Mater. Chem., 2011, 21, 7166–7174 RSC; (i) N. Cai, S.-J. Moon, L. Cevey-Ha, T. Moehl, R. Humphry-Baker, P. Wang, S. M. Zakeeruddin and M. Gratzel, Nano Lett., 2011, 11, 1452–1456 CrossRef CAS.
- (a) Y. Cao, Y. Bai, Q. Yu, Y. Cheng, S. Liu, D. Shi, F. Gao and P. Wang, J. Phys. Chem. C, 2009, 113, 6290 CrossRef CAS; (b) A. Hagfeldt, G. Boschloo, L. C. Sun, L. Kloo and H. Pettersson, Chem. Rev., 2010, 110, 6595 CrossRef CAS.
- A. Mishra, M. K. Fischer and P. Bauerle, Angew. Chem., Int. Ed., 2009, 48, 2474 CrossRef CAS.
- W. Zeng, Y. Cao, Y. Bai, Y. Wang, Y. Shi, M. Zhang, F. Wang, C. Pan and P. Wang, Chem. Mater., 2010, 22, 1915–1925 CrossRef CAS.
- (a) Z.S. Wang, Y. Cui, K. Hara, Y. Dan-oh, C. Kasada and A. Shinpo, Adv. Mater., 2007, 19, 1138–1141 CrossRef CAS; (b) Z.S. Wang, Y. Cui, Y. Danoh, C. Kasada, A. Shinpo and K. Hara, J. Phys. Chem. C, 2007, 111, 7224–7230 CrossRef CAS.
- (a) S. Ito, S. M. Zakeeruddin, R. Humphrey-Baker, P. Liska, R. Charvet, P. Comte, M. K. Zazeeruddin, P. Pechy, M. Tanka, H. Miura, S. Uchida and M. Gratzel, Adv. Mater., 2006, 18, 1202–1205 CrossRef CAS; (b) S. Ito, H. Miura, S. Uchida, M. Takata, K. Sumioka, P. Liska, P. Comte, P. Pechy and M. Gratzel, Chem. Commun., 2008, 5194–5196 RSC.
- (a) D. P. Hagberg, T. Edvinsson, T. Marinado, G. Boschloo, A. Hagfeldt and L. Sun, Chem. Commun., 2006, 2245–2247 RSC; (b) S. Hwang, J. H. Lee, C. Park, H. Lee, C. Kim, C. Park, H. Lee, C. Kim, C. Park, M. H. Lee, W. Lee, J. Park, K. Kim, N. G. Park and C. Kim, Chem. Commun., 2007, 4887–4889 RSC; (c) A. Baheti, P. Tyagi, K. R. J. Thomas, Y.-C. Hsu and J. T. Lin, J. Phys. Chem. C, 2009, 113, 8541 CrossRef CAS; (d) D.P. Hagberg, T. Marinado, K.M. Karlsson, K. Nonomura, P. Qin, G. T. Boschloo, A. Brinck, A. Hagfeldt and L. Sun, J. Org. Chem., 2007, 72, 9550–9556 CrossRef CAS; (e) X. Xu, B. Peng, J. Chen, M. Liang and F. Cai, J. Phys. Chem. C, 2008, 112, 874–880 CrossRef CAS; (f) A. Baheti, P. Singh, C.-P. Lee, K. R. J. Thomas and K.-C. Ho, J. Org. Chem., 2011, 76, 4910–4920 CrossRef CAS; (g) L. Y. Lin, C. H. Tsai, K. T. Wong, T. W. Huang, L. Hsieh, S. H. Liu, H. W. Lin, C. C. Wu, S. H. Chou, S. H. Chen and A. I. Tsai, J. Org. Chem., 2010, 75, 4778–4785 CrossRef CAS; (h) P. Shen, Y. Liu, X. Huang, Z. Zhao, N. Xiang, J. Fei, L. Liu, X. Wang, H. Huang and S. Tan, Dyes Pigm., 2009, 83, 187–197 CrossRef CAS; (i) H. Chen, H. Huang, X. Huang, J. N. Clifford, A. Forneli, E. Palomares, X. Zheng, L. Zheng, X. Wang, P. Sen, B. Zhao and S. Tan, J. Phys. Chem. C, 2010, 114, 3280–3286 CrossRef CAS; (j) W. Zhu, Y. Wu, S. Wang, W. Li, X. Li, J. Chen, Z. S. Wang and H. Tian, Adv. Funct. Mater., 2011, 21, 756–763 CrossRef CAS; (k) J. Tang, W. Wu, J. Hua, J. Li, X. Li and H. Tian, Energy Environ. Sci., 2009, 2, 982–990 RSC; (l) J. Tang, J. Hua, W. Wu, J. Li, Z. Jin, Y. Long and H. Tian, Energy Environ. Sci., 2010, 3, 1736–1745 RSC; (m) K. R. J. Thomas, N. Kapoor, C.-P. Lee and K.-C. Ho, Chem.–Asian J., 2012, 7, 738–750 Search PubMed.
- (a) Y. Liu, N. Xiang, X. Feng, P. Shen, W. Zhou, C. Weng, B. Zhao and S. Tan, Chem. Commun., 2009, 2499–2501 RSC; (b) T. Bessho, S. M. Zakeeruddin, C. Y. Yeh, E. W. G. Diau and M. Grätzel, Angew. Chem., Int. Ed., 2010, 49, 6646–6649 CrossRef CAS.
- (a) J. Y. Li, C. Y. Chen, C. P. Lee, S. C. Chen, T. H. Lin, H. H. Tsai, K. C. Ho and C. G. Wu, Org. Lett., 2010, 12, 5454 CrossRef CAS; (b) H. Choi, J. J. Kim, K. Song, J. Ko, M. K. Nazeeruddin and M. Gratzel, J. Mater. Chem., 2010, 20, 3280 RSC; (c) S. Paek, H. Choi, C. Kim, N. Cho, S. So, K. Song, M. K. Nazeeruddin and J. Ko, Chem. Commun., 2011, 47, 2874 RSC.
- (a) A. Bolag, J. I. Nishida, K. Hara and Y. Yamashita, Chem. Lett., 2011, 40, 510 CrossRef CAS; (b) D. Kumar, K. R. J. Thomas, C.-P. Lee and K.-C. Ho, Org. Lett., 2011, 13, 2622 CrossRef CAS; (c) S. Franco, J. Garin, N. M. De Baroja, R. Perez-Tejada, J. Orduna, Y. Yu and M. Lira-Canto, Org. Lett., 2012, 14, 752 CrossRef CAS; (d) H. Y. Yang, Y. S. Yen, Y. C. Hsu, H. H. Chou and J. T. Lin, Org. Lett., 2010, 12, 16 CrossRef CAS.
- Y. S. Won, Y. S. Yang, J. H. Kim, J. H. Ryu, K. K. Kim and S. S. Park, Energy Fuels, 2010, 24, 3676 Search PubMed.
- S. S. Park, Y. S. Won, Y. C. Choi and J. H. Kim, Energy Fuels, 2009, 23, 3732 CrossRef CAS.
- C. H. Yang, S. H. Liao, Y. K. Sun, Y. Y. Chaung, T. L. Wang, Y. T. Shien and W. C. Lin, J. Phys. Chem. C, 2010, 114, 21786 CrossRef CAS.
- M. J. Frisch, G. W. Trucks, H. B. Schlegel, G. E. Scuseria, M. A. Robb, J. R. Cheeseman, G. Scalmani, V. Barone, B. Mennucci, G. A. Petersson, H. Nakatsuji, M. Caricato, X. Li, H. P. Hratchian, A. F. Izmaylov, J. Bloino, G. Zheng, J. L. Sonnenberg, M. Hada, M. Ehara, K. Toyota, R. Fukuda, J. Hasegawa, M. Ishida, T. Nakajima, Y. Honda, O. Kitao, H. Nakai, T. Vreven, J. A. Montgomery Jr., J. E. Peralta, F. Ogliaro, M. Bearpark, J. J. Heyd, E. Brothers, K. N. Kudin, V. N. Staroverov, R. Kobayashi, J. Normand, K. Raghavachari, A. Rendell, J. C. Burant, S. S. Iyengar, J. Tomasi, M. Cossi, N. Rega, N. J. Millam, M. Klene, J. E. Knox, J. B. Cross, V. Bakken, C. Adamo, J. Jaramillo, R. Gomperts, R. E. Stratmann, O. Yazyev, A. J. Austin, R. Cammi, C. Pomelli, J. W. Ochterski, R. L. Martin, K. Morokuma, V. G. Zakrzewski, G. A. Voth, P. Salvador, J. J. Dannenberg, S. Dapprich, A. D. Daniels, Ö. Farkas, J. B. Foresman, J. V. Ortiz, J. Cioslowski and D. J. FoxGaussian 09, Revision A.02, Gaussian, Inc., Wallingford CT, 2009 Search PubMed.
- (a) W. Kohn and L. J. Sham, Phys. Rev., 1965, 140, A1133–A1138 CrossRef; (b) R. G. Parr and W. Yang, Density-functional theory of atoms and molecules, Oxford University Press, Oxford, 1989 Search PubMed.
- (a) C. Lee, W. Yang and R. G. Parr, Phys. Rev. B, 1988, 37, 785–89 CrossRef CAS.
- F. Furche and R. Ahlrichs, J. Chem. Phys., 2002, 117, 7433–7447 CrossRef CAS.
- B. J. Lynch, P. L. Fast, M. Harris and D. G. Truhlar, J. Phys. Chem. A, 2000, 104, 4811–4815 CrossRef CAS.
- (a) M. Cossi, V. Barone, R. Cammi and J. Tomasi, Chem. Phys. Lett., 1996, 255, 327–335 CrossRef CAS; (b) J. Tomasi, B. Mennucci and R. Cammi, Chem. Rev., 2005, 105, 2999–3093 CrossRef CAS.
- (a) S. I. Gorelsky , SWizard program http://www.sg-chem.net/, University of Ottawa, Ottawa, Canada, 2010 Search PubMed; (b) S. I. Gorelsky and A. B. P. Lever, J. Organomet. Chem., 2001, 635, 187–196 CrossRef CAS.
- J. A. Mikroyannidis, D. V. Tsagkournos, S. S. Sharma, Y. K. Vijay and G. D. Sharma, J. Mater. Chem., 2011, 21, 4679 RSC.
- Y. S. Won, Y. S. Yang, J. H. Kim, J. H. Ryu, K. K. Kim and S. S. Park, Energy Fuels, 2010, 24, 3676 Search PubMed.
- (a) H. Hara, Z. S. Wang, T. Sato, A. Furube, R. Katoh, H. Sugihara, Y. Dan-oh, C. Kasada, A. Shinpo and S. Suga, J. Phys. Chem. B, 2005, 109, 15476 CrossRef CAS; (b) D. Kim, J. K. Lee, S. O. Kang and J. Ko, Tetrahedron, 2007, 63, 1913 CrossRef CAS; (c) S. Kim, J. K. Lee, S. O. Kang, J. Ko, J. H. Yum, S. Fantacci, F. Md. D. DeAngelis, M. K. Nazeeruddin and M. Gratzel, J. Am. Chem. Soc., 2006, 128, 16701 CrossRef CAS; (d) D. Hagberg, J. H. Yum, H. Lee, F. D. Angelis, T. Marinado, K. M. Karison, R. Humphry-Baker, L. Sun, A. Hagfedt, M. Gratzel and M. K. Nazeeruddin, J. Am. Chem. Soc., 2008, 130, 6259 CrossRef CAS.
- (a) C. Klein, M. K. Nazeeruddin, D. D. Censo, P. Liska and M. Grätzel, Inorg. Chem., 2004, 43, 4216–4226 CAS; (b) Y. J. Chang and T. J. Chow, Tetrahedron, 2009, 65, 9626–9632 CrossRef CAS.
- G. Socrates, Infrared characteristics group frequencies, 2nd addition Ed; wiely & sons Ltd, Baffins Lane, Chichester, UK, 1994 Search PubMed.
- (a) H. N Tian, X. C. Yang, R. K. Chen, R. Zhang, A. Hagfeldt and L. C. Sunt, J. Phys. Chem. C, 2008, 112, 11023 CrossRef CAS; (b) M. K.; Nazeeruddin, R. Humphry-Baker, P. Liska and M. Gratzel, J. Phys. Chem. B, 2003, 107, 8981 CrossRef CAS.
- (a) C. Y. Huang, Y. C. Hsu, J. G. Chen, V. Suryanarayanan, K. M. Lee and K. C. Ho, Sol. Energy Mater. Sol. Cells, 2006, 90, 2391–2397 CrossRef CAS; (b) J. G. Chen, C. Y. Chen, S. J. Wu, J. Y. Li, C. G. Wu and K. C. Ho, Sol. Energy Mater. Sol. Cells, 2008, 92, 1723–1727 CrossRef CAS.
- T. Miyssaka, A. Ikegami and Y. Kijitori, J. Electrochem. Soc., 2007, 154, A455–A461 CrossRef CAS.
- (a) H. G. Yun, Y. Jun, J. Kim, B. S. Bae and M. G. Kang, Appl. Phys. Lett., 2008, 93, 133311 CrossRef; (b) H. G. Yun, B. S. Bae and M. G. Kang, Adv. Energy Mater., 2011, 1, 337–342 Search PubMed; (c) J. Bisquert, Phys. Chem. Chem. Phys., 2003, 5, 5360 RSC; (d) J. Bisquert, A. Zaban, M. Greenshtein and I. Mora-Sero, J. Am. Chem. Soc., 2004, 126, 13550 CrossRef CAS.
- Q. Wang, J. E. Moser and M. Gratzel, J. Phys. Chem. B, 2005, 109, 14945–14953 CrossRef CAS.
- T. Hashikawa, M. Yamade, R. Kikuchi and K. Eguchi, J. Electrochem. Soc., 2005, 152, E68–E73 CrossRef CAS.
- (a) A. C. Khazraji, S. Hotchandani, S. Das and P. V. Kamat, J. Phys. Chem. B, 1999, 103, 4693–4700 CrossRef CAS; (b) A. Kay and M. Gratzel, J. Phys. Chem., 1993, 97, 6272–6277 CrossRef.
- (a) X. M. Ren, Q. Y. Feng, G. Zhou, C. H. Huang and Z. S. Wang, J. Phys. Chem. C, 2010, 114, 7190–7195 CrossRef CAS; (b) N. R. Neale, N. Kopidakis, J. Van de Lagemaat, M. Gratzel and A. J. Frank, J. Phys. Chem. B, 2005, 109, 23183 CrossRef CAS.
- Z. S. Wang and G. Zhou, J. Phys. Chem. C, 2009, 113, 15417–15421 CrossRef CAS.
- (a) K. M. Lee, V. Suryanaryanan, K. C. Ho, K. R. J. Thomas and J. T. Lin, Sol. Energy Mater. Sol. Cells, 2007, 91, 1426 CrossRef CAS; (b) M. C. Bernard, H. Cachet, P. Falares, A. Hogot-Le Goff, M. Kalbac, I. Lukes, N. J. Oanh, T. Stergiopoulos and I. Arabatzis, J. Electrochem. Soc., 2003, 150, 155 Search PubMed; (c) S. Qu, W. Wu, J. Huo, C. Kong, Y. Long and H. Tian, J. Phys. Chem. C, 2010, 114, 1343 CrossRef CAS.
- D. Kuang, S. Ito, B. Wenger, C. Klein, J. E. Moser, R. Humphry- Baker, S. M. Zakeeruddin and M. Gratzel, J. Am. Chem. Soc., 2006, 128, 4146 CrossRef CAS.
| This journal is © The Royal Society of Chemistry 2012 |
