DOI:
10.1039/C2RA21189K
(Paper)
RSC Adv., 2012,
2, 11465-11471
Enhanced methanol oxidation and CO tolerance using CeO2-added eggshell membrane-templated Pd network electrocatalyst
Received
15th June 2012
, Accepted 25th September 2012
First published on 27th September 2012
Abstract
Macroporous Pd and CeO2-added Pd network catalysts have been synthesized using eggshell membrane (ESM) as a template for enhanced methanol oxidation and CO tolerance. The microstructural characterization revealed a hierarchically ordered macroporous network of Pd reproducing the fibrous structure of ESM for a Pd-only catalyst, and a flower-like CeO2-decorated Pd morphological architecture for the CeO2-added Pd catalyst synthesized by a precipitation method. XRD patterns indicated Pd and CeO2 phases with good crystallinity. The cyclic voltammetry studies showed an enhanced electrocatalytic activity for methanol oxidation in acidic aqueous medium. Because of the preferential formation of Ce–CO bonds over Pd–CO bonds, the incorporation of CeO2 into Pd-based catalysts results in an increased CO tolerance, making it a robust catalyst for methanol oxidation in direct methanol fuel cells.
1. Introduction
Direct methanol fuel cells (DMFCs) are currently under commercial development for residential, transportation and portable power applications due to their inherently high-energy conversion density, efficiency and low emissions.1–3 However, the progress of DMFC commercialization has been challenged by the high cost and inferior performance of electrocatalysts for the methanol oxidation reaction (MOR).4,5 Pt-based metals, despite exhibiting high activity for MOR, are rare, expensive, and prone to dissolving and agglomerating in acidic conditions over time. These shortcomings call for development of alternative electrocatalysts with better electrochemical and economical performances.
Pd is known to be the second-best electrocatalyst for MOR. It resembles Pt in many aspects of its chemical and physical properties (e.g., the same group in the periodic table, same fcc crystal structure, similar atomic size, etc.), but with lower cost.6–8 Unfortunately, like Pt, Pd-based electrocatalysts also suffer CO poisoning (although to a lesser degree), resulting in a rapid deterioration in performance of DMFCs. The CO poisoning mechanism can be understood in that the surface of Pd is preferentially covered by CO in the form of an intermediate compound Pd–CO, causing the loss of catalytic activity on methanol. If the Pd–CO bond can be effectively broken by oxidation of CO to CO2, the surfaces that were covered by CO can then be freed for catalytic reaction.9 One approach to lifting CO from the surface of Pd is to expose it to an oxidizing environment.10 Oxygen-containing species such as OHads can be generated from H2O. However, the activation of H2O on the Pd surface is difficult and requires relatively high potentials.11 An alternative is to combine the Pd-based catalyst with an oxide that can release oxygen facilely.
Cerium oxide (CeO2) is one of the most versatile rare-earth oxides that finds applications in catalysis,12 sensors,13 fuel cells,14 and oxygen storage.15 Its ability to supply oxygen-containing species for CO transfer has been observed in promoting MOR of a DMFC.16 Therefore, combining Pd with CeO2 becomes a natural choice in developing a new robust electrocatalyst for MOR. In fact, CeO2/Pd composite has been shown to be a good catalyst for methanol synthesis from a CO hydrogenation process, mainly benefiting from the strong interaction between Pd and CeO2.17–20 The spontaneous conversion of CO to methanol enhanced by CeO2 can then effectively avoid CO poisoning of the Pd catalyst, thus retaining Pd's electrocatalytic activity.
Making a unique microstructure that can best fulfil the functionalities of CeO2 and Pd particles to effectively catalyze the MOR plays a vital role in the ultimate performance of a DMFC. Because of its biomineralization nature has garnered, using eggshell membrane (ESM) as a template to synthesize a variety of functional materials with controllable morphologies much attention in recent years.21–29 ESM is a typical double-layer water-insoluble membrane with interwoven fibrous structure attached inside a natural eggshell. It is composed of highly cross-linked and cystine-abundant proteins decorated by amines, amides, and carboxylic groups that can interact with metal ions, forming metal-polymer complexes on the membrane fibers where in situ oxidation and reduction can occur.30 After being dried and calcined, the resultant products would retain the porous structure, providing a high specific surface area and active sites for the final electrocatalysts. Therefore, ESM has been widely used for metal ion recovery31 and fluorescent metal nanoclusters.32 In this study, we demonstrate the use of ESM as a template to synthesize a network-structured CeO2-added Pd catalyst. The composite catalyst is then thoroughly characterized to show its potential as an excellent robust electrocatalyst for MOR in DMFC.
2. Experimental
Synthesis of Pd backbone networks using ESM as a template
The first step to make the Pd backbone networks is to separate eggshell membranes from commercial organic eggs. A typical separation procedure is described as follows.
Commercial organic eggs are gently broken and emptied via the blunt end. After washing with deionized (DI) water, the inner shell membrane and the limiting membrane are carefully removed. The remaining eggshells are then immersed in a 1 M HCl aqueous solution for 2 days to dissolve CaCO3 in the shell, leaving behind only the organic outer shell membrane. The surfaces close to the shell and the egg white are called “back” and “front” surfaces in this study, respectively. The thus-obtained ESM is finally repeatedly washed with DI water and sealed in DI water for future use.
The Pd backbones were grown by complexing reactions between Pd2+ ions and functional groups such as –COOH and –NH2 in the ESM. A typical synthesis procedure is described as follows: fresh ESMs are first immersed into 10 mM PdCl2 (59% Pd, Acros Organics Co.) aqueous solution at room temperature. After about one week, the ESMs loaded with Pd are washed thoroughly with DI water to remove the residue solution. The cleaned Pd-ESMs are then dried at 60 °C for 12 h, followed by calcining at 500 °C for 6 h in air and another 9 h in H2. In the final product, the majority of the remaining substance is the Pd formed in a network resembling the original ESM structure.
Synthesis of CeO2-added Pd catalysts
The ESM-templated macroporous CeO2-added Pd catalyst structure was prepared by two routes: (i) dispersing commercial ultrafine CeO2 powders over the Pd backbone network, and (ii) in situ precipitation of CeO2 over the Pd backbone network. In the first route, a CeO2 colloid was first prepared from a 2.5 g CeO2 powder suspended in 200 mL ethanol with mechanical and ultrasonic stirring for a total of 24 h. The freshly made Pd-ESMs were then immersed into the CeO2 colloid for 12 h under static conditions. Finally, the CeO2-covered Pd-ESMs were gently washed by ethanol and dried at 60 °C for 12 h. In the second route, the freshly made Pd-ESMs were first immersed in 50 mM Ce(NO3)3 (Ce(NO3)3·6H2O, 99.99%, from Alfa Aesar) aqueous solution. A 0.5 M NaOH aqueous solution was then slowly added into Ce(NO3)3 solution containing the Pd-ESMs. The thus-obtained Ce(OH)3-covered Pd-ESMs were carefully washed by DI water to remove impurities and dried at 60 °C for 12 h. The samples prepared in routes (i) & (ii) were finally calcined 500 °C for 6 h in air and then in H2 for 9 h to obtain the final CeO2-added Pd catalyst.
Electrochemical characterizations of CeO2-added Pd catalysts
Both Pd and CeO2-added Pd discs were prepared by uniaxially pressing 2 g of the powders under a pressure of 10 tons and sintering at 800 °C for 12 h to achieve the desired density. The electrocatalytic activity of the synthesized CeO2-added Pd catalyst was assessed using the cyclic voltammogram (CV) method carried out in a three-electrode configuration with a ZAHNER IM6 electrochemical station. During a typical CV measurement, Pd and CeO2-added Pd catalysts in a 2 cm diameter disc shape were used as the working electrodes, Pt wire as the counter electrode, and Ag/AgCl in saturated KCl solution as the reference electrode. The electrolyte contains a solution of 2–50 vol% methanol in 0.25 M H2SO4 solution.
Each CV curve was scanned within a 1.0 V window either from 0 to 1.0 V and back to 0 V or from −0.5 to 1.5 V and back to −0.5 V at a scan rate of 50 mV s−1 or otherwise specified. Each CV curve was swept twice, but only the 2nd cycle was used for this study. To evaluate the stability of the catalyst upon cycling, up to 50 cycles of scanning were performed for an electrolyte solution of 20 vol% methanol in 0.25 M H2SO4.
Electrochemical impedance spectroscopy (EIS) was also performed in the frequency range from 0.1 to 105 Hz with an applied amplitude of 10 mV to study the underlying electrode reactions. All the experiments were carried out at room temperature. The electrodes and the electrolytes were the same as in the CV tests
Other characterizations
The morphologies of the prepared ESM, Pd backbone networks and CeO2-added Pd structure were observed with a Zeiss Ultra plus field emission scanning electron microscopy (FESEM). The phases were identified by a Rigaku D/max-A X-ray diffractometer using Cu-Kα radiation (λ = 0.154 nm) from 2θ = 10–90°. The pore size distributions were analyzed by an AutoPore IV9500 mercury porosimeter (Micromeritics, USA) in a pressure range of 0.5–30000 psia.
3. Results and discussion
Microstructure of ESM-templated Pd-based electrocatalysts
The microstructure of the front surface of the natural ESM template prepared in this work is shown in Fig. 1a as FESEM images. The membrane consists of a macroporous network of interwoven and coalescing shell membrane fibers ranging in diameter from 1 to 3 μm. This is in striking contrast to the images of the back surface, Fig. 1b, where a layer of closely packed micron-scale particles is seen. The difference between the two surfaces implies that the ESM network is hierarchically ordered which can be further seen in the cross-sectional view shown in Fig. 1c. The analysis of ESM pore structure with mercury porosimetry reveals porosity and mean pore diameter of the ESM as 38.69% and 2.39 μm, respectively (Table 1).
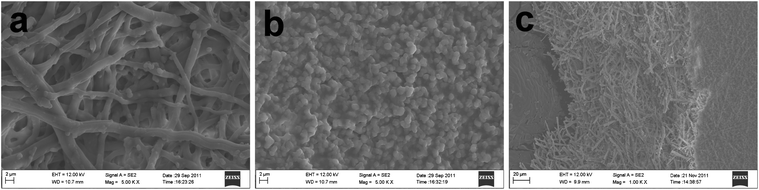 |
| | Fig. 1 FESEM images of the prepared ESM: (a) front surface; (b) back surface; (c) cross-section. | |
Table 1 Porosity and average pore diameter of ESM, macroporous Pd and CeO2-added Pd catalysts prepared via routes (i) & (ii)
| Parameters |
ESM |
Pd |
CeO2-added Pd-(i) |
CeO2-added Pd-(ii) |
| Porosity (%) |
39 |
39 |
41 |
43 |
| Pore diameter (μm) |
2.39 |
2.33 |
0.64 |
1.29 |
The Pd catalyst network derived from the ESM template is shown in Fig. 2a–c as front surface, back surface and cross-sectional views. In comparison with the ESM template shown in Fig. 1, the resultant Pd network has clearly reproduced the fibrous structure of the ESM not only with a similar fiber diameter, but also a similar porosity (39%) and average pore diameter (2.33 μm), see Table 1. This characteristic is very important for the prepared ESM-Pd to be a good catalyst for MOR as the micropores can facilitate the mass transport and increase the reaction surface area in the catalyst layer.
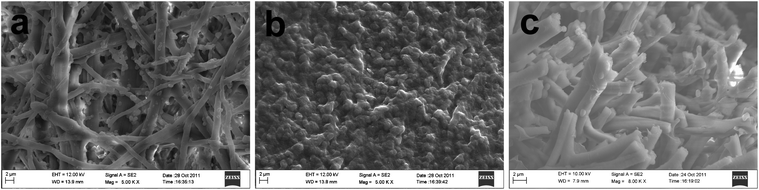 |
| | Fig. 2 FESEM images of macroporous Pd catalyst network derived from ESM template: (a) front surface; (b) back surface; (c) cross-section. | |
The microstructure of the CeO2-added Pd catalyst synthesized via route (i) is shown in Fig. 3. The CeO2 nanoparticles appear to be homogeneously dispersed on the surfaces of the Pd networks. However, agglomeration of CeO2 nanoparticles is also observed on the front surface, Fig. 3a. In contrast, the back surface is densely covered by a layer of CeO2 nanoparticles, see Fig. 3b. The entire membrane becomes much denser than that of Pd-only membrane, as suggested by the cross-sectional view shown in Fig. 3c. The slightly increased effective porosity and decreased average pore size are apparently caused by the nano-structured CeO2.
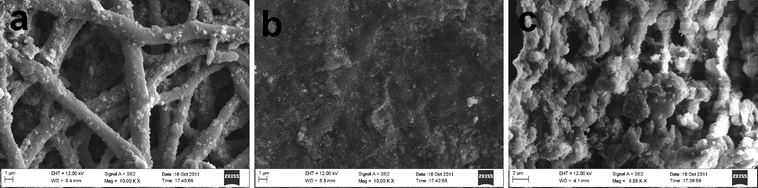 |
| | Fig. 3 FESEM images of macroporous CeO2-added Pd catalyst synthesize in route (i): (a) front surface; (b) back surface; (c) cross-section. | |
The microstructure of the CeO2-added Pd catalyst synthesized via route (ii) is completely different. Fig. 4a shows that the precipitated CeO2 form flower-like structures on the surface of the macroporous Pd network. A single CeO2 flower, as shown in Fig. 4b, has a size of 17 μm and comprises of many nano-needles with a length of ∼9 μm. These nano-needles appear to grow from a layer of CeO2 covered on Pd networks. The CeO2 hierarchical architectures of vertically aligned nano-needle arrays on the front surface of membrane are displayed in Fig. 4c. Large numbers of CeO2 nano-needles are also observed in Fig. 4d in highly oriented and vertically aligned state with high density. The area of the cross-sectional surface is about 0.5 × 2 μm2 and has a length of 12 μm. Technically, nanostructured CeO2 have attracted great attention because of their remarkable chemical/physical properties and potential applications in catalysis and energy conversion devices.33–35 Many recent efforts have also been devoted to hierarchically assembling nano-scale CeO2 building blocks, such as nanorods and nanosheets, into ordered complex hierarchical architectures, to achieve novel catalytic properties. The synthesized flower-like CeO2 architecture integrated within Pd-backbone networks in this study certainly presents a way of making abundant reactive sites in Pd(s)–CeO2(s)–methanol(l) triple-phase regions for high-performance catalysts for methanol oxidation.
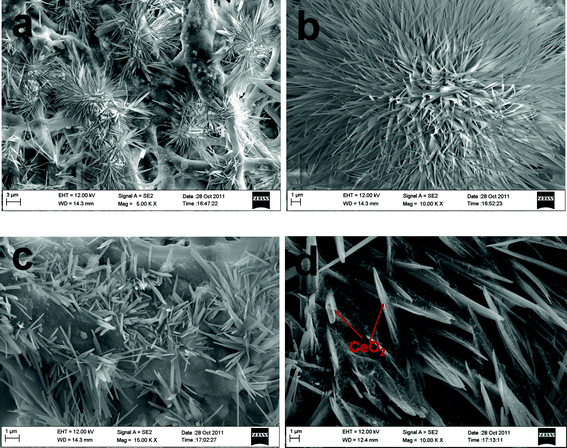 |
| | Fig. 4 FESEM images of macroporous CeO2-added Pd catalyst synthesized via route (ii): (a) front surface; (b) single CeO2 nanoflower; (c) CeO2 nanoflower-decorated Pd network; (d) back surface. | |
Structural analysis
Crystal structure and crystallinity of the synthesized macroporous Pd and CeO2-added Pd catalysts were examined by XRD and the results are shown in Fig. 5. The strong diffraction peaks of Pd catalyst are detected at 2θ = 40.4, 46.7, 68.1, and 82.3°, which corresponds to indices of (111), (200), (220), and (311) phases, respectively. For the CeO2-added Pd catalysts synthesized by routes (i) & (ii), all the characteristic peaks of CeO2 at 2θ = 28.7, 33.1, 47.5, 56.4, 59.2, 69.4, 76.9, 79.2, and 88.6°, can be indexed into (111), (200), (220), (311), (222), (400), (331), (420), and (422) of a fcc cubic structure, respectively.36 The XRD results confirm that the obtained catalysts are the only combination of CeO2 and Pd. However, the element analysis from X-ray photoelectron spectra (XPS) show that there are carbon remnants in the Pd and CeO2-added Pd catalysts (Table 2).
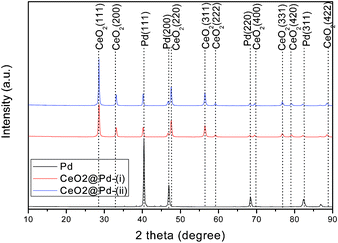 |
| | Fig. 5 XRD patterns of macroporous Pd and CeO2-added Pd catalysts synthesized via route (i) and route (ii), respectively. | |
Table 2 Comparison of elemental composition values obtained from C 1s. Pd 3d, Ce 3d, and O 1s XPS peak analyse
| Parameters |
Pd |
CeO2-added Pd-(i) |
CeO2-added Pd-(ii) |
| C |
Pd |
O |
C |
Pd |
Ce |
O |
C |
Pd |
Ce |
O |
| Atomic (%) |
37.96 |
12.14 |
49.88 |
51.49 |
1.93 |
4.57 |
42.01 |
24.15 |
15.45 |
4.18 |
56.21 |
| Mass (%) |
17.91 |
50.76 |
31.33 |
28.95 |
9.61 |
29.98 |
31.46 |
8.48 |
48.10 |
17.14 |
26.28 |
Electrocatalytic activities for methanol electro-oxidation
To examine the electrocatalytic activity of the macroporous Pd and CeO2-added Pd catalysts for MOR, we also studied the effect of electrolyte solution at room temperature: (i) a mixture of methanol and H2SO4 (0.25 M) in which the volume fraction of methanol varies among 2, 5, 10, 20, 30, 40, 50 vol%, and (ii) a 0.3 M [MIm]·H2SO4 methanol solution. Fig. 6a shows the CV curves using Pd catalyst as the working electrode and methanol-H2SO4 (0.25 M) mixture as the electrolyte solution. The forward peak at around ∼0.16 V would feature the hydrogen desorption on metallic Pd, which is caused by a dissolution of the adsorbed hydrogen into the bulk of the Pd electrodes.37 The forward current-density peak, If, at ∼0.4 V relates to the MOR whereas the backward weak current-density peak, Ib, corresponds to the oxidation of COads-like species, generated via incomplete oxidation of methanol during the forward scan.38,39 It is evident that both peak current densities depend on the concentration of methanol. Similar CV behaviors are also observed on CeO2-added Pd catalyst in Fig. 6b&c. Regardless of catalyst employed, the peak current density of MOR depends strongly on the methanol concentration in H2SO4 electrolyte solution. Fig. 6d shows If of MOR as a function of methanol concentration. It is interesting to see that If peaks at 5 vol% methanol. The observed critical concentration effect reflects the oxidation rate of each electrocatalyst, beyond which the accumulation of oxidation products adsorbed at the active sites of an electrode surface could hinder further oxidation. Evidently, CeO2-added Pd-route (ii) has a higher capability to oxidize more methanol than the other two catalysts. The observation of critical concentration effect has also been confirmed by methanol oxidation using nickel impregnated silicalite.40 The highest If of the CeO2-added Pd synthesized via route (ii) are probably a result of the formed high density of triple-phase boundary achieved by precipitation method. In ref. 17–20, it has been suggested that a strong chemical bonding such as Pd–O–Ce may exist at the interface between Pd and CeO2, which can enhance electron transfer from Pd to CeO2, leading to the acceleration of electrocatalytic kinetics.18
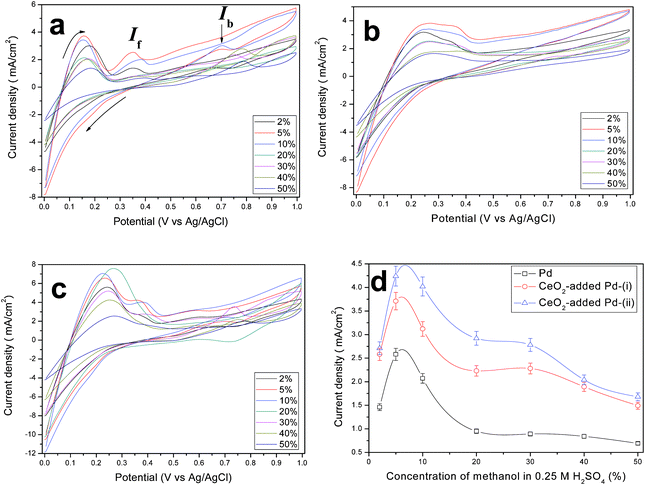 |
| | Fig. 6 CV curves of the macroporous (a) Pd, and (b) & (c) CeO2-added Pd network catalysts synthesized in route (i) and route (ii), respectively. The curves were recorded in x vol% methanol and 0.25 M H2SO4 aqueous solution and scanned from 0 to 1.0 V and back to 0 V at a scan rate of 10 mV s−1. (d) Plots of peak current density versus concentration of methanol in 0.25 M H2SO4 electrolyte solution. | |
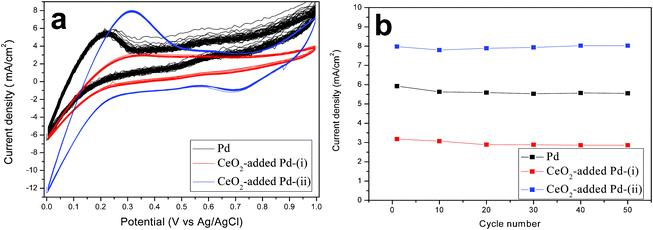
The preliminary stability of the studied catalysts in 20 vol% methanol and 0.25 M H2SO4 aqueous solution was examined by performing 50 cycles of CV scans from 0 to 1.0 V and back to 0 V at a scan rate of 50 mV s−1Fig. 7a shows all the 50 CV cycles while the stability as measured by the change in If is shown in Fig. 7b. A slight degradation is observed, indicating a high stability of the resultant electrocatalysts.
 |
| | Fig. 7 50 cycles CV curves using Pd (black) and CeO2-added Pd catalysts synthesized via route (i) (red) and (ii) (blue), respectively. The curves were recorded in 20 vol% methanol and 0.25 M H2SO4 aqueous solution and scanned from −0 to 1.0 V and back to 0 V at a scan rate of 50 mV s−1. | |
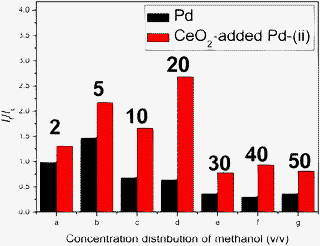
CO poisoning of precious metal electrocatalyst materials, such as Pd, is one of the key barriers to a successful commercialization of DMFC. The CO produced during the MOR occupies active sites on the Pd catalyst, thus hindering fuel oxidation. The COads-like species are mostly in the form of linearly bonded Pd–C![[double bond, length as m-dash]](https://www.rsc.org/images/entities/char_e001.gif) O. Here we use the ratio of the forward anodic peak current density to the back anodic peak current density (If/Ib) as a factor to evaluate the CO poisoning tolerance of an electrocatalyst. A large If/Ib ratio represents a more complete MOR to CO2, less accumulation of COads-like species on the catalyst surface, and thus a better CO-poisoning tolerance of Pd catalysts, vice versa for low If/Ib ratio, which has been employed in the literature.41,42 The If/Ib ratios of the Pd catalyst in Fig. 8, ranging from 0.98 at 2 vol% and 0.37 at 50 vol%, are similar but little lower than Pd/C, Pt/C and PtRu/C in previous reports.41,42 The observed ∼300% enhancements on If/Ib values of CeO2-added Pd catalysts synthesized in route (ii) over that of Pd catalyst suggests a significantly improved CO poisoning tolerance by the presence of CeO2. This is clearly attributed to the presence of CeO2. With CeO2 in the catalyst structure, CO molecules can preferentially react with CeO2 to form CO–Ce bonds rather than reacting with Pd to form Pd–CO bonds.43 Under a low potential, the electrochemical MOR on the surface of a Pd electrocatalysts can be generally described by
O. Here we use the ratio of the forward anodic peak current density to the back anodic peak current density (If/Ib) as a factor to evaluate the CO poisoning tolerance of an electrocatalyst. A large If/Ib ratio represents a more complete MOR to CO2, less accumulation of COads-like species on the catalyst surface, and thus a better CO-poisoning tolerance of Pd catalysts, vice versa for low If/Ib ratio, which has been employed in the literature.41,42 The If/Ib ratios of the Pd catalyst in Fig. 8, ranging from 0.98 at 2 vol% and 0.37 at 50 vol%, are similar but little lower than Pd/C, Pt/C and PtRu/C in previous reports.41,42 The observed ∼300% enhancements on If/Ib values of CeO2-added Pd catalysts synthesized in route (ii) over that of Pd catalyst suggests a significantly improved CO poisoning tolerance by the presence of CeO2. This is clearly attributed to the presence of CeO2. With CeO2 in the catalyst structure, CO molecules can preferentially react with CeO2 to form CO–Ce bonds rather than reacting with Pd to form Pd–CO bonds.43 Under a low potential, the electrochemical MOR on the surface of a Pd electrocatalysts can be generally described by
| | | Pd + CH3OH → Pd–CO + 4H+ + 4e− | (1) |
| | | Pd + H2O → Pd–OH + H+ + e− | (2) |
| | | Pd–CO + Pd–OH → 2Pd + CO2 + H+ + e− | (3) |
 |
| | Fig. 8
I
f/Ib ratio from macroporous Pd and CeO2-added Pd network catalysts. The curves were recorded in x = 2– 50 vol% methanol and 0.25 M H2SO4 electrolyte solution and scanned at a rate of 10 mV s−1. The peak in the backward scan at approximately 0.70 V was not observed in the CV curve of CeO2-added Pd-(i). | |
In the presence of CeO2, CO preferentially reacts with CeO2 to form a stronger CeO2–CO bond than Pd–CO; therefore, the number of CeO2–CO is much higher than Pd–CO, indicating that the reaction (7) has a larger contribution than reaction (6). The Pd–CO and CeO2–CO can be depleted by reacting with oxygen-containing species such as Pd–OH generated from H2O. In conclusion, the integration of CeO2 with Pd can effectively accelerate the depletion of Pd–CO and expose more Pd surface area for MOR via the following anodic reactions:
| | | Pd + CeO2 + 2CH3OH → Pd–CO + CeO2–CO + 8H+ + 8e− | (4) |
| | | Pd + H2O → Pd–OH + H+ + e− | (5) |
| | | Pd–CO + Pd–OH → 2Pd + CO2 + H+ + e− (minor) | (6) |
| | | CeO2–CO + Pd–OH → CeO2 + Pd + CO2 + H+ + e− (major) | (7) |
EIS has been a powerful and sensitive technique to study electrochemical kinetics, for instance, in the investigations of electro-oxidation process of methanol molecules in fuel cells.44–46 With the observed beneficial effect from CeO2 in CV studies, we have also performed EIS on the same cells for further elaboration of MOR mechanisms. Fig. 9 shows the impedance spectra measured on Pd, and CeO2-added Pd catalysts in 20 vol% methanol–0.25 M H2SO4 electrolyte from 105 to 0.1 Hz. The semicircle appearing in the intermediate frequency region corresponds to the charge transfer process, the diameter of which, corresponding to charge-transfer resistance Rct, is lowest for CeO2-added Pd-(ii), followed by CeO2-added Pd-(i) and pure Pd for the electrolyte solution, indicating enhanced charge transfer by CeO2 for MOR. The 45° slope observed at low frequency electrode spectrum in all the EIS suggests a semi-infinite diffusion process (Warburg impedance). All the observations are consistent with the results from CV measurements.
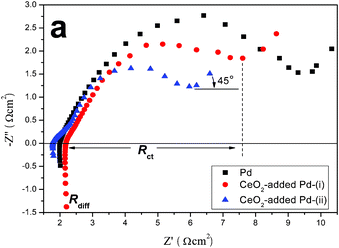 |
| | Fig. 9 Nyquist plots obtained on a Pd, and CeO2-added Pd catalysts in 20% (v/v) methanol-0.25 M H2SO4 electrolyte solution. | |
4. Conclusions
A new eggshell membrane (ESM)-templated approach to synthesizing macroporous network-structured electrocatalysts for enhanced methanol oxidation and CO tolerance has been demonstrated in this study. The synthesized Pd and CeO2-added Pd catalysts were thoroughly characterized by SEM, pore analysis, XRD, XPS, and CV. It was found that the CeO2 deposited in the ESM-templated porous Pd microstructure exhibited a flower-like morphology, resulting in large surface area for the electrochemical oxidation of methanol. Benefiting from the preferential formation of Ce–CO bond, the commonly encountered CO poisoning on Pd catalyst has been avoided and therefore a high electrocatalytic activity of Pd network has been retained for CeO2-containing Pd-based electrocatalysts. Compared to the Pd catalyst, the CeO2-added Pd catalyst synthesized by a precipitation method shows enhancement by a factor of two in current density of electro-MOR, a direct measure of electro-catalytic activity. The charge transfer kinetics is notably enhanced by combining CeO2 with Pd catalyst. Due to the unique macroporous network structure, the synthesized catalysts also showed good long-term stability. In addition, the electro-MOR involved in the synthesized catalysts were found to follow a semi-infinite diffusion-controlled mechanism with methanol–H2SO4 as the electrolyte. Overall, it was shown that the integration of Pd with CeO2 is a promising approach to synthesizing a high performance, highly stable and low-cost electrocatalyst with an excellent CO tolerance.
Acknowledgements
The authors would like to thank DARPA (W91CRB-10-1-0007) for financial support.
References
- B. C. H. Steele and A. Heinzel, Nature, 2001, 414, 345–352 CrossRef CAS.
- S. J. Guo, S. Zhang, X. L. Sun and S. H. Sun, J. Am. Chem. Soc., 2011, 133, 15354–15357 CrossRef CAS.
- Q. W. Tang, Y. Li, Z. Y. Tang, J. H. Wu, J. M. Lin and M. L. Huang, J. Mater. Chem., 2011, 21, 16010–16017 RSC.
- C. Yu, F. Jia, Z. Ai and L. Zhang, Chem. Mater., 2007, 19, 6065–6067 CrossRef CAS.
- R. Bashyam and P. Zelenay, Nature, 2006, 443, 63–66 CrossRef CAS.
- M. H. Shao, T. Huang, P. Liu, J. Zhang, K. Sasaki, M. B. Vukmirovic and R. R. Adzic, Langmuir, 2006, 22, 10409–10415 CrossRef CAS.
- F. Gallucci, F. Chiaravalloti, S. Tosti, E. Drioli and A. Basile, Int. J. Hydrogen Energy, 2007, 32, 1837–1845 CrossRef CAS.
- M. H. Shao, P. Liu, J. L. Zhang and R. Adzic, J. Phys. Chem. B, 2007, 111, 6772–6775 CrossRef CAS.
- Y. J. Wang, X. C. Wu, B. Wu and Y. Gao, J. Power Sources, 2009, 189, 1020–1022 CrossRef CAS.
- Y. H. Qin, Y. Jiang, H. H. Yang, X. S. Zhang, X. G. Zhou, L. Niu and W. K. Yuan, J. Power Sources, 2011, 196, 4609–4612 CrossRef CAS.
- H. Li, G. Sun, Q. Jiang, M. Zhu, S. Sun and Q. Xin, Electrochem. Commun., 2007, 9, 1410–1415 CrossRef CAS.
-
R. I. Masel, Chemical Kinetics and Catalysis, 2001, Wiley-Interscience, New York Search PubMed.
- P. Jasinski, T. Suzuki and H. U. Anderson, Sens. Actuators, B, 2003, 95, 73–77 CrossRef.
- S. Park, J. M. Vohs and R. J. Gorte, Nature, 2000, 404, 265–267 CrossRef CAS.
- K. Sohlberg, S. T. Pantelides and S. F. Pennycook, J. Am. Chem. Soc., 2001, 123, 6609–6611 CrossRef CAS.
- E. Lee and A. Manthiram, J. Phys. Chem. C, 2010, 114, 21833–21839 CAS.
- W. J. Shen, Y. Ichihashi, M. Okumura and Y. Matsumura, Catal. Lett., 2000, 64, 23–25 CrossRef CAS.
- W. J. Shen, Y. Ichihashi, H. Ando, M. Okumura, M. Haruta and Y. Matsumura, Appl. Catal., A, 2001, 217, 165–172 CrossRef CAS.
- Y. Matsumura, W. J. Shen, Y. Ichihashi and M. Okumura, J. Catal., 2001, 197, 267–272 CrossRef CAS.
- Y. C. Ma, Q. J. Ge, W. Z. Li and H. Y. Xu, J. Nat. Gas Chem., 2008, 17, 387–390 CrossRef CAS.
- Q. W. Tang, J. H. Wu, Z. Y. Tang, Y. Li, J. M. Lin and M. L. Huang, J. Mater. Chem., 2011, 21, 13354–13364 RSC.
- Q. W. Tang, J. H. Wu, X. M. Sun, Q. H. Li and J. M. Lin, Langmuir, 2009, 25, 5253–5257 CrossRef CAS.
- Q. W. Tang, Z. Y. Tang, J. H. Wu, J. M. Lin and M. L. Huang, RSC Adv., 2011, 1, 1453–1456 RSC.
- Q. W. Tang, L. Lin, Z. P. Mao and J. H. Wu, RSC Adv., 2012, 2, 1863–1869 RSC.
- T. X. Fan, S. K. Chow and D. Zhang, Prog. Mater. Sci., 2009, 54, 542–659 CrossRef CAS.
- H. Zhou, X. F. Li, T. X. Fan, F. E. Osterloh, J. Ding, E. M. Sabio, D. Zhang and Q. X. Guo, Adv. Mater., 2010, 22, 951–957 CrossRef CAS.
- X. F. Li, T. X. Fan, H. Zhou, S. K. Chow, W. Zhang and D. Zhang, Adv. Funct. Mater., 2009, 19, 45–56 CrossRef CAS.
- H. Zhou, T. X. Fan and D. Zhang, Chem. Mater., 2007, 19, 2144–2146 CrossRef CAS.
- T. Han, T. X. Fan, S. K. Chow and D. Zhang, PloS One, 2011, e24788 Search PubMed.
- J. E. Dennis, D. A. Carrino, K. Yamashita and A. I. Caplan, Matrix Biol., 2000, 19, 683–692 CrossRef CAS.
- R. Shoji, T. Miyazaki, T. Niinou, M. Kato and H. Ishii, J. Mater. Cycles Waste Manage., 2004, 6, 142–146 CrossRef CAS.
- C. Y. Shao, B. Yuan, H. Q. Wang, Q. Zhou, Y. L. Li, Y. F. Guan and Z. X. Deng, J. Mater. Chem., 2011, 21, 2863–2866 RSC.
- R. B. Yu, L. Yan, P. Zheng, J. Chen and X. R. Xing, J. Phys. Chem. C, 2008, 112, 19896–19900 CAS.
- H. F. Li, G. Z. Lu, Y. Q. Wang, Y. Guo and Y. L. Guo, Catal. Commun., 2010, 11, 946–950 CrossRef CAS.
- F. H. Niu, D. S. Zhang, L. Y. Shi, X. Q. He, H. R. Li, H. L. Mai and T. T. Yan, Mater. Lett., 2009, 63, 2132–2135 CrossRef CAS.
- M. Faisal, S. B. Khan, M. M. Rahman, A. Jamal, K. Akhtar and M. M. Abdullah, J. Mater. Sci. Technol., 2011, 27, 594–600 CAS.
- K. Lee, O. Savadogo, A. Ishihara, S. Mitsushima, N. Kamiya and K. Ota, J. Electrochem. Soc., 2006, 153, A20–A24 CrossRef CAS.
- S. Sharma, A. Ganguly, P. Papakonstantinou, X. Miao, M. Li, J. L. Hutchison, M. Delichatsios and S. Ukleja, J. Phys. Chem. C, 2010, 114, 19459–19466 CAS.
- R. Manohara and J. B. Goodenough, J. Mater. Chem., 1992, 2, 875–887 RSC.
- M. W. Khalil, M. A. A. Rahim, A. Zimmer, H. B. Hassan and R. M. A. Hameed, J. Power Sources, 2005, 144, 35–41 CrossRef CAS.
- J. C. Huang, Z. L. Liu, C. B. He and L. M. Gan, J. Phys. Chem. B, 2005, 109, 16644–16649 CrossRef CAS.
- M. M. Dimos and G. J. Blanchard, J. Phys. Chem. C, 2010, 114, 6019–6026 CAS.
- A. Holmgren, B. Andersson and D. Duprez, Appl. Catal., B, 1999, 22, 215–230 CrossRef CAS.
- E. Lee, I. S. Park and A. Manthiram, J. Phys. Chem. C, 2010, 114, 10634–10640 CAS.
- S. Ghosh and C. R. Raj, J. Phys. Chem. C, 2010, 114, 10843–10849 CAS.
- C. Liao, Z. D. Wei, S. G. Chen, L. Li, M. B. Ji, Y. Tan and M. J. Liao, J. Phys. Chem. C, 2009, 113, 5705–5710 CAS.
|
| This journal is © The Royal Society of Chemistry 2012 |
Click here to see how this site uses Cookies. View our privacy policy here.