DOI:
10.1039/C2RA21703A
(Communication)
RSC Adv., 2012,
2, 11664-11667
Evaporation enhancement from surface heating
Received
6th August 2012
, Accepted 28th September 2012
First published on 2nd October 2012
Abstract
Evaporation is observed when heat conducts from the interface to the gas and liquid phases at a heated flat surface by two aligned heating elements. The average evaporation flux is significantly higher than that while the water surface is heated below under the same power input. To demonstrate the energy transport at an interface with zero cross-section area from a high-temperature position to a low-temperature position, a thermodynamic model is derived from the Gibbs dividing-surface approximation. The measurement shows that the interfacial temperature is up to 6.9 °C higher at the heating wires than that at the centerline between the two heating wires as the liquid is heated at the surface. The induced interfacial flow can transport energy to maintain the evaporation by overtaking negative thermal conduction to the evaporating interface globally.
A fundamental question remains in evaporation theory even though evaporation has been studied for over 100 years. Marek and Straub pointed out that evaporation coefficients differed by several orders in magnitude under similar experimental conditions.1 This significant variation might come from the experimental uncertainty affected by contact line motion, thermal conduction, temperature discontinuity across the interface, or hydrodynamic instabilities, including buoyancy-driven convection, thermocapillary convection, and vapor–liquid interface movement.2–10 Among them, thermocapillary convection at the interface and positive thermal conduction to the interface were found to improve evaporation in recent steady-state experiments at spherical and cylindrical interfaces11–15, if the other factors, including vapor–liquid interface movement, buoyancy-driven convection, and contact line motion, were eliminated in confined containers under steady-state evaporation conditions. A measurable temperature gradient was found at the evaporating interface after the thermocapillary convection transition. The thermocapillary convection flow transported up to 40% of the energy for evaporation at the vapor–water interface.11–13,15 The interesting point was how energy transport occurred at an evaporating interface with almost zero cross-sectional area by convection from the high-temperature edge to the low-temperature position. By applying the Gibbs dividing-surface approximation11,12,16 at the curved interfaces, the surface-thermal capacity, cσ, was experimentally determined with a value of 30.6 ± 0.8 kJ m−2 K−1 for water (H2O) and 32.5 ± 0.8 kJ m−2 K−1 for heavy water (D2O).11,13 In this paper, the authors design a new setup for global negative thermal condition to the interface from both liquid and gas phases in order to explain the importance of interfacial flow energy transport at a flat evaporating surface.
The overall experimental apparatus is illustrated in Fig. 1. Equal-length heating wires with a diameter of 0.125 mm were installed as a pair in parallel at both the top and 5 mm lower than the top of a poly(methyl methacrylate) (PMMA) evaporation chamber (15 mm in length, 10 mm in width, and 15 mm in height). Deionized water was supplied in the evaporation chamber by a syringe mounted on a syringe pump at room temperature. Simultaneously, the heating wires were electrified at Level 0 (top) or Level 1 (5 mm below). The heat from the pair of elements was provided by a power supplier at a predetermined voltage and current listed in Table 1. The level of water surface was regulated at the top edge of the container, as shown in Fig. 2, by adjusting the pumping rate of the syringe pump. The experiments were conducted in a laboratory with the temperature at 25 °C and the relative humidity at 40%. Under steady state, the water surface level, which was monitored by a microscope, the heating wire power supply, and the syringe pump rate were maintained at constant levels during the measurement. The three U-shaped calibrated K-type thermocouples (TCs; 25 μm in diameter) mounted on a positioner are shown in Fig. 2. The thermocouples were arranged at different heights. Since the water surface was flat, the junction of the middle thermocouple was positioned to be just submerged at the water surface for each experiment. Thus, the top thermocouple (about 2.5 mm above the junction of the middle thermocouple) was in the gas phase, and the bottom thermocouple (about 2.5 mm below the junction of the middle thermocouple) was in the liquid phase. The thermocouples were moved manually across the water surface. As shown in Fig. 2, the thermocouples were moved from one side of the container to the other side at approximately 0.3 mm intervals. The readings for each position were recorded for about 10 s. The mean temperature was then calculated. Two series of steady-state experiments were conducted: (1) the top pair of heating wires at Level 0 were maintained at 0.5, 1.0, 1.5, 2.0, 2.5, and 3.0 V respectively, and (2) the pair of heating wires with 5 mm below the water surface at Level 1 were maintained at 0.5, 1.0, 1.5, 2.0, 2.5, and 3.0 V respectively during water evaporating. In each of the experiments, the water evaporation rate, J, was recorded at the syringe pump with an accuracy at ±0.5%. Then the average evaporation flux, ![[j with combining macron]](https://www.rsc.org/images/entities/i_char_006a_0304.gif) ev = J/area, where area is the evaporating flat surface area. The calculated values are listed in Table 1.
ev = J/area, where area is the evaporating flat surface area. The calculated values are listed in Table 1.
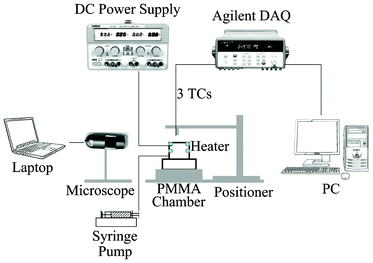 |
| | Fig. 1 Sketch of evaporation apparatus. Two pairs of heating elements were aligned in the evaporation chamber at Level 0 (top) and Level 1 (5 mm lower). The temperatures at the gas phase, interface, and liquid phase were measured with the three calibrated thermocouples. | |
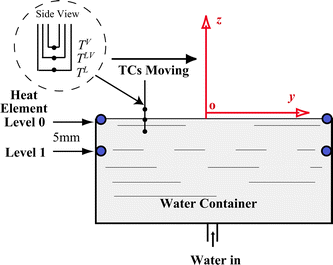 |
| | Fig. 2 Levels 0 and 1 of the heating wires are shown when the evaporating water surface is maintained at the top edge of the chamber. The temperatures were measured in the gas phase (TV), interface (TLV), and liquid phase (TL) under steady-state evaporation. The evaporating surface element in Cartesian coordinates for mass and energy analyses. The U-shaped K-type TCs are shown in the insert. | |
Table 1 Summary of the experimental conditions in steady-state evaporation
| Exp: |
Heating wire |
Heating wire |
Heating wire |
ev
|
| |
level |
Voltage/(V) |
Current(A) |
(g m−2 s−1) |
| E1 |
Level 0 |
0.5 |
0.05 |
0.133 ± 0.007 |
| E2 |
Level 0 |
1.0 |
0.10 |
0.266 ± 0.013 |
| E3 |
Level 0 |
1.5 |
0.13 |
0.599 ± 0.030 |
| E4 |
Level 0 |
2.0 |
0.22 |
0.931 ± 0.047 |
| E5 |
Level 0 |
2.5 |
0.28 |
1.197 ± 0.060 |
| E6 |
Level 0 |
3.0 |
0.31 |
1.596 ± 0.080 |
| E7 |
Level 1 |
0.5 |
0.05 |
0.100 ± 0.005 |
| E8 |
Level 1 |
1.0 |
0.11 |
0.133 ± 0.007 |
| E9 |
Level 1 |
1.5 |
0.14 |
0.173 ± 0.009 |
| E10 |
Level 1 |
2.0 |
0.23 |
0.200 ± 0.010 |
| E11 |
Level 1 |
2.5 |
0.30 |
0.279 ± 0.014 |
| E12 |
Level 1 |
3.0 |
0.34 |
0.399 ± 0.020 |
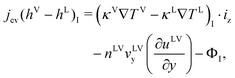
As shown in Table 1 for the steady-state experiments from E1 to E12, the average evaporation flux of E1 has a value of 0.133 g m−2 s−1 at Level 0, while E7 has a value of 0.100 g m−2 s−1 at Level 1 under the same power input from the heating wires. The difference in the average evaporation rate is about 33%. The average evaporation flux in E6 is 1.596 g m−2 s−1, but it is 0.399 g m−2 s−1 in E12 under similar conditions. The ratio of E6 to E12 is about 4 times. The results indicate an interesting physical phenomenon: the average evaporation fluxes are higher when the heating is at Level 0 than those at Level 1 for the same power input. The ratio of the evaporation fluxes at both heating levels increases with an increase in electric power input. The temperature distribution for the pair of experiments E1 and E7 is illustrated in Fig. 3 while that for E6 and E12 is in Fig. 4. As shown in Fig. 3, the temperatures in the liquid phase (TL), interface (TLV), and gas phase (TV) are approximately uniform over the water surface. However, TLV is 25.6 °C when the heating wires are at Level 0, which is higher than that at Level 1 (23.8 °C). In Fig. 4, although TLV is relatively uniform at 26.1 °C with a deviation of 0.12 °C (lower than that in the liquid phase) when the heating is at Level 1, TLV with the heating wires at Level 0 is more parabolic. As illustrated in Fig. 3 and 4, with the heating at Level 0 (the water surface), TLV is higher than TL, while it is also higher than TV. Thus, thermal conduction in both phases would take energy away from the water surface globally, for the cases when the heating is at the water surface. Thus, in the experiments, buoyancy-driven convection in the liquid phase would be absent because the lighter water at the higher TLV is on top of the denser bulk liquid. If energy transport by the air flow is negligible, the main energy for evaporation should be from the convection. In addition, the ratio of the heating elements (0.125 mm in diameter) to the water surface width (10 mm) is almost zero. The cross-sectional area is almost zero at the interface for thermal conduction if the temperature variation is at the interface. Therefore, as the kinetic energy and viscous dissipation at the interface (I) are negligible, the local evaporation flux can be calculated from the conventional Stefan condition17,18jev = [(κV∇TV − κL∇TL)I · in]/(hV − hL)I, where in is the normal direction to the evaporation interface, (hV − hL)I is the enthalpy change in evaporation with a positive value. Consequentially, the negative value in the right side of the above equation should lead to condensation globally, contrary to our observations in the experiments. On the other hand, when the heating is at Level 1, 5 mm below the water surface, TLV in Fig. 3 and 4 is lower than TL. Thermal conduction in the liquid phase would improve evaporation by conducting more energy to the surface from the liquid phase in comparison with the conditions heating at Level 0. However, the average evaporation flux at Level 1 is smaller than that at Level 0 at the same relative electric power input. To clarify the contradiction, we have to pay more attention to the interface. The measured TLV along the water surface shows a significant temperature variation at the water surface in Fig. 4. TLV at the heating elements is higher than that at the centerline between the two heating elements. The average temperature difference between the periphery and the centerline is about 6.9 °C. Consequently, a large interfacial temperature variation can result in an interfacial flow due to a surface tension difference.11–15 The interfacial flow should enhance energy transport from the “hot” heating wires to the “cold” place at the water surface, as seen in the phenomena with higher average evaporation fluxes occurring at Level 0. To describe the process, the mass and energy balances are derived in Cartesian coordinates at a flat evaporating surface element as shown Fig. 2 on the basis of the Gibbs dividing-surface approximation.16 The system in the analysis includes three phases, liquid phase (L), gas phase (V), and interface (LV or I).
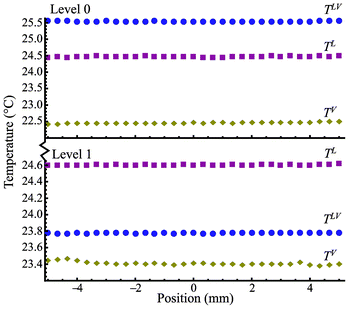 |
| | Fig. 3 The temperature distribution at the gas phase (TV), interface (TLV), and liquid phase (TL) as a function of position with the heating at Level 0 and Level 1 for E1 and E7. | |
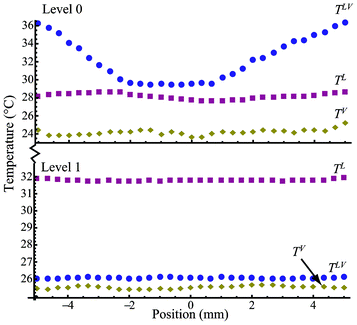 |
| | Fig. 4 The temperature distribution at the gas phase (TV), interface (TLV), and liquid phase (TL) as a function of position with the heating at Level 0 and Level 1 for E6 and E12. | |
Under steady-state evaporation, no net changes in the number of moles are assumed in the evaporating surface element,
| | | (nLvL)I·iz = (nVvV)I·iz + ∇(nLVvLV)·ix + ∇(nLVvLV)·iy | (1) |
, where
n and
v are the density and velocity in each of three phases,
ix and
iy are in x- and y- directions. The steady-state
evaporation flux,
jev, can be expressed as,
| | | jev = (nLvL)I·iz = (nVvV)I·iz | (2) |
The conservation of energy requires the energy being transported into the surface element to equal the sum of those leaving and being dissipated by viscosity at the surface, ΦI. Thus, we have,
| | | (nLhLvL − κL∇TL)I·iz = (nVhVvV − κV∇TV)I·iz + [nLVvLV(∇uLV) + uLV∇(nLVvLV)]·ix + [nLVvLV(∇uLV) + uLV∇(nLVvLV)]·iy + ΦI | (3) |
where
uLV is the specific internal energy per mole, and
duLV =
TLVdsLV +
γLVdαLV if the gas phase is assumed not to be dissolved in
water,
sLV is the intensive surface entropy per mole,
γLV is the surface tension, and
αLV is the intensive surface area per mole (=1/
nLV). A Helmholtz function,
fLV ![[triple bond, length as m-dash]](https://www.rsc.org/images/entities/char_e002.gif) uLV
uLV −
TLVsLV, would have
fLV =
fLV (
TLV,
αLV). Since
sLV also has the same independent variables as
fLV,
uLV =
uLV (
TLV,
αLV).
If any variations in vLV, uLV, and TLV are neglected as a function of the position in the x-direction at the evaporating element as shown in Fig. 2, we have eqn (4) after eqn (3) is simplified,
| |  | (4) |
where,
| | 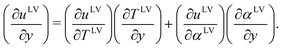 | (5) |
The changes in αLV as a function of position are negligible at the interface at the steady-state condition, eqn (4) is then expressed as,
| | 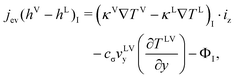 | (6) |
where

,
11 the surface-thermal capacity has been determined from the experiments at the spherical and cylindrical interfaces
11,12 with a value of 30.6 ± 0.8 kJ m
−2 K
−1 for
water, and there was not a negligible value for energy transport at the interface once there was a flow.
As indicated in eqn (6), the evaporation flux is determined by the local thermal conduction to the interface from both the liquid and gas phases, the local interfacial viscous dissipation, and the local interfacial flow at vLVy, which can be induced by the surface tension variation due to the interfacial temperature difference. The local velocity at the interface has not been determined yet. However, if the velocity at the interface is assumed to be mainly generated by the surface tension gradient by overcoming the viscosity shear stress, the thermocapillary convection velocity would have a proportional relation to the temperature gradient from the high interfacial temperature (at the heating wires) to the low temperature (at the centerline of the pair of wires).12,19 Since the thermocapillary convection flow is always opposite to the temperature gradient at the evaporating interface, the term  would be positive to enhance evaporation. Therefore, we can use the thermodynamic model to analyze the steady-state experiments qualitatively. In the experiments at Level 0, only the interfacial flow supplied energy to increase the evaporation, since thermal conduction to the interface from both liquid and gases phases was negative, and the possible viscous dissipation would reduce the energy for evaporation at the interface as well. An increase of the interfacial temperature gradients and/or the interfacial flow velocities would increase the evaporation flux. The average interfacial temperature variation was 0.03 °C in E1 and 6.89 °C in E6 between the heating wires and the centerline of the two elements. As a result, the average evaporation flux increased from 0.133 g m−2 s−1 in E1 to 1.596 g m−2 s−1 in E6. However, in the experiments at Level 1, the average interfacial temperature variation was 0.02 °C of E7 and 0.12 °C of E12. As shown in Fig. 5, the average evaporation flux is much lower than the counterpart experiment, e.g. evE12 < evE6, even though the energy for evaporation can be supplied more to the interface by thermal conduction from the liquid phase in the z-direction with the heating at Level 1. Therefore, thermocapillary convection should transport energy to enhance the evaporation at the interface with the heating at Level 0.
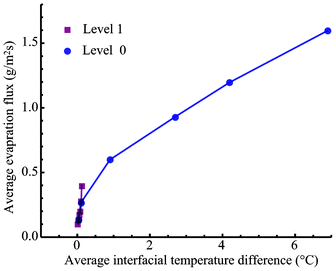 |
| | Fig. 5 The average evaporation flux as a function of the average interfacial temperature variation with the heating at Level 1 and at Level 0. | |
In summary, the experimental study demonstrates that a larger interfacial temperature gradient with heating at a flat water surface can enhance the evaporation. The result qualitatively agrees with the thermodynamic analysis on which an interfacial flow from a high-temperature position to a low-temperature position can supply sufficient energy for evaporation by overtaking negative thermal conduction to the interface from the liquid and gas phases, or possibly interfacial viscous dissipation. A detailed analysis will be performed on the basis of further measurement of the interfacial flow to elucidate the heat transfer effects at an evaporating interface in the future.
Acknowledgements
The authors acknowledge the support of MOE Tier 1 in Singapore. The acknowledgement is also for the experimental support from the two final year project undergraduate students, Eric Teo and Vivien Tan.
References
- R. Marek and J. Straub, Int. J. Heat Mass Transfer, 2001, 11, 39 CrossRef.
- R. D. Deegan, O. Bakajin, T. F. Dupont, G. Huber, S. R. Nagel and T. A. Witten, Nature, 1997, 389, 827 CrossRef CAS.
- H. K. Cammenga, D. Schreiber, G. T. Barnes and D. S. Hunter, J. Colloid Interface Sci., 1984, 98, 585 CAS.
- X. Xu and J. Luo, Appl. Phys. Lett., 2007, 91, 124102 CrossRef.
- W. D. Ristenpart, P. G. Kim, C. Domingues, J. Wan and H. A. Stone, Phys. Rev. Lett., 2007, 99, 234502 CrossRef CAS.
- D. J. Harris, H. Hu, J. C. Conrad and J. A. Lewis, Phys. Rev. Lett., 2007, 98, 148301 CrossRef.
- F. Duan, C. A. Ward, V. K. Badam and F. Durst, Phys. Rev. E: Stat., Nonlinear, Soft Matter Phys., 2008, 78, 041130 CrossRef.
- F. Duan, I. Thompson and C. A. Ward, J. Phys. Chem. B, 2008, 112, 8605 CrossRef CAS.
- I. Thompson, F. Duan and C. A. Ward, Phys. Rev. E: Stat., Nonlinear, Soft Matter Phys., 2009, 80, 056308 CrossRef.
- F. Girard, M. Antoni and K. Sefiane, Langmuir, 2008, 24, 9207 CrossRef CAS.
- F. Duan and C. A. Ward, Phys. Rev. E: Stat., Nonlinear, Soft Matter Phys., 2005, 72, 056302 CrossRef.
- F. Duan, V. K. Badam, F. Durst and C. A. Ward, Phys. Rev. E: Stat., Nonlinear, Soft Matter Phys., 2005, 72, 056303 CrossRef.
- F. Duan and C. A. Ward, Phys. Rev. E: Stat., Nonlinear, Soft Matter Phys., 2005, 72, 056304 CrossRef.
- F. Duan, J. Phys. D: Appl. Phys., 2009, 42, 102004 CrossRef.
- F. Duan and C. A. Ward, Langmuir, 2009, 25, 7424 CrossRef CAS.
-
(a) J. Willard Gibbs, Trans. Conn. Acad. Arts Sci., 1876, 3, 108 Search PubMed;
(b) in The Scientific Papers of J. Willard Gibbs, edited by H. A. Bumstead and R. G. Van Name (Dover, New York, 1961), Vol. 1, p. 219 Search PubMed.
-
L. E. Sissom and D. R. Pitt, Elements of Transport Phenomena (McGraw-Hill, Toronto, 1972), p. 655 Search PubMed.
- J. Stefan, Ann. Phys. Chem., 1891, 42, 269 Search PubMed.
- E. Verneuil, M. L. Cordero, F. Gallaire and C. N. Baroud, Langmuir, 2009, 25, 5127 CrossRef CAS.
|
| This journal is © The Royal Society of Chemistry 2012 |
Click here to see how this site uses Cookies. View our privacy policy here.