Nonlinear resonances in electrochemical SERS of SCN−, rotation-resolved Raman and anti-Stokes Raman of SCN− in HV-TERS
Yongqing
Li†
ac,
Peijie
Wang†
b,
Zhenglong
Zhang
*c,
Yuanzuo
Li
d,
Fengcai
Ma
a and
Mengtao
Sun
*c
aDepartment of Physics, Liaoning University, Shenyang, P. R. China
bBeijing Key Laboratory of Nano-Photonics and Nano-Structure, Department of Physics, Capital Normal University, Beijing, P. R. China
cBeijing National Laboratory for Condensed Matter Physics, Institute of Physics, Chinese Academy of Sciences, P. O. Box 603-146, Beijing, 100190, P. R. China. E-mail: mtsun@aphy.iphy.ac.cn; zhenglongzhang@iphy.ac.cn
dCollege of Science, Northeast Forestry University, Harbin, 150040, P. R. China
First published on 19th October 2012
Abstract
We experimentally report nonlinear enhanced Raman spectra (NLERS) at high excited states, using SERS and TERS. The Darling–Dennison resonance, Sun–Wang resonance in SERS and rotation-resolved Darling–Dennison resonance in TERS in high vacuum were successfully observed, due to the strong anharmonicity, which promote deeper understanding of NLERS.
Surface-enhanced Raman scattering (SERS) and tip-enhanced Raman spectroscopy (TERS) are widely used in chemistry, biology, physics, and materials science, because they can enhance the inherently low Raman scattering cross sections of molecules, even at the level of single molecules.1–9 However, some unexpected “additional” peaks can not be easily assigned theoretically in these enhanced Raman spectra, which severely blind the broad application of this finger print analysis technology. These “additional” Raman peaks result from different mechanisms, and it is a great challenge to distinguish them. For example, Fermi resonance,10 Darling–Dennison resonance11 and Coriolis coupling12 can result in appearances of the overtone and/or combinational modes in enhanced Raman spectroscopy, due to the strong anharmonicity of molecular vibrations. These nonlinear high-order “additional” Raman peaks can usually be observed at high excited states. The most famous example is the high-order resonance vibrational spectrum of H2O at a high excited state (see Fig. 1 in ref. 12). The resonance effect on the off-diagonal matrix elements of Fermi and Darling–Dennison resonances can be seen from eqn 7 in ref. 13, and the Coriolis coupling is also involved in eqn 7(c). The electric gradient effect can also result in the activity of IR modes in TERS,8 and NSOM-Raman.14
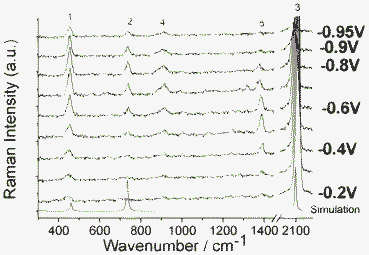 | ||
| Fig. 1 The Raman spectra of SCN− in solution and its SERS spectra on Ag electrode with applied voltage from −0.2 V to −0.95 V vs. SCE. See text for the assignments of band 1, 2, 3, 4 and 5. | ||
To clearly interpret these unexpected “additional” Raman peaks, the polyatomic molecule should be small enough, but S or N atoms should be involved for molecules being adsorbed on substrates. SCN− is the best candidate, because it is almost the smallest linear polyatomic molecule, and there are free degrees of 3N − 5 (N is numbers of atoms). So, there should be only four fundamental Raman peaks in the enhanced Raman spectroscopy. They are the S–C stretching mode, the C–N stretching mode, and two bending modes. Since two bending modes are degenerated, there are only three clear fundamental Raman peaks. Other “additional” Raman peaks should be nonlinear Raman peaks in the enhanced Raman peaks. In this communication, we try to interpret these observed nonlinear Raman peaks of SCN− in SERS and TERS. The detailed experimental processes and theoretical calculations are described in the last section.
Fig. 1 shows the SERS spectra of SCN− along with the simulated Raman spectrum. Bands at 1, 2 and 3 are assigned as the two degenerated SCN-bend (453 cm−1), S–C (737 cm−1) and C–N stretching motion (2082 cm−1), respectively, which are the fundamental Raman modes. These four fundamental vibrational modes can be seen in Fig. 2. In Fig. 1, it is found that there are two additional Raman peaks around 906 and 1383 cm−1, which are strongly dependent on electrode voltages.
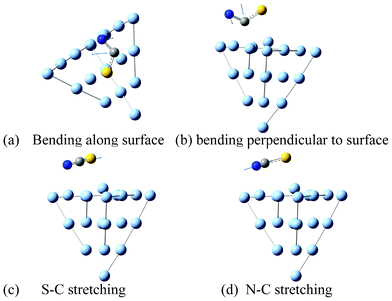 | ||
| Fig. 2 Vibrational modes of SCN− adsorbed on a Ag surface. | ||
The 906 cm−1 band can be assigned as overtone modes of two degenerated SCN− bending modes, which perturbed each other due to Darling–Dennison resonance. Shown in Fig. 1 are also their intensity variations (the intensity of band 5 at −0.3 V is scaled as 100). These intensities attain their maxima at −0.75 V and drop greatly (up to 60%) as the voltage reaches −0.95 V. At −0.95 V, the frequency of the overtone band at 906 cm−1, is exactly twice that of the fundamental at 453 cm−1, while in other voltages, there is a deviation. Note that the 905 cm−1 becomes very broad, weak and noisy at −0.95 V; the measurement of the band position is not straightforward, and it is sustained by citing spectra that were present at higher intensity. It is shown that in SERS on a Ag electrode, the mechanism for the interaction of overtones is manipulated by the effect from the Ag surface. To further confirm that, we measured the Raman spectrum of a KSCN crystal (see Fig. 3). It is found that the two degenerated overtone modes are well split in Fig. 3. The shifts of Raman peaks result from the interaction between the molecule and substrate at different potentials, which is not caused by the Stark effect, since its fundamental frequency at 451 cm−1 is not shifted by the Stark effect. It would not be easy to accommodate wavenumber shifts into the non-linear resonance mechanisms.
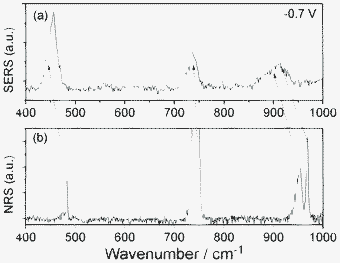 | ||
| Fig. 3 (a) SERS of SCN− adsorbed on Ag film, and (b) normal Raman scattering (NRS) of KSCN crystal. | ||
We also plot the potential dependent SERS intensity at 906 cm−1, see Fig. 4, where the intensities were taken from Fig. 1. It is found that at −0.7 V, the Darling–Dennison resonance is strongest.
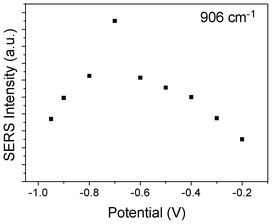 | ||
| Fig. 4 Potential dependent SERS intensity of SCN− adsorbed on Ag film at 905 cm−1. | ||
The assigned Raman peak 5 in Fig. 1 is the Sun–Wang resonance peak, where the two degenerated combination modes of peak 5 results from the sum of frequencies of two fundamental bending modes and their individual first-overtone modes, respectively. The mechanism of Sun-Wang resonance can be seen from Fig. 5. The shifts of Raman peak 5 result from the shift of their individual first-overtone modes around 906 cm−1, which is not caused by the Stark effect, since its fundamental frequency at 451 cm−1 is not shifted by the Stark effect. It would not be easy to accommodate wavenumber shifts into the non-linear resonance mechanisms.
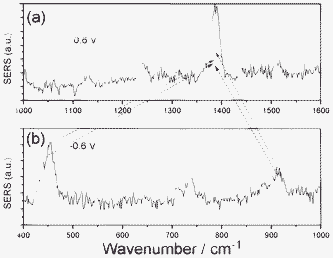 | ||
| Fig. 5 The mechanism of Sun–Wang resonance. | ||
We also plot the potential dependent SERS intensity at 1383 cm−1, see Fig. 6, where the intensities are taken from Fig. 1. It is found that at −0.5 and −0.6 V, the Sun–Wang resonance is strongest.
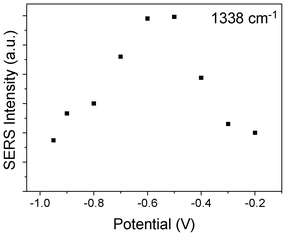 | ||
| Fig. 6 Potential dependent SERS intensity of SCN− adsorbed on Ag film at 1383 cm−1. | ||
It is interesting to study the overtone mode of S–C fundamental stretching mode at 737 cm−1 in SERS, but it cannot be observed in Fig. 1. The reason is that there is no fundamental mode near 1474 cm−1 for the perturbation of Fermi resonance. There is no degenerated fundamental modes near 737 cm−1 for Darling–Dennison resonance. To observe the overtone mode of the S–C stretching mode, the rotation-resolved Raman spectra should be observed, then the degenerated rotation-resolved stretching modes can be frequency doubled, then their degenerated rotation-resolved overtone modes can be resonance, then can be observed experimentally. Fig. 1 was measured in liquid, therefore the rotation-resolved spectra can not be obtained. To observe the overtone of S–C stretching modes, we measured the TER spectrum of SCN− adsorbed on Ag substrate in high vacuum (see Fig. 7). It is found that the rotation-resolved Raman peaks can be clearly observed, due to the rotation-resolved Darling–Dennison resonance. Due to the Coriolis coupling,14 the energy difference between different rotational energy levels can not be simply estimated with 2BJ.
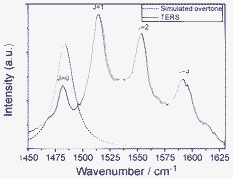 | ||
| Fig. 7 TER and simulated overtone spectra. | ||
To reveal the origin of nonlinear resonances in electrochemical SERS of SCN− in Fig. 1 and rotation-resolved Raman of SCN− in HV-TERS in Fig. 7, we measured the SERS spectrum of SCN− adsorbed on Ag film at ambient conditions (see Fig. 8). It is found that the Darling–Dennison resonance at 920 cm−1 can be obtained, while the rotation-resolved Raman of SCN− can not be observed experimentally. So, the rotation-resolved Raman should be induced by the tip and/or high vacuum in HV-TERS.
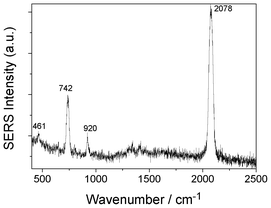 | ||
| Fig. 8 The SERS spectrum of SCN− adsorbed on Ag film. | ||
By exploring the advantages of anti-Stokes HV-TERS at low frequencies,15 we studied the interaction between molecule and metal at low frequencies. There are five Raman peaks in Fig. 9. Theoretical calculations revealed the vibrational modes of the molecule and substrate interaction, which (from low to high frequencies) can be seen from Fig. 10.
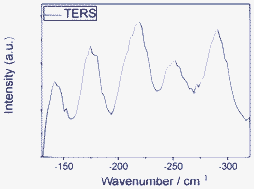 | ||
| Fig. 9 Anti-Stokes TERS at low frequencies in high vacuum. | ||
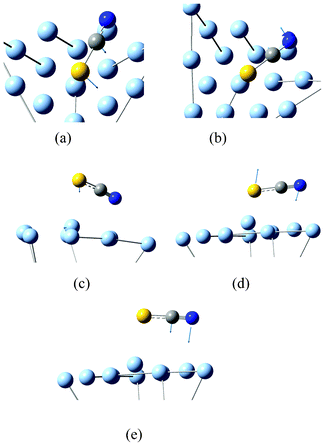 | ||
| Fig. 10 Modes of molecule and substrate interaction at low frequencies. | ||
In summary, due to strong anharmonicity, NLERS were experimentally obtained, including overtone modes, combinational modes and rotation-resolved overtone modes, observed in SERS and TERS under high vacuum, respectively. There are many more Raman peaks than the fundamental modes, and provide more information for finger print analysis. So, these unexpected “additional” nonlinear Raman spectra can be rationally interpreted, and have extended the application of NLERS in the application of enhanced Raman spectroscopy in the fields of chemistry, biology, physics, and materials science.
Experimental and theoretical details
Our experiment was typical. The Raman spectra were recorded with a Renishaw R-2000 micro-spectrophotometer equipped with a CCD detector. A 50× long working-length objective was used to perform a 180° backward scattering configuration. The excitation source was the 514 nm line of a Spectral-Physics Ar+ laser. The power of the laser on the sample was about 4 mW. The slit-width was 25 μm and the integral time was 20 s.A tri-electrode cell was used to perform the oxidation-reduction cycles (ORCs). The working electrode was a Ag plate with 99.9% purity. A saturated calomel electrode was employed as the reference and a platinum wire was employed as the counter electrode. All chemicals were of analytical grade and all solutions were prepared using triply distilled water. The electrode potential was controlled with a HDV-7 potentiostat made in China.
The Ag electrode surface was first mechanically polished using alumina powder of particle size about 0.5 μm and then washed with distilled water before it was mounted in the cell filled with 0.1 M KCl solution. Several ORCs were performed with a double potential step: −0.2 V to +0.3 V, kept for 30 s at +0.3 V and then back to −0.2 V. This ex-situ pretreatment was performed to form a relatively stable silver surface which could sustain rather constant Raman intensity for measurement. After this, the Ag electrode was immersed in a solution of 0.1 M KSCN with KCl for SER measurement.
The SER intensities were corrected by an intensity-correction file attached to the data acquisition system of the Raman spectrophotometer in order to avoid (1) differing responses of the CCD detector in different spectral regions; (2) differing spectral widths in different spectral regions for a geometrically fixed slit width. A Renishaw G97947 white light source (10 W, 1400–20![[thin space (1/6-em)]](https://www.rsc.org/images/entities/char_2009.gif) 000 cm−1) was used as the signal to generate a reference. By comparing the reference spectrum with the standard spectrum of the white light source provided by Renishaw, the intensity-correction file was generated. We estimate that the corrected SER intensities are of uncertainty less than 20%.
000 cm−1) was used as the signal to generate a reference. By comparing the reference spectrum with the standard spectrum of the white light source provided by Renishaw, the intensity-correction file was generated. We estimate that the corrected SER intensities are of uncertainty less than 20%.
TER spectra were measured with a home-built HV-TERS setup.9 The pressure in the chamber is about 10−7 Pa. A gold tip with a radius of about 50 nm was made by electrochemical etching of a 0.25 mm diameter gold wire.16 The substrate was prepared by evaporating 100 nm silver film to a newly cleaned mica film under high vacuum. The film was immersed in 1 × 10⁻⁵ M KSCN in ethanol solution for 24 h, and then washed with ethanol for 10 min to guarantee that there was only one monolayer of molecules adsorbed on the silver film. Then the sample was immediately put into the high vacuum chamber. To get a good signal-to-noise ratio, the TERS signals were collected with an acquisition time of 40 s and accumulated 20 times for each spectrum. We also measured normal Raman scattering spectra of KSCN powder, and ambient SERS of SCN− adsorbed on Ag film at a concentration of 10−4 M, using Leica microscopy equipment in a confocal Raman spectroscopic system (Renishaw, Invia), and the incident wavelength is 632.8 nm.
Theoretical simulations were done with density functional theory,17 B3LYP functional,18 6-31G(d) basis for S, C and N, LANL2DZ basis19 for Ag. The cluster of Ag20 tetrahedron20 is used for the metal substrate.
This work was supported by the National Natural Science Foundation of China (Grant Nos 90923003, 21073124, 11274149, 10874234, and 20703064), the National Basic Research Project of China (Grant Nos 2009CB930701), the National Science Foundation of Liaoning Province (Grant No 20121032), the Program of Shenyang Key Laboratory of Optoelectronic materials and technology (Grant No. F12-254-1-00) and the Fundamental Research Funds for the Central Universities (grant no:DL12BB19).
References
- M. Fleischmann, et al. , Chem. Phys. Lett., 1974, 26, 163 CrossRef CAS.
- D. J. Jeanmaire and R. P. Van Duyne, J. Elektroanal. Chem., 1977 Search PubMed.
- H. X. Xu, et al. , Phys. Rev. Lett., 1999, 83, 4357 CrossRef CAS.
- K. Kneipp, et al. , Phys. Rev. Lett., 1997, 78, 1667 CrossRef CAS.
- M. T. Sun and H. X. Xu, Small, 2012, 8, 2777 CrossRef CAS.
- R. M. Stöckle, et al. , Chem. Phys. Lett., 2000, 318, 131 CrossRef.
- J. Steidtner and B. Pettinger, Phys. Rev. Lett., 2008, 100, 236101 CrossRef.
- M. T. Sun, Y. R. Fang, Z. Y. Zhang and H. X. Xu, 2012, arxiv:1112.4218v1.
- M. T. Sun, Z. L. Zhang, H. R. Zheng and H. X. Xu, Sci. Rep., 2012, 2, 647 CrossRef.
- E. Fermi, Z. Phys., 1931, 71, 250–259 CrossRef CAS.
- B. T. Darling and D. M. Dennison, Phys. Rev., 1940, 57, 128 CrossRef CAS.
- A. Bykov, et al. , J. Mol. Spectrosc., 2001, 205, 1–8 CrossRef CAS.
- R. D. Amos, et al. , J. Chem. Phys., 1991, 95, 8323 CrossRef CAS.
- E. J. Ayars, et al. , Phys. Rev. Lett., 2000, 85, 4180 CrossRef CAS.
- Z. Zhang, X. Tian, H. Zheng, H. Xu and M. T. Sun, Plasmonics, 2012 DOI:10.1007/s11468-012-9426-5.
- B. Ren, G. Picardi and B. Pettinger, Rev. Sci. Instrum., 2004, 75, 837 CrossRef CAS.
- M. J. Frisch, et al.Gaussian 09, Revision A.02; Gaussian, Inc.: Wallingford, CT, 2009 Search PubMed.
- J. P. Perdew, K. Burke and Y. Wang, Phys. Rev. B: Condens. Matter, 1996, 54, 16533 CrossRef CAS.
- P. J. Hay and W. R. Wadt, J. Chem. Phys., 1985, 82, 270 CrossRef CAS.
- M. T. Sun, et al. , J. Raman Spectrosc., 2009, 40, 137 CrossRef CAS.
Footnote |
| † Both authors contributed equally to this work. |
| This journal is © The Royal Society of Chemistry 2012 |
