Screening the attachment and spreading of bone marrow-derived and adipose-derived mesenchymal stem cells on porous silicon gradients
Peng-Yuan
Wang
abc,
Lauren R.
Clements
b,
Helmut
Thissen
d,
Shih-Chieh
Hung
e,
Nai-Chen
Cheng
f,
Wei-Bor
Tsai
*a and
Nicolas H.
Voelcker
*g
aDepartment of Chemical Engineering, National Taiwan University, No. 1, Roosevelt Rd., Sec. 4, Taipei, 106, Taiwan. E-mail: weibortsai@ntu.edu.tw
bSchool of Chemical and Physical Sciences, Flinders University, Bedford Park, SA 5042, Australia
cIndustrial Research Institute Swinburne (IRIS), Faculty of Engineering and Industrial Sciences, Swinburne University of Technology, Hawthorn, 3122 VIC, Australia
dCSIRO Materials Science and Engineering, Bayview Avenue, Clayton VIC 3168, Australia
eStem Cell Laboratory, Department of Medical Research & Education and Orthopaedics & Traumatology, Veterans General Hospital, Taipei, Taiwan
fDepartment of Surgery, National Taiwan University Hospital and College of Medicine, Taipei, Taiwan
gMawson Institute, University of South Australia, Mawson Lakes, SA 5095, Australia. E-mail: nico.voelcker@unisa.edu.au
First published on 16th October 2012
Abstract
Nanoscale surface topography exerts profound effects on stem cell behaviour. Detailed knowledge of these effects is of key relevance to the development of advanced materials for tissue engineering. In order to gain such knowledge, high-throughput platforms for characterising cell-surface interactions are required. One suitable platform technology involves the use of lateral gradients where a continuous variation in a chemical or physical surface parameter of choice is investigated. Here, we fabricate porous silicon (pSi) gradients displaying pore sizes ranging from approximately 2 μm down to a few nm in diameter, and changing in solid surface fraction from 15% to 95% along the 12 mm length of the gradient. Cell attachment and spreading of primary rat bone marrow-derived mesenchymal stem cells (rBMSCs), human BMSCs (hBMSCs) and primary human adipose-derived mesenchymal stem cells (hASCs) were studied on these gradients. For all three MSC types, spreading was suppressed on the large pore size region of the gradient and spreading increased towards the other end of the gradient. MSC attachment density, on the other hand, was pore size- and cell type-dependent. In contrast to hASCs, the attachment density of rBMSCs and hBMSCs was low on the pSi gradient compared with flat Si. For hASCs, we observed a peak attachment density on the pore size region of 329 ±112 nm. F-actin staining showed clearly that cytoskeleton development was related to both cell spreading and cell type. The result hence showed that the pore size gradient format allows the screening of suitable surface topography parameters for the control of MSC behaviour. We also observed that MSCs derived from different sources respond differently to pore size at the nanoscale, suggesting that intrinsic differences between MSCs affect cell-surface interactions and justifying the need for high-throughput platforms, such as the one developed here.
1. Introduction
The topography of a material surface has a significant influence on the behaviour of adherent cells, which has key implications for the design of biomaterials and scaffolds for tissue engineering.1 It has been reported that surface topography induces morphological changes of attached cells, and also modulates cell proliferation and differentiation.2–5 Cell attachment and spreading directed by surface topography can be regarded as one of the early indicators for the fate of mammalian and stem cells.6–9 Several studies have focussed on surface topography cues in order to control cell behaviour starting from cell attachment and spreading.10,11Gradient surfaces are viewed as valuable tools for the high-throughput characterisation of cell-surface interactions since they allow for the systematic screening and optimisation of surface parameters in a single sample.12–17 Gradient surfaces reduce the sample numbers and the diversity between experiments. To this end, a pore size gradient on porous silicon (pSi) was generated to study the effect of the pore sizes on cell attachment and morphology.16 SK-N-SH neuroblastoma cells were found to adhere poorly to regions with pore sizes of 100–300 nm and formed cell clusters, whilst cells cultured on larger pores (1–3 μm) adhered well and formed long and thick neurites. On mesoporous pores (<50 nm), cell attachment density was very high, but cells were shorter and neurites thinner than on the large pore size region. This study highlighted the potential of investigating cellular responses using a pSi topography gradient format.
Mesenchymal stem cells (MSCs), owing to their remarkable differentiation potential into several cell lineages, such as bone, cartilage and muscle, are one of the most promising cell sources for regenerative medicine, tissue engineering and disease pathology.18 This has spawned the desire to influence the behaviour of MSCs through the presentation of topographical cues.19–21 To date, the results obtained suggest that the attachment, morphology, proliferation and differentiation of MSCs are indeed affected by surface topography.22,23 However, a systematic investigation of the attachment and spreading of MSCs using a topography gradient surface is absent in the literature. Meanwhile, MSCs responding to stiffness12 and ligand density24 gradients have been reported recently.
In this study, pore size gradients were generated in porous silicon and their interactions with three MSC lineages investigated. MSCs can be derived from different tissues, such as bone marrow, adipose tissue, or umbilical cord.25 MSCs derived from these different sources differ in their gene profile and differentiation ability.25–27 Accordingly, the behaviour of MSCs derived from the different sources on a substrate could be totally different, which has important implications for cell therapy applications. Whilst the diversity of MSCs derived from different sources has been evaluated from a biological standpoint,28 it has rarely been contemplated from a material standpoint. Here, we chose to study a cross-section of popular MSC lineages, including rat bone marrow-derived mesenchymal stem cells (rBMSCs), human bone marrow-derived mesenchymal stem cells (hBMSCs) and human adipose-derived mesenchymal stem cells (hASCs).
2. Experimental section
2.1. Materials
Boron-doped p-type silicon wafers with <100> orientation and a resistivity of 0.0005–0.001 Ω cm were purchased from Virginia Semiconductors, USA. Dulbecco's Modified Eagle's Medium low-glucose (DMEM-LG), MEM non-essential amino acid, L-glutamine, penicillin, streptomycin and amphotericin were purchased from Invitrogen (Carlsbad, USA). All other reagents were purchased from Sigma-Aldrich (St. Louis, USA) unless specified otherwise.2.2. Fabrication of porous silicon gradients
Porous silicon (pSi) gradients were prepared according to our previously published procedure.16 In brief, p-type silicon was etched in a 1![[thin space (1/6-em)]](https://www.rsc.org/images/entities/char_2009.gif) :1 (v/v) solution of 49% aqueous HF:absolute ethanol by placing a Pt electrode perpendicular to the silicon surface at one end of the 12 mm-diameter circle chamber of a Teflon cell (Fig. 1A). A current density of 60 mA cm−2 was applied for 90 s with a distance of 1.5 cm between the Pt electrode and the wafer surface. After etching, the samples were rinsed successively with ethanol, methanol, acetone and dichloromethane and then dried under a stream of N2. The freshly etched pSi surfaces were thermally oxidised in a tube furnace at 400 °C for 30 min and then at 800 °C for 60 min (Fig. 1B). Once cooled, the samples were further oxidised with an ozone stream of 100 L h−1 for 10 min to generate surface hydroxyl groups. The samples were coated with 100 mM aminopropyltriethoxy silane (APTES, Sigma) in dry toluene for 5 min and then rinsed with copious amounts of toluene and dried under a stream of N2 (Fig. 1B). Coloured streaks can be observed along the pSi gradient surface indicating different light reflection properties. The direction of the pore size gradient was defined by the position underneath the electrode during etching (=0 mm end) to the distal end furthest away from the electrode (=12 mm end) (Fig. 1C).
:1 (v/v) solution of 49% aqueous HF:absolute ethanol by placing a Pt electrode perpendicular to the silicon surface at one end of the 12 mm-diameter circle chamber of a Teflon cell (Fig. 1A). A current density of 60 mA cm−2 was applied for 90 s with a distance of 1.5 cm between the Pt electrode and the wafer surface. After etching, the samples were rinsed successively with ethanol, methanol, acetone and dichloromethane and then dried under a stream of N2. The freshly etched pSi surfaces were thermally oxidised in a tube furnace at 400 °C for 30 min and then at 800 °C for 60 min (Fig. 1B). Once cooled, the samples were further oxidised with an ozone stream of 100 L h−1 for 10 min to generate surface hydroxyl groups. The samples were coated with 100 mM aminopropyltriethoxy silane (APTES, Sigma) in dry toluene for 5 min and then rinsed with copious amounts of toluene and dried under a stream of N2 (Fig. 1B). Coloured streaks can be observed along the pSi gradient surface indicating different light reflection properties. The direction of the pore size gradient was defined by the position underneath the electrode during etching (=0 mm end) to the distal end furthest away from the electrode (=12 mm end) (Fig. 1C).
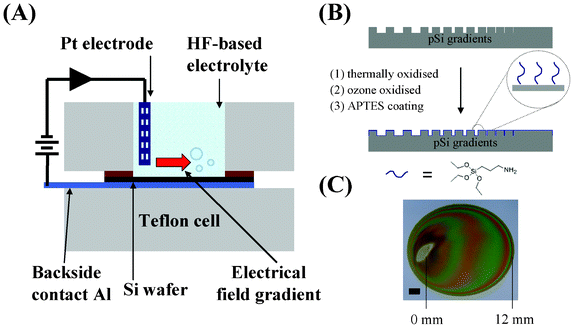 | ||
| Fig. 1 (A) A schematic representation of the anodisation setup for pSi gradient formation. (B) Surface modifications of pSi gradient using thermal and ozone oxidation and APTES coating. (C) Asymmetrically anodised porous silicon film etched on p-type silicon. The electrode site was electropolished and appears silver in colour. The coloured streaks indicate the different light reflection properties along the gradient from the 0 mm end to the 12 mm end. Scale bar = 2 μm. | ||
2.3. Characterisation of pSi gradients
The pore size and porous structures across the pSi gradients from the region were examined using a scanning electron microscope (SEM, FEI Helios nanolab), atomic force microscope (AFM, Nanoscope V Multimode, Bruker, Santa Barbara, USA) and water contact angle (WCA) measurements in intervals of 1 mm along the surfaces. For SEM observation, samples were sputter-coated with a 3 nm thick layer of platinum to reduce charging effects and enhance the resolution of SEM imaging. The pore diameter (n > 200) and porous layer thickness (n = 3) were determined from top-view and cross-section SEM images, respectively. The pore was outlined and analysed using ImageJ software. The surface solid fraction along the pSi gradients was determined by dividing the solid surface area by the total surface area (n = 3). Ridge roughness was determined from the AFM images using tapping mode with a scan rate of 0.5 Hz and a scan area of 5 × 5 μm2 (n = 6). Surface wettability was determined using sessile drop WCA measurements. WCA were measured at 5 locations (0, 3, 6, 9, 12 mm) along the gradient and on flat Si using a goniometer (FTA-125, First Ten Ångstroms, USA).2.4. Isolation and culture of mesenchymal stem cells
rBMSCs were isolated from female Wistar rats (∼100 g, Animal Care Unit, Flinders University) according to our previously published procedure.12 The multipotency of these cells was demonstrated by testing their differentiation ability into osteoblast-like and adipocyte-like cells. The animals were sacrificed by anaesthesia under the guidelines approved by the Flinders University Animal Care and Utilisation Committee. Briefly, bone marrow cells were collected from the femurs and tibias by flushing the bone marrow with rBMSC culture medium (DMEM-LG containing 2 mM L-glutamine, 100 U mL−1 penicillin, 100 μg mL−1 streptomycin, 0.25 g mL−1 amphotericin, 0.1 mM MEM non-essential amino acids and 10% (v/v) fetal bovine serum (JRH, Australia) with pH 7.4). After lysis of the red blood cells, bone marrow cells were cultured on TCPS with the medium refreshed every two days until 90% confluence. Cells were detached by trypsinisation as passage 1 cells. Passage 2 cells were used in this study.hBMSCs were maintained according to a previous study.29 The multipotency of these cells was demonstrated by testing their differentiation ability into osteoblast-like, adipocyte-like cells, chondrocyte-like cells and neuron-like cells. The protocol and guidelines were approved by the institutional review board of Veteran's General Hospital Taipei. hBMSCs were cultured and passaged in DMEM-LG supplemented with 100 U mL−1 penicillin, 100 μg mL−1 streptomycin, 2 mM L-glutamine and 10% (v/v) fetal bovine serum (Invitrogen, USA).
hASCs were obtained by lipoaspiration and maintained according to a previous study.30 The protocol was approved by the Internal Ethical Committee of the National Taiwan University Hospital. Briefly, the subcutaneous adipose tissue from the abdomen was placed in a physiological solution (0.9% NaCl), washed twice with PBS and finely minced. The scraped adipose tissue was then placed in a digestion solution of 1 mg mL−1 collagenase type I (Gibco, Carlsbad, CA) at 37 °C in agitation for 1 h. The digest was filtered through 70 μm filters. hASCs were cultured and passaged in DMEM/F-12 (Thermo Scientific, Waltham, MA), supplemented with 100 U mL−1 penicillin, 100 μg mL−1 streptomycin, 1 ng mL−1 basic fibroblast growth factor (bFGF; R&D systems) and 10% (v/v) fetal bovine serum (Biological Industries, Kibbutz Beit Haemek, Israel). The multipotency of hASCs was demonstrated by testing their differentiation ability into osteoblast-like and adipocyte-like cells.
2.5. Characterisation of MSC behaviour
In this study, cells were seeded on pSi gradients with a cell density of 2 × 10⁴ cells cm−2. After 24 h culture, the samples were rinsed with phosphate buffered saline (PBS: 137 mM NaCl, 2.7 mM KCl, 10 mM Na2HPO4 and 1.8 mM KH2PO4 with pH 7.4), and then fixed with 4% (v/v) paraformaldehyde for 10 min. For fluorescence staining, the samples were stained with 500 nM phalloidin-TRITC and 100 nM DAPI for F-actin and nuclei, respectively. Fluorescence images were captured by a spectral confocal and multiphoton system (TCS SP5, Leica, Germany). Cell density at each position was estimated by counting nuclei from 3 separate samples. Three images (image area = 8.125 × 10⁻⁴ cm2) at each position were captured. Cell density at each position was obtained by dividing the counted cell number by the image area. Cell nuclei counting has been used in our previous work to establish changes in cell attachment density.17 The outlines of separate cells at each position were traced manually and the enclosed cell areas, circularity and elongation were determined by NIH ImageJ software (12–29 cells for each position). Circularity, describing the roundness of cell, is a feature that shows how much a shape has deviated from a perfect circle. A circularity value of 1.0 indicates a perfect circle. As the value approaches 0.0, it indicates an increasingly elongated polygon. Elongation, describing the extent of cell stretching, is the quotient of cell length divided by width. Cells that significantly overlapped with each other were not considered for morphology analysis. The total cells were collected from several images, rather than from one image.2.6. Statistical analysis
Statistical analysis was performed using the GraphPad Instat 3.0 program (GraphPad Software, USA). The statistical analysis between each group was determined with a One Way ANOVA and Student–Newman–Keuls multiple comparisons test. p < 0.05 was considered as statistically significant.3. Results
3.1. Characterisation of pSi gradients
The surface topography of the pSi gradient was characterised using SEM and AFM from the 0 mm end to the 12 mm end along the gradient (Fig. 2). At the 0 mm end, the large pores (2 μm) had polygonal morphology with narrow ridges separating them (Fig. 2A, image I & i). The top-view morphology of pores became irregular and elongated after 6 mm. The pore diameters decreased sharply from ∼2 μm to ∼300 nm between 0 mm and 3 mm, and then decreased gradually to less than 10 nm towards the 12 mm end (Fig. 2A and 3A). Moreover, the ridge area between pores increased from 15.6% at the 0 mm end to 95.2% at the 12 mm end along the gradient. The cross-section SEM images show that the thickness of the porous layer gradually decreased from 1.3 μm at the 0 mm end to 900 nm at the 12 mm end along the gradient, but the pore orientation was perpendicular to the surface (Fig. 2B and 3B). AFM images showed that the ridge roughness (Ra) decreased along the gradient from 7.3 nm at the 0 mm end to 0.5 nm at the 12 mm end along the gradient (Fig. 2C and 3C). Surface solid fraction was increased from 15.6% at the 0 mm end to 95.2% at the 12 mm end along the gradient (Fig. 3D).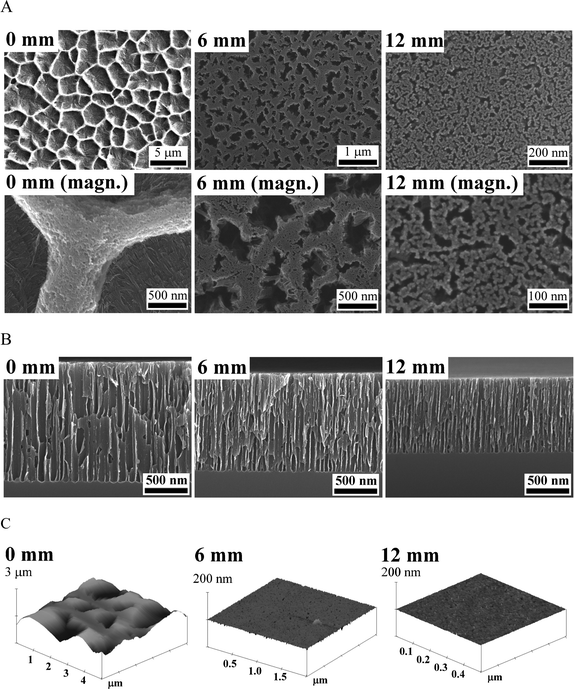 | ||
| Fig. 2 (A, B) Scanning electron microscopy (SEM) and (C) atomic force microscopy (AFM) images of the surface structure and porous layer of the pSi gradients. Three positions 0, 6, and 12 mm along the pSi gradient starting from the position underneath the electrode are displayed from left to right. magn. = larger magnification image. | ||
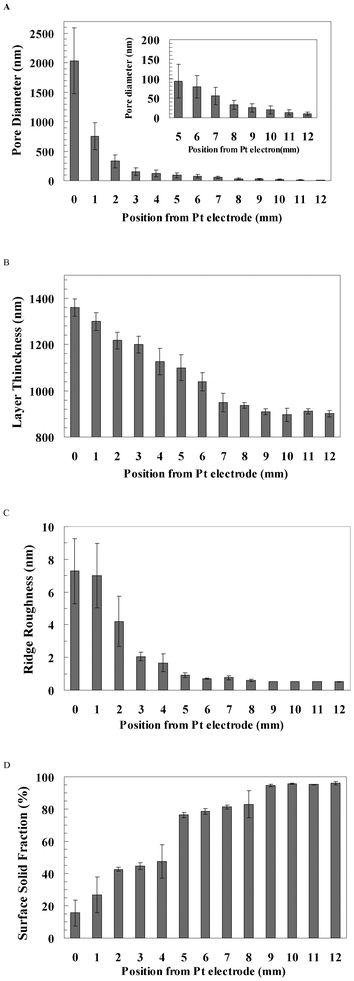 | ||
| Fig. 3 (A) The pore diameter, (B) pore layer thickness, (C) ridge roughness and (D) solid surface fraction were analysed from the 0 mm end to the 12 mm end of the pSi gradient. The number of analysed pores was 221–459. Pore layer thickness was analysed from three cross-section images (n = 3). Ridge roughness was analysed from the ridge (n = 6). Solid surface fraction (solid area/total area) was analysed from three SEM images (n = 3). Error bar = standard deviation. | ||
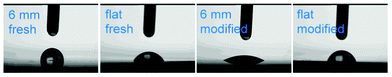
To stabilise the surface in aqueous medium and increase the biocompatibility of the etched porous layer, the samples were treated by thermal and ozone oxidation and then coated with APTES.17 Water contact angles (WCA) decreased after surface modification, but without a hydrophilicity gradient along the surface (Table 1). Before oxidation and silanisation, the WCA along the pSi gradient was approximately 81°, except at the 12 mm end (∼58°), whilst the WCA of flat Si was approximately 52°. After oxidation and silanisation, the wettability of pSi was increased significantly. The WCA along the pSi gradient was close to 30°, whilst the WCA of flat Si was close to 62°.
| Position from Pt electrode | Fresh pSi | Modified pSi |
|---|---|---|
| a Indicates that there was no significant difference compared with the flat Si. b Significantly different with p < 0.001 compared with all porous positions along the pSi gradient. | ||
| 0 mm | 82.1° ± 3.3° | 31.6° ± 3.7° |
| 3 mm | 78.1° ± 1.7° | 30.7° ± 1.5° |
| 6 mm | 80.2° ± 2.1° | 30.9° ± 0.5° |
| 9 mm | 84.2° ± 5.2° | 28.4° ± 1.2° |
| 12 mm | 57.7° ± 7.0°a | 27.9° ± 1.4° |
| Flat | 52.2° ± 13.7°b | 61.5° ± 6.7°b |
|
||
3.2. Attachment and spreading of MSCs on pSi gradients
rBMSCs attachment on the pSi gradient was poor, especially at the 0 mm end, compared with that on the flat Si surface (Fig. 4). Quantitative data showed that rBMSCs density at the 0 mm end (0.79 × 10⁴ cells cm−2, Fig. 4A) was significantly lower than for the rest of the positions along the pSi gradient (1.30–1.59 × 10⁴ cells cm−2, p < 0.001), whilst the density on the flat Si (1.91 × 10⁴ cells cm−2, Fig. 4A) was significantly higher than on any position of the pSi gradient (p < 0.001). On the other hand, spreading of rBMSCs was more sensitive to the pore size compared with the cell attachment. Cells gradually spread out from 0 mm (714 μm2) to 6 mm (5971 μm2) along the direction of the gradient, and kept a similar spreading area from 6 mm to the 12 mm end of the gradient (6665 μm2, Fig. 4B). Cell spreading at the flat area (6933 μm2) was not significantly different compared with the 12 mm end, but was significantly higher than the spreading area on the 0–4 mm positions of the gradient (p < 0.05, Fig. 4B). Cytoskeleton staining showed that F-actin was dense and aggregated within the small spread cells at the 0 mm end (Fig. 4C). On the other hand, F-actin fibres were pronounced from the 6 mm to 12 mm end along the gradient, as well as on the flat area (Fig. 4C).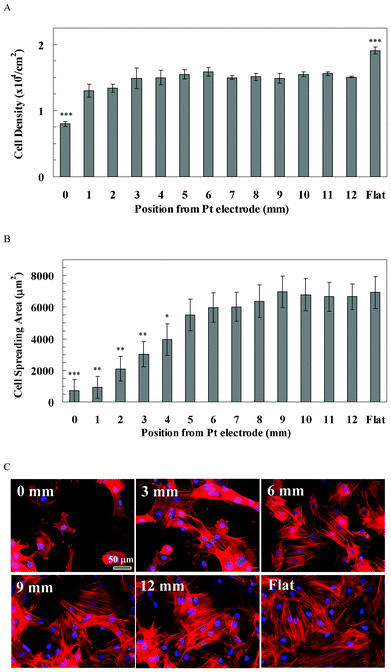 | ||
| Fig. 4 (A) The cell density of rBMSCs along the pSi gradient. The symbols indicate there is a significant difference compared with the porous area (n = 4). The data represent mean ± standard deviation. (B) The cell spreading area of rBMSCs along the pSi gradient. The data represent mean ± standard error mean. The analysed cells were 12–29. *, **, *** represent p < 0.05, p < 0.01 and p < 0.001, respectively, compared with the flat area. (C) Cytoskeleton staining of rBMSCs on the pSi gradient after 24 h culture. Nuclei and F-actin were stained by DAPI (blue) and TRITC-Phalloidin (red), respectively. Images show cell morphology at positions 0, 3, 6, 9 and 12 mm on the pSi gradient and on flat Si, respectively. | ||
The cell density of hBMSCs on the pSi gradient was also lower than that on flat Si, but was independent of the pore size on the pSi gradient (Fig. 5A). Quantitative data showed that hBMSCs density was not significantly different along the pSi gradient (1.17–1.48 × 10⁴ cells cm−2), whilst the density on the flat Si was significantly higher compared to the pSi gradient (1.66 × 10⁴ cells cm−2, p < 0.001, Fig. 5A). The cell spreading area of hBMSCs gradually increased from the 0 mm end (1173 μm2) to the 8 mm of the gradient (1839 μm2) where the cell area was significantly smaller than that on the flat Si (2391 μm2, p < 0.05, Fig. 5B). The cell spreading area from 9 mm (1958 μm2) of the gradient to the 12 mm end (2433 μm2) was similar to that on the flat Si (2391 μm2). Cytoskeleton staining showed that F-actin fibres were distributed mainly at the periphery of the hBMSCs attaching to the gradient without clear cytoskeletal tension, but were pronounced on the flat area (Fig. 5C).
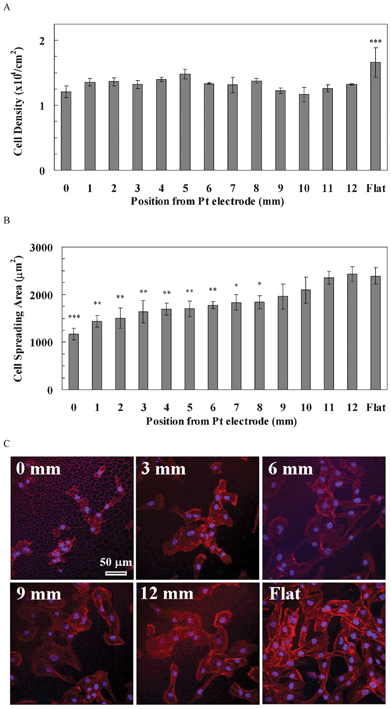 | ||
| Fig. 5 (A) The cell density of hBMSCs along the pSi gradient. The symbols indicate that there is a significant difference compared with the porous area (n = 4). The data represent mean ± standard deviation. (B) The cell spreading area of hASCs along the pSi gradient. The data represent mean ± standard error mean. The analysed cells were 15–19. *, **, *** represent p < 0.05, p < 0.01 and p < 0.001, respectively, compared with the flat area. (C) Cytoskeleton staining of hBMSCs on the pSi gradients after 24 h culture. Nuclei and F-actin were stained by DAPI (blue) and TRITC-Phalloidin (red), respectively. Images show cell morphology at positions 0, 3, 6, 9 and 12 mm on the pSi gradient and on flat Si, respectively. | ||
The behaviour of hASCs was quite different from rBMSCs and hBMSCs (Fig. 6). The cell density of hASCs was similar along the pSi gradient, as well as the flat Si (1.00–1.27 × 10⁴ cells cm−2), except for the region of 1–4 mm (1.39–1.68 cells cm−2, Fig. 6A). The spreading area of hASCs gradually increased from the 0 mm end (3137 μm2) to the 12 mm end (4724 μm2) of the gradients, and was even higher on the flat Si (5193 μm2, Fig. 6B), but the differences were not statistically significant. Cytoskeleton staining showed that a F-actin fibre network was apparent along the entire gradient, as well as at the flat area (Fig. 6C).
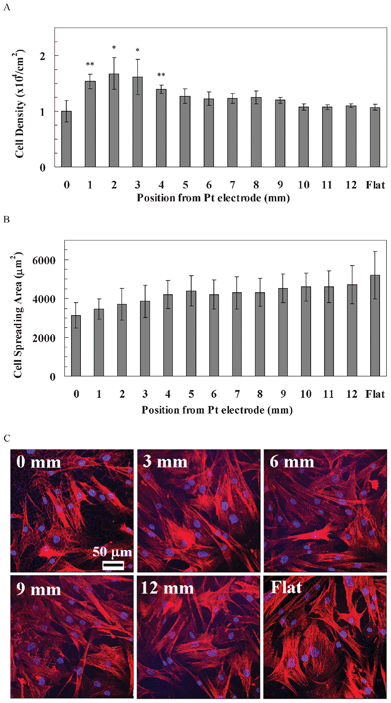 | ||
| Fig. 6 (A) The cell density of hASCs along the pSi gradient. The symbols indicate there is a significant difference compared with the flat area (n = 4). The data represent mean ± standard deviation. (B) The cell spreading area of hASCs along the pSi gradient. The data represent mean ± standard error mean. The analysed cells were 17–22. *, ** represent p < 0.05 and p < 0.01, respectively, compared with the flat area. (C) Cytoskeleton staining of hASCs on the pSi gradient after 24 h culture. Nuclei and F-actin were stained by DAPI (blue) and TRITC-Phalloidin (red), respectively. Images show cell morphology at positions 0, 3, 6, 9 and 12 mm on the pSi gradient and flat Si, respectively. | ||
The cell morphology of MSCs was further quantified in terms of circularity and elongation (Fig. 7). Circularity showed that both rBMSCs (>0.4) and hBMSCs (>0.5) have a rounder shape than the hASCs (<0.3, p < 0.001, Fig. 7A). Only rBMSCs changed their circularity significantly from the 0 mm end to the 12 mm end of the gradients. The circularity of rBMSCs on the gradient after 9 mm, as well as the flat area, was significantly lower than that on the 0 mm end (p < 0.001). Elongation showed that both rBMSCs and hBMSCs (<3.0) were less elongated compared with hASCs (>4.0, p < 0.001, Fig. 7B). Again, only rBMSCs increased their elongation significantly from the 0 mm end to the 12 mm end of the gradients (p < 0.001).
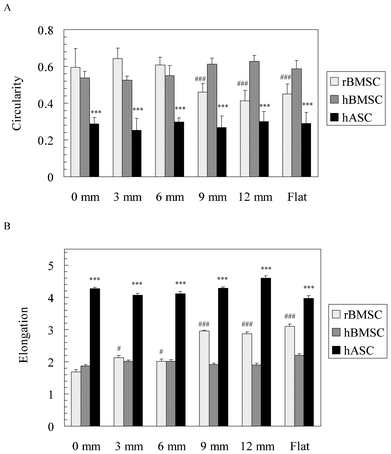 | ||
| Fig. 7 (A) Circularity and (B) elongation of three MSC types along the pSi gradients. A circularity value of 1.0 indicates a perfect circle. As the value approaches 0.0, it indicates an increasingly elongated polygon. Elongation, describing the extent of cell stretch, is the quotient of cell length divided by width. The data represents mean ± standard error mean. The number of analysed cells was 7–12. *** represents p < 0.001 compared with the different cell type. # and ### represent p < 0.05 and p < 0.001, respectively, compared with the 0 mm end. | ||
4. Discussion
Understanding the behaviour of MSCs on the surface of biomaterials is highly desired since MSCs are a powerful cell source for regenerative medicine and tissue engineering applications, and also an emerging tool for drug delivery, immune disease and cancer therapies.31–34 MSCs can be obtained from different species and tissues. Various studies have established that MSCs from different sources show intrinsic differences, such as gene profile, and different in vitro behaviours, such as differentiation ability, resulting in the limitation of a particular application for specific MSCs.25–27 Therefore, optimisation of MSCs-surface topography interactions is an important endeavour. To this end, we used a gradient surface with different pore sizes for high-throughput characterisation of the attachment and spreading of MSCs derived from rat bone marrow, human bone marrow and human adipose tissue.The aim of this study was to characterise MSC-surface topography interactions using pSi gradients, and also to explore whether MSCs derived from different sources respond to the same topography differently. First, this study showed that the pSi gradient format allows screening and characterisation of the interactions of porous surfaces with MSCs. pSi gradients cover a wide range of pore sizes from a few nanometres to few micrometers on a single surface. The advantage of the gradient format is that cell experiments can be performed under identical experimental conditions. The fabrication process of pSi gradients is fast (a few minutes) and easy, and the pore size distribution is highly tuneable by adjusting the current density and etching time.35 Moreover, pSi is biocompatible36 and biodegradable. The surface chemistry of pSi can be tuned and the stability of pSi improved by oxidation and silanisation reactions.37,38
More importantly, we found that the spreading of MSCs was generally suppressed at the 0 mm end of pSi gradients, where the pore size is the largest (2 μm) and solid surface fraction is the lowest (<20%). Previous studies have shown that a rough surface may disturb cell-surface contacts, demonstrated by the formation of weak focal adhesion formation, which depends on surface roughness.39–41 Focal adhesions are large protein complexes through which the cytoskeleton of a cell connects to the extracellular matrix (ECM). Well-spread hBMSCs exhibiting more prominent focal adhesions and stress fibres with apparent cytoskeletal tension have been reported.42 In our case, the cytoskeleton of rBMSCs on the 0 mm end of the gradient was not apparent, but gradually developed along the gradient from large pores (2 μm at the 0 mm end) to small pores (<10 nm at the 12 mm end, Fig. 4C). Therefore, we propose that a large pore size area led to a rough surface, which resulted in weak focal adhesions, in turn causing a small cell spreading area, especially with the rBMSCs. Whilst we did not investigate this in depth, weak focal adhesion formation may translate into poor cell activities at this region of the gradient because focal adhesion formation has been recognised as a critical mediator for cell migration, proliferation and differentiation.43
Furthermore, we found that MSC attachment on the porous surface was not only pore size dependent, but also cell-type dependent. For example, the attachment density of rBMSCs and hBMSCs, but not hASCs, was lower on the pSi gradient compared with flat Si. hBMSCs showed similar cell responses to rBMSCs on the pSi gradient (e.g. cell attachment density), but were not as sensitive as rBMSCs to the pore size. Regarding the cell spreading area and cytoskeleton, it was demonstrated again that rBMSCs are more sensitive to the pore size change compared with hBMSCs. It has been reported that rBMSCs are more sensitive to growth factor-induced osteogenesis44 and to plating density45 compared with hBMSCs. Therefore, we propose that rBMSCs were not only more sensitive to the external chemical stimulation, but also the external physical environment than hBMSCs. In contrast, hASCs showed a different behaviour, where cell attachment peaked on the 1–4 mm region of the gradient, where the pore size is 150–750 nm in diameter and was higher than for flat Si. hASCs on the rest of the gradient did not show any difference in cell attachment density compared with flat Si. Cell spreading and the cytoskeleton of hASCs were also not significantly different along the gradient, although it appears to increase gradually from the 0 mm end to the 12 mm end. In addition to cell-surface interactions, cell morphology (circularity and elongation) showed a clear difference between cell types. Our results suggest that MSCs derived from different sources react differently to surface topography. A previous study has shown that MSCs harvested from bone marrow, synovium, periosteum, adipose and muscle have different properties with regard to colony-formation, expansion and multipotentiality.46 Colony-forming efficiency and expansion of adipose-derived MSCs is higher than for bone marrow-derived MSCs. In terms of the differentiation ability of these two MSCs, the chondrogenesis and osteogenesis potential of bone marrow-derived MSCs is higher, whilst the adipogenesis potential of adipose-derived MSCs is higher.46 Whilst the Yoshimura et al. study showed differences between MSCs from a physiological point of view, our study demonstrates differences among three MSCs from a material-based aspect. Therefore, the current results could be useful to improve the design of materials for tissue engineering and cell therapy applications.
It is of great interest to control attachment density and cytoskeletal arrangement of MSCs adhering to a biomaterial surface, since these two events modulate the proliferation and differentiation.47–52 For instance, high local cell density enhances chondrogenesis of hBMSCs compared with low density culture conditions.49 On the other hand, hBMSCs that adhere well, flatten and spread on a surface have been observed to undergo osteogenesis, whilst unspread, round hBMSCs become adipocytes in vitro.42 Cell shape and density therefore apparently regulate the lineage commitment of MSCs. Surface topography is hence one of the most powerful tools to modulate MSC attachment and spreading, which in turn determines cell fate.53–55 Nevertheless, our study should be seen as a proof-of-principle study only, which demonstrates that our gradient format allows the screening of early stage behaviour of MSCs in response to surface topography at the nanoscale.
5. Conclusions
In the present study, the attachment and spreading of three MSC types derived from different sources were investigated using pSi gradients. The variation of topographical features along the pSi gradient included a wide range of pore sizes and solid surface fractions. The results show clearly that MSCs derived from different sources have distinct cell responses to pore size gradients. This is the first study revealing the diversity of MSC responses to material surfaces. rBMSCs were more sensitive to the pore size change compared with hBMSCs. Both BMSCs derived from rat and human did not attach as well on the pSi compared to flat Si. On the other hand, hASCs attached better on some regions of the pSi gradient, e.g. 329 ± 112 nm pores, compared to flat Si, and were less sensitive to the pore size change. The pore size and surface topography interfere with MSC attachment and spreading, as well as cytoskeleton development in a cell-type dependent manner. Thus, this study highlights the potential of using pSi gradients as a high-throughput characterisation tool for studying cell-surface interactions. The results in this proof-of-principle study afford preliminary information on the control of MSCs behaviour via topographical cues, which will inform the design of scaffolds and cultureware for tissue engineering and stem cell biology applications.Acknowledgements
The authors gratefully acknowledge funding from the Australian Research Council and National Science Council, Taiwan (99-2221-E-002-131). Peng-Yuan Wang acknowledges support from the National Science Council, Taiwan, by award of a travel scholarship under the Graduate Program for Studying (GPS) in Australia/New Zealand scheme (98-2911-I-002-056). Lauren Clements acknowledges support from the CSIRO Food Futures Flagship.References
- R. Langer and D. A. Tirrell, Nature, 2004, 428, 487–492 CrossRef CAS
.
- P.-Y. Wang, J. Yu, J.-H. Lin and W.-B. Tsai, Acta Biomater., 2011, 7, 3285–3293 CrossRef CAS
- J. Y. Lim and H. J. Donahue, Tissue Eng., 2007, 13, 1879–1891 CrossRef CAS
- A. J. Keung, S. Kumar and D. V. Schaffer, Annu. Rev. Cell Dev. Biol., 2010, 26, 533–556 CrossRef CAS
- W.-B. Tsai and J.-H. Lin, Acta Biomater., 2009, 5, 1442–1454 CrossRef CAS
- P.-Y. Wang, H. Thissen and W.-B. Tsai, Biotechnol. Bioeng., 2012, 109, 2104–2115 CrossRef CAS
- K. Kurpinski, J. Chu, C. Hashi and S. Li, Proc. Natl. Acad. Sci. U. S. A., 2006, 103, 16095–16100 CrossRef CAS
- A. I. Teixeira, G. A. McKie, J. D. Foley, P. J. Bertics, P. F. Nealey and C. J. Murphy, Biomaterials, 2006, 27, 3945–3954 CrossRef CAS
- P.-Y. Wang, H.-T. Yu and W.-B. Tsai, Biotechnol. Bioeng., 2010, 106, 285–294 CrossRef CAS
- K. Anselme, P. Davidson, A. M. Popa, M. Giazzon, M. Liley and L. Ploux, Acta Biomater., 2010, 6, 3824–3846 CrossRef CAS
- C. J. Bettinger, R. Langer and J. T. Borenstein, Angew. Chem., Int. Ed., 2009, 48, 5406–5415 CrossRef CAS
- P.-Y. Wang, W.-B. Tsai and N. H. Voelcker, Acta Biomater., 2012, 8, 519–530 CrossRef CAS
- T. P. Kunzler, T. Drobek, M. Schuler and N. D. Spencer, Biomaterials, 2007, 28, 2175–2182 CrossRef CAS
- J. Yang, F. R. A. J. Rose, N. Gadegaard and M. R. Alexander, Adv. Mater., 2009, 21, 300–304 CrossRef CAS
- J. Sun, Y. Ding, N. J. Lin, J. Zhou, H. Ro, C. L. Soles, M. T. Cicerone and S. Lin-Gibson, Biomacromolecules, 2010, 11, 3067–3072 CrossRef CAS
- Y. L. Khung, G. Barritt and N. H. Voelcker, Exp. Cell Res., 2008, 314, 789–800 CrossRef CAS
- P.-Y. Wang, L. R. Clements, H. Thissen, A. Jane, W.-B. Tsai and N. H. Voelcker, Adv. Funct. Mater., 2012, 22, 3414–3423 CrossRef CAS
- M. F. Pittenger, A. M. Mackay, S. C. Beck, R. K. Jaiswal, R. Douglas, J. D. Mosca, M. A. Moorman, D. W. Simonetti, S. Craig and D. R. Marshak, Science, 1999, 284, 143–147 CrossRef CAS
- E. K. Yim, E. M. Darling, K. Kulangara, F. Guilak and K. W. Leong, Biomaterials, 2010, 31, 1299–1306 CrossRef CAS
- P. Layrolle, S. Lavenus, P. Pilet, J. Guicheux, P. Weiss and G. Louarn, Acta Biomater., 2011, 7, 1525–1534 CrossRef
- M. Bigerelle, S. Giljean and K. Anselme, Acta Biomater., 2011, 7, 3302–3311 CrossRef CAS
- K. S. Brammer, C. Choi, C. J. Frandsen, S. Oh and S. Jin, Acta Biomater., 2011, 7, 683–690 CrossRef CAS
- L. Zhao, L. Liu, Z. Wu, Y. Zhang and P. K. Chu, Biomaterials, 2012, 33, 2629–2641 CrossRef CAS
- E. D. Miller, K. Li, T. Kanade, L. E. Weiss, L. M. Walker and P. G. Campbell, Biomaterials, 2011, 32, 2775–2785 CrossRef CAS
- H. Egusa, K. Iida, M. Kobayashi, T. Y. Lin, M. Zhu, P. A. Zuk, C. J. Wang, D. K. Thakor, M. H. Hedrick and I. Nishimura, Tissue Eng., 2007, 13, 2589–2600 CrossRef CAS
- S. Kachgal and A. J. Putnam, Angiogenesis, 2011, 14, 47–59 CrossRef CAS
- R. Izadpanah, D. Kaushal, C. Kriedt, F. Tsien, B. Patel, J. Dufour and B. A. Bunnell, Cancer Res., 2008, 68, 4229–4238 CrossRef CAS
- Z. Y. Zhang, S. H. Teoh, M. S. Chong, J. T. Schantz, N. M. Fisk, M. A. Choolani and J. Chan, Stem Cells, 2009, 27, 126–137 CrossRef CAS
- C. C. Tsai, C. L. Chen, H. C. Liu, Y. T. Lee, H. W. Wang, L. T. Hou and S. C. Hung, J. Biomed. Sci., 2010, 17, 64 CrossRef
- N. C. Cheng, S. Wang and T. H. Young, Biomaterials, 2012, 33, 1748–1758 CrossRef CAS
- Q. Bao, Y. Zhao, H. Niess, C. Conrad, B. Schwarz, K. W. Jauch, R. Huss, P. J. Nelson and C. J. Bruns, Stem Cells Dev, 2012, 21, 2355–2363 CrossRef CAS
- A. Torsvik and R. Bjerkvig, Cancer Treat Rev, 2012 DOI:10.1016/j.ctrv.2012.03.005
- M. Maumus, D. Guerit, K. Toupet, C. Jorgensen and D. Noel, Stem Cell Research & Therapy, 2011, 2, 14 Search PubMed
- R. M. Dwyer, S. Khan, F. P. Barry, T. O'Brien and M. J. Kerin, Stem Cell Research & Therapy, 2010, 1, 25 Search PubMed
- B. E. Collins, K. P. S. Dancil, G. Abbi and M. J. Sailor, Adv. Funct. Mater., 2002, 12, 187–191 CrossRef CAS
- S. P. Low, N. H. Voelcker, L. T. Canham and K. A. Williams, Biomaterials, 2009, 30, 2873–2880 CrossRef CAS
- S. D. Alvarez, A. M. Derfus, M. P. Schwartz, S. N. Bhatia and M. J. Sailor, Biomaterials, 2009, 30, 26–34 CrossRef CAS
- S. P. Low, K. A. Williams, L. T. Canham and N. H. Voelcker, Biomaterials, 2006, 27, 4538–4546 CrossRef CAS
- Y. Estrin, E. P. Ivanova, A. Michalska, V. K. Truong, R. Lapovok and R. Boyd, Acta Biomater., 2011, 7, 900–906 CrossRef CAS
- B. Baharloo, M. Textor and D. M. Brunette, J Biomed Mater Res A, 2005, 74, 12–22 CrossRef CAS
- C. P. Pennisi, A. Dolatshahi-Pirouz, M. Foss, J. Chevallier, T. Fink, V. Zachar, F. Besenbacher and K. Yoshida, Colloids Surf., B, 2011, 85, 189–197 CrossRef CAS
- R. McBeath, D. M. Pirone, C. M. Nelson, K. Bhadriraju and C. S. Chen, Dev. Cell, 2004, 6, 483–495 CrossRef CAS
- K. A. Kilian, B. Bugarija, B. T. Lahn and M. Mrksich, Proc. Natl. Acad. Sci. U. S. A., 2010, 107, 4872–4877 CrossRef CAS
- A. M. Osyczka, D. L. Diefenderfer, G. Bhargave and P. S. Leboy, Cells Tissues Organs, 2004, 176, 109–119 CrossRef CAS
- E. H. Javazon, D. C. Colter, E. J. Schwarz and D. J. Prockop, Stem Cells, 2001, 19, 219–225 CrossRef CAS
- H. Yoshimura, T. Muneta, A. Nimura, A. Yokoyama, H. Koga and I. Sekiya, Cell Tissue Res., 2007, 327, 449–462 CrossRef CAS
- M. Guvendiren and J. A. Burdick, Biomaterials, 2010, 31, 6511–6518 CrossRef CAS
- H. Lu, L. Guo, M. J. Wozniak, N. Kawazoe, T. Tateishi, X. Zhang and G. Chen, Biochem. Biophys. Res. Commun., 2009, 381, 322–327 CrossRef CAS
- T. Y. Hui, K. M. Cheung, W. L. Cheung, D. Chan and B. P. Chan, Biomaterials, 2008, 29, 3201–3212 CrossRef CAS
- T. Wang, Z. Xu, W. Jiang and A. Ma, Int. J. Cardiol., 2006, 109, 74–81 CrossRef
- K. A. Purpura, J. E. Aubin and P. W. Zandstra, Stem Cells, 2004, 22, 39–50 CrossRef CAS
- W. Song, H. Lu, N. Kawazoe and G. Chen, Langmuir, 2011, 27, 6155–6162 CrossRef CAS
- I. Wall, N. Donos, K. Carlqvist, F. Jones and P. Brett, Bone, 2009, 45, 17–26 CrossRef CAS
- G. B. Schneider, R. Zaharias, D. Seabold, J. Keller and C. Stanford, J. Biomed. Mater. Res., 2004, 69A, 462–468 CrossRef CAS
- M. J. Dalby, N. Gadegaard, R. Tare, A. Andar, M. O. Riehle, P. Herzyk, C. D. W. Wilkinson and R. O. C. Oreffo, Nat. Mater., 2007, 6, 997–1003 CrossRef CAS
| This journal is © The Royal Society of Chemistry 2012 |