Highly lipophilic fluorescent dyes in nano-emulsions: towards bright non-leaking nano-droplets†
Andrey S.
Klymchenko‡
*a,
Emilie
Roger‡
b,
Nicolas
Anton
b,
Halina
Anton
ac,
Ievgen
Shulov
a,
Julien
Vermot
c,
Yves
Mely§
a and
Thierry F.
Vandamme§
b
aLaboratoire de Biophotonique et Pharmacologie, UMR 7213 CNRS, Université de Strasbourg, Faculté de Pharmacie, 74, Route du Rhin, 67401 ILLKIRCH, France. E-mail: andrey.klymchenko@unistra.fr
bLaboratoire de Conception et Application de Molecules Bioactives, UMR CNRS 7199, Université de Strasbourg, Faculté de Pharmacie, 74, Route du Rhin, 67401 ILLKIRCH, France
cIGBMC (Institut de Génétique et de Biologie Moléculaire et Cellulaire), Inserm U964, CNRS UMR7104, Université de Strasbourg, 1 rue Laurent Fries, 67404 ILLKIRCH, France
First published on 29th October 2012
Abstract
Dye-loaded lipid nano-droplets present an attractive alternative to inorganic nanoparticles, as they are composed of non-toxic biodegradable materials and are easy to prepare. However, to achieve high fluorescence brightness, the nano-droplets have to be heavily loaded with the dyes avoiding fluorescence self-quenching and release (leakage) of the encapsulated dyes from the nano-droplets in biological media. In the present work, we have designed highly lipophilic fluorescent derivatives of 3-alkoxyflavone (F888) and Nile Red (NR668) that can be encapsulated in the lipophilic core of stable nano-emulsion droplets at exceptionally high concentrations in the oil core, i.e. up to 170 mM and 17 mM, respectively, corresponding to ∼830 and 80 dyes per 40 nm droplet. Despite this high loading, these dyes keep high fluorescence quantum yields and thus, provide high nano-droplet brightness, probably due to their bulky structure preventing self-quenching. Moreover, simultaneous encapsulation of both dyes at high concentrations in single nano-droplets allows the observation of FRET. FRET and fluorescence correlation spectroscopy (FCS) studies showed that NR668 release in the serum-containing medium is very slow, while the reference hydrophobic dye Nile Red leaks immediately. This drastic difference in the leakage profile between NR668 and Nile Red was confirmed by in vitro cellular studies as well as by in vivo angiography imaging on zebrafish models, where the NR668-loaded nano-droplets remained in the blood, while the parent Nile Red leaked rapidly from the droplets distributing all over the animal body. This study suggests new molecular design strategies for obtaining bright nano-droplets without dye leakage and their use as efficient and stable optical contrast agents in vitro and in vivo.
1 Introduction
Nanoscale delivery systems represent a rapidly expanding research field, which shows strong promise for the development of new clinical and diagnostic tools. These systems include polymeric and lipid-based nanocarriers such as nanoparticles, liposomes, micelles as well as inorganic nanoparticles.1–4 According to their composition and morphology, hydrophobic or hydrophilic molecules can be encapsulated. While nanocarriers encapsulating drugs serve as therapeutic tools, those encapsulating contrast agents can function as diagnostic imaging tools.1,3 Of particular interest are nanoparticles encapsulating fluorescent agents, which offer great potential in biomedical in vitro or in vivo imaging.3–6 Fluorescence imaging appears as an attractive tool for preclinical studies, since it does not require specific handling and relies on relatively inexpensive hardware in comparison with magnetic resonance imaging (MRI), X-rays, positron emission tomography (PET) or single photon emission computed tomography (SPECT).7–9Different types of fluorescent probes are already used in biological and medical research: organic dyes and inorganic nanoparticles. Unlike organic dyes, inorganic nanoparticles such as quantum dots (QDs)6,10,11 and dye-doped silica nanoparticles12–14 display exceptional brightness and photostability. However, the toxicity and fate of silica nanoparticles and QDs are hard to estimate, due to their composition of toxic elements (cadmium, selenium, indium, etc) and their lack of biodegradability.15,16 On the other hand, organic dyes show good biocompatibility but their brightness is limited. Therefore, encapsulation of organic dyes in organic nanocarriers opens an attractive possibility to develop biocompatible fluorescent nanoparticles. Different structures of lipid-based nanocarriers have already been developed for therapy or imaging, such as liposomes,17,18 nano-emulsions,19–22 nanocapsules,23,24 micro-emulsions,25 solid lipid nanoparticles (SLN)26 and peptide–lipid nanoparticles.27 Among them, lipid nano-emulsions, represented by nano-objects with a liquid core (nano-droplets), are of particular interest for the construction of fluorescent nano-carriers. Indeed, the oily core of nano-droplets is a perfect reservoir for the encapsulation of lipophilic dyes, where they can distribute in a rather homogeneous manner.23,28 As a vast majority of fluorescent dyes are well-characterized in solution, their solubilization in the oil core could enable the generation of nano-carriers with desired fluorescent properties, notably absorption and emission color, brightness, fluorescence lifetime, etc. This is an advantage compared to dye-doped nanoparticles with a solid core, because the fluorescent properties of dyes in the solid state are much less known and difficult to predict. Moreover, the other advantage of nano-carriers with a liquid core is the simple and rapid procedure for their preparation based on spontaneous nano-emulsification,20–22 where the size and composition of the nano-droplets can be easily controlled. Finally, nano-emulsions are usually composed of non-toxic components,22,24 which are biodegradable and/or readily eliminated from the animal body.
The high loading of nanoparticles with dyes is an attractive approach as one can obtain particles with exceptional brightness, comparable or even superior to QDs and silica nanoparticles.29 Though the idea seems to be simple, its realization for nano-emulsion droplets is not easy, as several key problems have to be resolved. Firstly, organic dyes at high concentrations tend to aggregate, resulting in fluorescence self-quenching.29–31 Secondly, most fluorophores are poorly soluble in apolar oils, and thus do not allow high loading in lipid nanocarriers. Third, encapsulated dyes may leak from the nanocarriers into biological media. While dye-doped nanoparticles based on silica14,32,33 and polymers29 show high stability against dye leakage due to their solid matrix, the stability of nano-emulsion droplets against leakage is limited. Indeed, nano-emulsions are dynamic systems, which usually release their lipophilic content rather rapidly on a timescale ranging from minutes to hours depending on the encapsulated molecule.34,35 Therefore, examples of fluorescent lipid nanocarriers containing liquid lipid cores are rare. In one recent work, Texier and coworkers prepared lipid nanocarriers encapsulating cyanine dyes bearing long hydrophobic chains.23 The authors encapsulated up to 53 molecules per particle of 35 nm diameter, which corresponded to a 1 mM concentration of the dye in the oil. They showed that at this high concentration in the oily core of the nano-droplets, the dye preserved its efficient fluorescence, allowing successful cellular and in vivo animal imaging.36 However, no leakage studies in biological media were performed in this work.
In the present work, we designed new fluorescent dyes based on 3-alkoxyflavone37 and Nile Red38,39 which can be encapsulated at exceptionally high concentrations, i.e. ca. 170 and 17 mM, respectively, in the oily core of the nano-droplets. In spite of this high loading, the dyes remain highly fluorescent within the nano-droplets. In addition, this high loading enabled Förster Resonance Energy Transfer (FRET) between two different dyes in the same droplet. Using FRET and fluorescence correlation spectroscopy (FCS) we showed that the leakage of our new dyes into a biological medium (serum) is very slow compared to the rapid leakage of Nile Red, which was taken as a reference of a hydrophobic dye. Finally, clearly different leakage profiles for the new and the reference dyes were observed when the nano-droplets were added to living cells in culture or injected into zebra fish. Thus, for the first time, fluorescent nano-emulsion droplets stable against the leakage of encapsulated dye into biological media are shown.
2 Materials and methods
2.1 Materials
All chemicals and solvents for synthesis were from Sigma-Aldrich. Solutol HS15® (mixture of free polyethylene glycol 660 and polyethylene glycol 660 hydroxystearate) from BASF (Ludwigshafen, Germany) was a kind gift from Laserson (Etampes, France), Labrafac CC® (medium chain triglycerides) was obtained from Gattefossé (Saint-Priest, France). Ultrapure® water was obtained using a MilliQ® filtration system (Millipore, Saint-Quentin-en-Yvelines, France). Culture reagents were obtained from Sigma (St. Louis, USA), Lonza (Verviers, Belgium) and Gibco-Invitrogen (Grand Island, USA).![[thin space (1/6-em)]](https://www.rsc.org/images/entities/char_2009.gif) :heptane, 1:9 as the eluent) to give the product (100 mg, 81%) as a yellow oil. 1H NMR (CDCl3, 400 MHz): δ 8.23 (dd, J1 = 8.0 Hz, J2 = 1.7 Hz, 1H), 8.08 (d, J = 9.3 Hz, 2H), 7.61 (ddd, J1 = 8.8 Hz, J2 = 7.0 Hz, J3 = 1.7 Hz, 1H), 7.47 (dd, J1 = 8.8 Hz, J2 = 1.1 Hz, 1H), 7.34 (ddd, J1 = 8.0 Hz, J2 = 7.0 Hz, J3 = 1.1 Hz, 1H), 6.68 (d, J = 9.3 Hz, 2H), 4.03 (t, J = 6.8 Hz, 2H), 3.33 (m, 4H), 1.77 (m, 2H), 1.62 (m, 4H), 1.28 (m, 30H), 0.87 (m, 9H). HRMS: (m/z): ESI, calcd for C39H60NO3+ 590.4573; found [M+1]+ 590.4575.
:heptane, 2:8 as the eluent). 1H NMR (CDCl3, 400 MHz): δ 8.14 (d, J = 8.8 Hz, 1H), 7.97 (d, J = 2.5 Hz, 1H), 7.52 (d, J = 9.0 Hz, 1H), 7.09 (dd, J = 8.8 Hz, J2 = 2.5 Hz, 1H), 6.55 (dd, J = 9.0 Hz, J2 = 2.5 Hz, 1H), 6.33 (d, J = 2.5 Hz, 1H), 6.25 (s, 1H), 3.98 (dd, J = 5.6 Hz, J2 = 1.4 Hz, 2H), 3.29 (m, 4H), 1.70–1.75 (m, 1H), 1.35–1.53 (m, 6H), 1.28 (m, 18H), 0.81–0.95 (m, 12H). HRMS: (m/z): ESI, calcd for C36H51N2O3+ 559.3901; found [M+1]+ 559.3903.
:heptane, 1:9 as the eluent) to give the product (100 mg, 81%) as a yellow oil. 1H NMR (CDCl3, 400 MHz): δ 8.23 (dd, J1 = 8.0 Hz, J2 = 1.7 Hz, 1H), 8.08 (d, J = 9.3 Hz, 2H), 7.61 (ddd, J1 = 8.8 Hz, J2 = 7.0 Hz, J3 = 1.7 Hz, 1H), 7.47 (dd, J1 = 8.8 Hz, J2 = 1.1 Hz, 1H), 7.34 (ddd, J1 = 8.0 Hz, J2 = 7.0 Hz, J3 = 1.1 Hz, 1H), 6.68 (d, J = 9.3 Hz, 2H), 4.03 (t, J = 6.8 Hz, 2H), 3.33 (m, 4H), 1.77 (m, 2H), 1.62 (m, 4H), 1.28 (m, 30H), 0.87 (m, 9H). HRMS: (m/z): ESI, calcd for C39H60NO3+ 590.4573; found [M+1]+ 590.4575.
:heptane, 2:8 as the eluent). 1H NMR (CDCl3, 400 MHz): δ 8.14 (d, J = 8.8 Hz, 1H), 7.97 (d, J = 2.5 Hz, 1H), 7.52 (d, J = 9.0 Hz, 1H), 7.09 (dd, J = 8.8 Hz, J2 = 2.5 Hz, 1H), 6.55 (dd, J = 9.0 Hz, J2 = 2.5 Hz, 1H), 6.33 (d, J = 2.5 Hz, 1H), 6.25 (s, 1H), 3.98 (dd, J = 5.6 Hz, J2 = 1.4 Hz, 2H), 3.29 (m, 4H), 1.70–1.75 (m, 1H), 1.35–1.53 (m, 6H), 1.28 (m, 18H), 0.81–0.95 (m, 12H). HRMS: (m/z): ESI, calcd for C36H51N2O3+ 559.3901; found [M+1]+ 559.3903.
2.2 Formulation and characterization of nano-emulsions
Nano-emulsions were prepared by spontaneous nano-emulsification. Briefly, the fluorescent dyes were solubilised in Labrafac® CC. Then, Solutol® HS 15 was added and the mixture was homogenized under magnetic stirring at 90 °C. Nano-emulsions were formed by adding ultrapure water. Two sizes of nano-droplets were prepared by varying the proportions between the different components (Table 1).| Components | Formulations | |
|---|---|---|
| A (d ∼ 20 nm) | B (d ∼ 40 nm) | |
| Labrafac CC® | 0.04 g | 0.07 g |
| Solutol HS 15® | 0.16 g | 0.13 g |
| MilliQ® water | 460 μl | 460 μl |
The size distribution of the nano-emulsions was determined by dynamic light scattering on a Zetasizer® Nano series DTS 1060 (Malvern Instruments S.A., Worcestershire, UK) and by FCS (home-built setup, see below).
2.3 Cell culture preparations
HeLa cells were cultured in Dulbecco's modified Eagle medium (D-MEM, high glucose, Gibco-invitrogen) supplemented with 10% (v/v) fetal bovine serum (FBS, Lonza), 1% antibiotic solution (penicillin-streptomycin, Gibco-invitrogen) in a humidified incubator with 5% CO2/95% air atmosphere at 37 °C. Cells plated on a 75 cm2 flask at a density of 106 cells/flask were harvested at 80% confluence with trypsin–EDTA (Sigma) and seeded onto a chambered coverglass (IBiDi) at a density of 0.1 × 10⁶ cells/IBiDi.After 24 h, cells in the IBiDi dishes were washed with PBS (phosphate buffer saline) (Lonza). Then, a solution of dye-loaded nano-droplets diluted at 1:1000 in Opti-MEM was added. In control experiments, cells were incubated in 0.33 μM Nile Red solution in Opti-MEM, which was obtained by addition of an aliquot of Nile Red in DMSO to Opti-MEM (final DMSO concentration was ∼0.1%). Microscopy images were taken after 15 min or 1 h of incubation at 37 °C with the nano-droplets and 15 min in the case of Nile Red alone.
2.4 Fluorescence spectroscopy and microscopy
Absorption and fluorescence spectra were recorded on a Cary 4 spectrophotometer (Varian) and a Fluorolog (Jobin Yvon, Horiba) spectrofluorometer, respectively. Fluorescence emission spectra were recorded at room temperature with 390 and 520 nm excitation wavelengths for F888- and NR668-loaded nano-droplets, respectively. All fluorescence measurements were done using solutions with absorbance ≤ 0.1. Fluorescence quantum yields (QY) of F888- and NR668-loaded nano-droplets were measured using, respectively, 4′-dimethylamino-3-hydroxyflavone in ethanol (QY = 29%),42 and Nile Red in ethanol (QY = 52%),43 as reference. Fluorescence images were taken on a Leica DMIRE2 inverted microscope equipped with a Leica DC350FX CCD camera and a thermostated chamber (Life Imaging Services, Basel Switzerland) for maintaining the temperature at 37 °C. A 63× HCX PLAPO (1.32 NA) objective and a Cy3 filter cube (excitation 535/50 nm, emission 610/75 nm) were used. The size of the images was systematically 140 × 105 μm.2.5 Fluorescence correlation spectroscopy (FCS) and data analysis
FCS measurements were performed on a two-photon platform including an Olympus IX70 inverted microscope, as described previously.44 Two-photon excitation at 780 nm (5 mW laser output power) was provided by a mode-locked Tsunami Ti:sapphire laser pumped by a Millenia V solid state laser (Spectra Physics). The measurements were carried out in an eight-well Lab-Tek II coverglass system, using a 300 μL volume per well. The focal spot was set about 20 μm above the coverslip. The normalized autocorrelation function, G(τ) was calculated online by an ALV-5000E correlator (ALV, Germany) from the fluorescence fluctuations, δF(t), by G(τ) = <δF(t)δF(t + τ)>/<F(t)>2 where <F(t)> is the mean fluorescence signal, and τ is the lag time. Assuming that lipid nano-droplets diffuse freely in a Gaussian excitation volume, the correlation function, G(τ), calculated from the fluorescence fluctuations was fitted according to Thompson:45where τd is the diffusion time, N is the mean number of fluorescent species within the two-photon excitation volume, and S is the ratio between the axial and lateral radii of the excitation volume. The excitation volume is about 0.34 fL and S is about 3 to 4. Typical data recording times were 10 min, using dye-loaded lipid nano-droplets diluted 1
 :10000 from the originally prepared nano-emulsion. Using 6-carboxytetramethylrhodamine (TMR from Sigma-Aldrich) in water as a reference (DTMR = 421 μm2 s−1),46 the diffusion coefficient, Dexp, of the lipid nano-droplets was calculated by: Dexp = DTMR × τd(TMR)/τd(droplets) where τd(TMR) and τd(droplets) are the measured correlation times for TMR and lipid nano-droplets, respectively. The hydrodynamic diameter, d, of the nano-droplets was calculated with the Stokes–Einstein equation: d = 2kbT/6πηDexp, where kb is the Boltzmann constant, T is the absolute temperature (293 K) and η is the viscosity of the solution (1 cP). The nano-droplet concentration was calculated from the droplet number by: Cdroplets = Ndroplets/NTMR × CTMR, using a TMR concentration of 50 nM.
2.6 Dye release studies
The release of the dye was estimated using Förster resonance energy transfer (FRET) between two encapsulated dyes and FCS with one encapsulated dye. The release of the dyes from the nano-droplets was performed in water, cell culture medium (Opti-MEM, Gibco-invitrogen) in the absence or presence of 10% of fetal bovine serum (FBS). In both studies the nano-droplets were diluted 10000-times from the original formulation into the medium of interest. In the FRET studies nano-droplets encapsulating 0.5% of F888 (with respect to Labrafac CC®) as energy donor and 0.5 wt.% of Nile Red or NR668 as energy acceptor were used. The first fluorescence spectra were measured after 3 min incubation at RT. Then, samples were incubated for 1 h, 3 h and 6 h at 37 °C. The donor in the nano-droplets was excited at 390 nm. FRET was quantified as the fluorescence intensity ratio between the maximum of the donor (450 nm) and acceptor (590 nm). The fluorescence spectra were systematically corrected from the spectrum in the blank media. In the other study the release was evaluated by FCS as the brightness (the photon count rate per droplet) and apparent concentration of the emissive species. If the dye is released from the nano-droplets the brightness decreases, while the apparent concentration of the emissive species increases. The nano-emulsions prepared in water were measured 5 min after dilution in the corresponding media at room temperature or after incubation in these media at 37 °C for 1 h or 6 h.
2.7 In vivo imaging on zebrafish
Zebrafish were kept at 28 °C and bred under standard conditions. The transgenic line, Tg(fli1:eGFP)y1,47 expressing eGFP specifically in the endothelial cells, was used in order to visualize the vasculature. For the angiography, the embryos, 3 days after fertilization, were anaesthetized in egg water containing 0.04% tricaine and 0.05% phenyl thiourea (Sigma-Aldrich) and immobilized in 0.8% low melting point agarose (Sigma). The injections were performed using a Nanoject microinjector (Drummond Scientific, Broomal, PA, USA). The glass capillary was filled with NR668-loaded nano-emulsions (1 wt.% in oil) of the nano-droplets solution in 5 mM HEPES and 2.3 nL were injected in the sinus venosus of the embryos. The nano-emulsion was immediately distributed in all the vasculature. The injected embryos were placed on the microscope stage and imaged within 5 min after injection. Intravital confocal microscopy was performed on a Leica SP5 fixed stage direct microscope with a 25× (NA 0.95) and 10× (NA 0.3) water immersion objectives. 488 nm argon laser line was used to excite both eGFP and the Nile Red dyes, and their emission was detected by two separate PMTs in the spectral range 500–530 nm and 620–650 nm, respectively. At these conditions, no cross-talk between the channels was observed. Confocal z-stacks and time lapses were recorded and treated by the ImageJ software (http://rsbweb.nih.gov/ij/). The embryos were imaged during one hour post injection and no toxicity due to the injection or to the illumination was observed. All experiments performed with zebrafish complied with the European directive 86/609/CEE and IGBMC guidelines validated by the regional committee of ethics.3 Results and discussion
3.1 Design of fluorescent dyes
In order to achieve high dye loading and its low leakage from the nano-droplets, the fluorescent dyes have to be designed with highly lipophilic functions. Therefore, the dye should be a neutral apolar molecule bearing as many apolar hydrophobic groups as possible. Using bulky hydrophobic groups should further improve the dye solubility and prevent dye aggregation at high concentrations. Two dyes, F888 and NR668, were synthesized (Fig. 1), both featuring three alkyl chains of 6–8 carbon atoms. This medium chain length is a compromise between very long alkyl chains presenting poor solubility and very short ones featuring insufficient hydrophobicity. Moreover, the chain length of the dyes matches perfectly with that of fatty acid residues of Labrafac CC® (caprylic/capric triglyceride), which is expected to dissolve the dyes in the nano-droplet core. F888 is a 3-hydroxyflavone derivative with two octyl chains at the 4′-nitrogen and one octyl chain at the 3-OH group. This fluorophore was selected because it is neutral and apolar, showing absorption and emission in the blue region of the visible spectrum.37 Moreover, F888 should have no tendency to aggregate as the aromatic moiety of this dye is not perfectly flat due to the steric hindrance between the 2-aryl and 3-alkoxy group. NR668 is a Nile Red38,39 derivative also bearing three alkyl chains. As this dye presents a perfectly flat aromatic structure, one bulky alkyl group was used in order to minimize its π-stacking aggregation.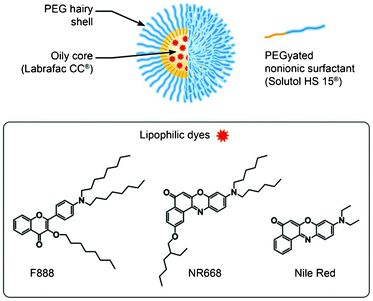 | ||
| Fig. 1 Schematic presentation of a nano-droplet and chemical structure of the new lipophilic dyes used for encapsulation. Nile Red was used as a reference for characterizing the release properties. | ||
3.2 Nano-droplet preparation
In the first step, solutions of the new dyes in Labrafac CC® were prepared. F888 is a viscous oil, and is readily miscible in Labrafac CC® allowing the preparation of a 10 wt.% (170 mM) solution (higher concentrations were not tested). In the case of NR668, which is a solid, the solubility was lower. Several hours of vortex at 80 °C were needed to obtain a clear solution of 5 wt.% (90 mM) solution in Labrafac CC®, which did not show any precipitation after cooling. Nevertheless, NR668 was much more soluble than the parent Nile Red. Indeed, to prepare 0.1 and 0.5 wt.% of Nile Red in Labrafac CC®, a co-solvent (acetone) has to be used and then evaporated just before the preparation of the nano-emulsion. The obtained solutions in Labrafac CC® were used for preparing the dye-loaded nano-emulsion droplets. Different methods are described in the literature for the preparation of the nano-emulsions, ranging from high energy methods using specific devices24 (sonifiers, high pressure homogenizers), to low-energy nano-emulsification24,48,49 using the self-assembling properties of surfactants. Herein, we choose to follow one of the simplest methods, spontaneous nano-emulsification,48 for which the nano-emulsion is generated as a result of mixing of two phases: (i) oil solubilizing lipophilic dye and surfactants (beforehand homogenized and maintained at 90 °C), and (ii) pure MilliQ® water (at room temperature). After their mixing, stable monodisperse nano-emulsions are immediately formed. This protocol was already described for Labrafac CC® (as an oil core) and Solutol HS15® (as a surfactant).48 Moreover, this process can be easily controlled since notably, the nano-droplets size is directly linked to the surfactant-to-oil ratio.48,50 Generally recognized as safe (GRAS) ingredients, such as Labrafac CC® (medium chain triglycerides) and Solutol HS15® (i.e. PEG-660-hydroxystearate), were selected for the formulation of the nano-emulsions of this study. These GRAS ingredients are compatible with parenteral administration (i.e. injectable) in humans.Dynamic light scattering measurements for two representative formulations A and B (Table 1) provided narrow size distributions centered around 23 nm and 43 nm diameter, respectively (henceforth called 20- and 40 nm nano-droplets).
Importantly, the sizes of the nano-droplets encapsulating 10 wt.% of F888 or 5 wt.% of NR668 (concentrations in the oil) were identical to the sizes of the blank ones (Table 2). Moreover, the presence of the dyes did also not affect the polydispersity and surface charge of the droplets. It follows that the high dye loading does not influence the physicochemical properties of the oil and thus, the formulation process. Importantly, the nano-droplets remained unchanged after 3 months of storage at 4 °C in the dark, in agreement with the high stability of nano-emulsions.20,21 In contrast, droplets containing 0.5 wt.% of Nile Red showed precipitation of the dye after 1 week of storage at 4 °C. To summarize, we obtained stable nano-emulsions encapsulating F888 and NR668 at exceptionally high concentrations, higher by a few orders of magnitude compared to those reported for cyanine dyes.23
| Formulation | Dye | [Dye] (%) | d h, nm | PDI | ξ, mV |
|---|---|---|---|---|---|
| a [Dye] is the initial dye concentration in Labrafac CC® used for the nano-droplet preparation. dh is the hydrodynamic diameter, PDI is the polydispersity index, and ξ is the zeta potential. The errors for dh and ξ values were ±2 nm and ±10%, respectively. | |||||
| A | — | 0 | 22 | 0.21 | −4.8 |
| B | — | 0 | 45 | 0.13 | −8.3 |
| A | F888 | 10 | 24 | 0.08 | −5.2 |
| B | F888 | 10 | 40 | 0.07 | −4.5 |
| B | F888 | 1 | 46 | 0.11 | −13.5 |
| B | NR668 | 5 | 36 | 0.03 | −6.3 |
| B | NR668 | 1 | 43 | 0.10 | −12.5 |
| B | Nile Red | 0.5 | 45 | 0.10 | −10.1 |
| B | Nile Red | 0.1 | 48 | 0.17 | −7.2 |
3.3 Fluorescence properties
The absorption and fluorescence properties of the obtained droplets were then studied and compared to those for diluted solutions of the dyes (absorbance around 0.1) in neat organic solvents and Labrafac CC®. The absorption spectra of both F888 and NR668 in the nano-droplets were similar to those in neat Labrafac CC® and organic solvents (Table 3). This indicates that both F888 and NR668 do not form specific aggregates in the Labrafac CC® core of the nano-emulsion droplets, which would significantly affect their spectra. The nano-droplets are highly fluorescent, showing a single emission band. For F888 at 1 wt.% and 10 wt.% contents, the emission maximum is red-shifted by 8 and 17 nm with respect to that in neat Labrafac CC® (Table 3). As 3-alkoxychromones show fluorescence solvatochromism (Table 2)37, these red shifts could be attributed to a somewhat increased environment polarity of the dye in the oil core of the nano-droplet compared to the neat oil. However, these shifts are relatively small compared to the 56 nm red-shift observed on changing the solvent from apolar dioxane to polar ethanol (Fig. 2). Therefore, the dye appears well encapsulated in the Labrafac CC® containing core and does not experience the polar environment of water or Solutol HS15®. The larger red-shift observed for higher loading (10 wt.%) could be related to some fraction of the dyes being located at the more polar regions of the droplet, probably within the water–oil interface occupied by Solutol HS 15®. On the other hand, the fluorescence quantum yield of F888 loaded in the nano-emulsion droplets remains very high for any droplet size, close to the one in neat organic solvents and Labrafac CC® (Table 3). A decrease in the quantum yields is observed in the following sequence: Labrafac CC® > 1 wt.% droplets > 10 wt.% droplets, but it is relatively small, indicating that the concentration-dependent self-quenching of F888 is almost negligible even at 10 wt.% concentration. This indicates that the 40 nm droplets containing 10 wt.% of F888 in their core contain a large quantity of highly fluorescent dye molecules, which should make the nano-droplet extremely bright.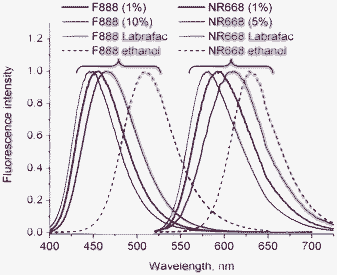 | ||
| Fig. 2 Fluorescence spectra of F888 and NR668 in nano-emulsions, neat Labrafac CC® oil and ethanol. | ||
| Dye | Samples | Abs max, nm | Fluo max, nm | QY (%) |
|---|---|---|---|---|
| a Abs max (nm) and Fluo max (nm) are the absorption and fluorescence maxima; QY (%) is fluorescence quantum yield. | ||||
| F888 | 20 nm-10% | 390 | 466 | 78 |
| 40 nm-10% | 390 | 464 | 72 | |
| 40 nm-1% | 388 | 455 | 87 | |
| Labrafac® | 387 | 447 | 91 | |
| Dioxane | 385 | 454 | 65 | |
| Ethanol | 400 | 510 | 48 | |
| NR668 | 40 nm-1% | 526 | 592 | 60 |
| 40 nm-5% | 523 | 610 | 13 | |
| Labrafac® | 526 | 580 | 61 | |
| Dioxane | 518 | 575 | 84 | |
| Ethanol | 550 | 631 | 42 | |
| NR | 40 nm-0.1% | 530 | 599 | 73 |
| Labrafac® | 526 | 581 | 78 | |
| Dioxane | 520 | 575 | 91 | |
| Ethanol | 550 | 626 | 52 | |
In the case of NR668, being encapsulated at 1 wt.%, its maximum emission wavelength and its quantum yield are close to those in neat Labrafac CC® (Table 3). In contrast, at 5 wt.% in the nano-droplets, the emission maximum is 30 nm red-shifted with respect to Labrafac CC®, which is significant compared to the 50 nm polarity effect (dioxane-ethanol) observed for this dye (Fig. 2). This red shift suggests that at this high loading some part of the dye is probably exposed to the more polar environment at the interface occupied by Solutol HS15®. However, we also cannot exclude that at high concentrations, NR668 molecules form aggregates with red-shifted emission. The quantum yield of 5 wt.% NR668 nano-droplets is much lower than the one in Labrafac CC® (Table 3), so that at this high loading, NR668 is likely self-quenched.
As the nano-droplets loaded with the parent Nile Red at 0.5 wt.% were not stable enough, only 0.1 wt.% Nile Red-loaded nano-emulsions were characterized. While their fluorescence quantum yield was high, their emission spectrum was broader and considerably red-shifted with respect to that in Labrafac CC® (Table 2, Figure 1S† in the ESI), indicating that this fluorophore is probably present both in the core and at the water–oil interface of the droplets. It should be noted that the fraction of Nile Red in water for the present experimental conditions was negligible, because the absorption spectrum of the Nile Red-loaded nano-droplets is close to that of Nile Red in Labrafac CC® without visible contribution of the red-shifted band of this dye in water (Figure S2† in the ESI).
Then, we further characterized our best nano-emulsion–dye formulations by fluorescence correlation spectroscopy (FCS). This technique measures the diffusion of the fluorescent species through the two-photon excitation volume, providing information about their number, size and brightness.44–46 The auto-correlation curves of the dye-loaded nano-emulsions (Fig. 3) could be well-fitted with only one correlation time, giving a droplet size (Table 4) in excellent agreement with that measured by DLS (Table 2). Moreover, FCS further indicated that no other fluorescent species, such as large aggregates or small micelles, are present in solution. FCS also allows the estimation of the photon count rate per droplet (i.e. brightness), which we calculated with respect to that of 6-carboxytetramethylrhodamine (TMR) in water, used as a reference. The 20 and 40 nm droplets prepared with 10 wt.% of F888 were 22 and 205 times as bright as TMR, while 40 nm droplets with 1 wt.% of NR668 were 21 times as bright (Fig. 3). Thus, the obtained lipid nano-droplets showed a remarkable brightness. Moreover, FCS allowed us to recalculate the concentration of the droplets in the 1:10000 diluted nano-emulsion (from original formulation), giving 9.8, 1.8 and 2.2 nM concentrations for 20 nm F888, 40 nm F888 and 40 nm NR668 droplets, respectively (Table 4). Meantime, based on the absorption data, we can estimate that the dye concentration in the 1:10000 diluted nano-emulsion is 1130, 1500 and 180 nM, respectively. Thus, on average 115, 830 and 80 molecules are present in 20 nm F888, 40 nm F888 and 40 nm NR668 droplets, respectively. Thus, our simple protocol using new hydrophobic dyes provides highly fluorescent nano-droplets encapsulating a large number of hydrophobic dyes. Due to this high loading, these nano-droplets are much brighter than TMR in water.
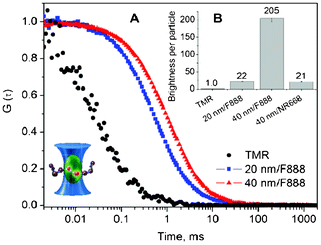 | ||
| Fig. 3 Typical examples of FCS correlation curves (A) and obtained nano-droplet brightness (B) for dye-loaded nano-emulsions compared to TMR, used as reference. Inset: principle of FCS measurements. | ||
| Formulation | Dye | [Dye] (%) | τ, ms | d h, nm | Brightness | [Droplets], nM | Dyes/droplet |
|---|---|---|---|---|---|---|---|
| a τ is the correlation time (for TMR, it was 0.035 ms); brightness is the ratio of photon count rate per droplet with respect to TMR; [Droplets] is the droplet concentration, estimated from FCS data (see Materials and Methods). | |||||||
| A | F888 | 10 | 0.808 | 21 | 22 | 9.8 | 115 |
| B | F888 | 10 | 1.54 | 42 | 205 | 1.8 | 830 |
| B | NR668 | 1 | 1.51 | 43 | 21 | 2.2 | 80 |
| B | Nile Red | 0.1 | 1.35 | 39 | 2.0 | 2.25 | 8 |
3.4 Observation of FRET inside the nano-droplets
FRET is a powerful tool for the characterization of molecular interactions and monitoring the integrity of the nano-objects. Since efficient FRET requires short distances between the donor and acceptor fluorophores (2–10 nm), one should achieve concentrations in the mM range to realize FRET inside the nano-droplets. As we succeeded to load the nano-droplets with high concentrations of the dyes, we tested the possibility to obtain FRET inside them. The F888 and NR668 dyes are a perfect FRET couple, because the emission maximum of F888 in the nano-droplets is very close to the absorption maximum of NR668 (Table 3). The calculated Förster distance R0 for the F888–NR668 couple in Labrafac CC® is 7.0 nm. In order to avoid the use of a complex model based on FRET with multiple acceptors, we estimated the minimal concentration needed to achieve a distance between the donor and acceptor corresponding to 2 × R0 = 14 nm. Assuming a simple geometrical model, where the dye molecules are organized in solution as cubic lattices separated by 14 nm distance, the average free volume per dye molecule in solution is (14 nm)3 = 2744 nm3, which corresponds to a total concentration of both donor and acceptor of 0.60 mM. Thus, in the case of a 1:1 molar ratio donor and acceptor, the minimal concentration of each partner, at which the distance between donor and acceptor is 14 nm, should be around 0.30 mM. To verify experimentally the existence of FRET at different concentrations of dyes, we prepared nano-droplets containing both dyes at equimolar ratio, ranging from 0.02% (0.36 mM) up to 0.5% (9 mM), where NR668 still keeps invariant fluorescence properties. The fluorescence spectra were obtained by exciting the donor at 390 nm. Nano-droplets containing 0.02 wt.% of both dyes showed almost exclusive emission of the F888 dye (Fig. 4), indicating that, in line with our estimations, FRET is almost undetectable in these conditions. This result also shows that the direct excitation of the acceptor at 390 nm is very low. In contrast, for dye concentrations above 0.1 wt.% (1.8 mM), the relative intensity of the long-wavelength band (acceptor) progressively increases (Fig. 4), while the donor fluorescence drops, evidencing an increase in the efficiency of FRET from F888 to NR668. At 0.2 wt.% (3.6 mM) and 0.5 wt.% (9 mM) of the dyes, FRET efficiencies estimated from the changes in the donor intensity were approx. 45 ± 10% and 65 ± 10%, respectively. When nano-droplets were prepared from 0.5 wt.% of F888 and Nile Red, a similar FRET efficiency was achieved (approx. 75 ± 10%). To the best of our knowledge, this is one of the first reports where FRET inside lipid nano-droplets was performed. Only one recent report showed FRET in the liquid core of lipid nano-carriers, though somewhat lower concentrations (<4 mM) of the donor and acceptor partners were used.51 Observation of the highly efficient FRET inside the nano-droplet core became possible in the present work because of the exceptionally high loading of the droplets with both donor and acceptor dyes.
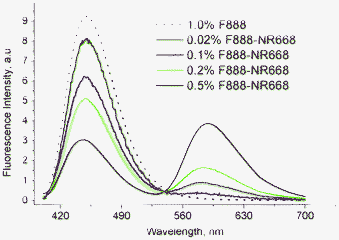 | ||
| Fig. 4 Observation of FRET inside lipid nano-droplets at different concentrations of donor (F888) and acceptor (NR668), encapsulated at a 1:1 molar ratio. The dotted line corresponds to nano-droplets containing only the donor. The fluorescence spectra were recorded at 390 nm excitation wavelength. To compare the spectra, their absolute fluorescence intensity was divided by the F888 concentration. | ||
3.5 Studies of dye release in biological media
Though FRET is a well-established technique to monitor proximity between the fluorophores in biomolecules, it has never been applied so far for monitoring the dye leakage from nano-droplets. Using our FRET nano-emulsions, we could easily test through the changes in FRET efficiency whether the dyes remain inside the droplets or leak to the bulk solution. Serum, which is present in cell culture media, binds readily hydrophobic molecules52–55 and could therefore extract hydrophobic dyes from the droplets and thus affect the FRET signal inside the nano-droplets. The FRET nano-droplets containing F888 as the FRET donor and NR668 (0.5 wt.%) or Nile Red (0.5 wt.%) as the acceptor were incubated in different media: water, Opti-MEM (a common cellular medium used for fluorescence imaging), and Opti-MEM with 10 wt.% serum (Opti-MEM+FBS). Almost no changes in the fluorescence spectra were observed when the F888–NR668 nano-droplets were incubated with Opti-MEM or Opti-MEM+FBS for 3 min at room temperature (Fig. 5B and C). In sharp contrast, the F888–Nile Red-loaded nano-droplets incubated in the same conditions showed an increase of the donor fluorescence intensity along with a decrease of the fluorescence intensity of the acceptor (Fig. 5A and C). This result indicates a strong decrease in the FRET efficiency and thus, a rapid release of Nile Red from the lipid nano-droplets in the presence of biological media. The effect is stronger in the case of Opti-MEM+FBS, emphasizing the contribution of the serum in the dye release. Compared to Nile Red, the negligible release observed for NR668 is likely a consequence of its much higher lipophilicity. To further characterize the NR668-containing nano-emulsions, we incubated them in the same media for 1, 3, and 6 h at 37 °C. In Opti-MEM, no change in the intensity ratio of the donor–acceptor was observed, while in Opti-MEM+FBS a small decrease in this ratio was detected (Fig. 5C). Thus, the nano-emulsion appears highly stable against the dye release in Opti-MEM even for long incubation times at 37 °C. In the presence of Opti-MEM+FBS medium, the observed small changes cannot be related to dye release, which would result in the opposite effect (i.e. increase in the donor–acceptor intensity ratio), and probably result from other processes such as the adsorption of serum components on the nano-droplets.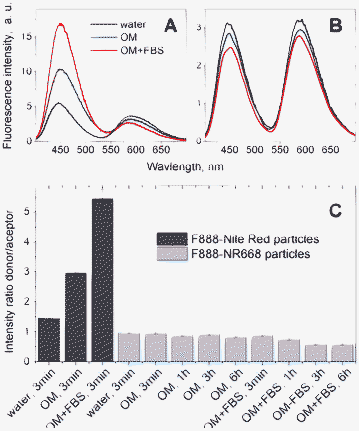 | ||
| Fig. 5 Investigation by FRET of the dye release from the lipid nano-droplets in different media: water, Opti-MEM (OM) and Opti-MEM with 10 vol.% FBS (OM+FBS). Droplets encapsulating 0.5% of F888 (with respect to Labrafac CC®) as energy donor and 0.5 wt.% of Nile Red (A) or NR668 (B) as energy acceptor were used. The nano-droplets were diluted 10000-times from the original formulation into the medium of interest. The first fluorescence spectra were measured after 3 min incubation at RT (A and B). Then, samples were incubated for 1 h, 3 h and 6 h at 37 °C. FRET was quantified as the fluorescence intensity ratio between the maximum of the donor (450 nm) and acceptor (590 nm) (C). The donor in the nano-droplets was excited at 390 nm. | ||
Since dye release in the presence of serum should affect the nano-droplet brightness and the quantity of emissive species in solution, FCS appears as an appropriate complementary method for monitoring the dye release. In these experiments, 40 nm droplets with 1 wt.% NR668 were compared with droplets of the same size containing 0.1 wt.% of the parent Nile Red. All the FCS data obtained in these experiments fitted well to a single-component model. Within the course of incubation (5 min, 1 h and 6 h), the Nile Red-loaded nano-droplets in Opti-MEM without serum showed a progressive drop in their fluorescence brightness, accompanied by a strong increase in the apparent concentration of emissive species (Fig. 6). Moreover, the brightness of the nano-droplets was observed to drop >10-fold immediately after diluting the nano-emulsion in water or Opti-MEM containing 10 wt.% of serum, while no changes were observed for longer incubation times. This drop is accompanied by a strong (>25-fold) increase in the apparent concentration of emissive species, again with no changes for longer incubation times (Fig. 6). The observed changes can be clearly connected with the release of Nile Red from the lipid nano-droplets. Indeed, the leaked dye likely binds the components of the medium and produces the observed increase in the apparent concentration of emissive species, while decreasing the brightness of the lipid nano-droplets. The dye release is particularly fast in the presence of serum, which contains proteins that can strongly bind hydrophobic dyes (serum albumins in particular).52–55 As the leaked dye probably binds to the proteins and/or lipoproteins of the serum, the size of the new emissive species should not drastically differ from the nano-droplet size, thus explaining the good fit of the FCS curves to a one-component model. Nevertheless, the goodness of the fit to the one-component model decreased significantly for Nile Red nano-droplets in the presence of serum (as can be seen from the larger experimental errors in Fig. 6), indicating an increased heterogeneity of the emissive species, as a consequence of the Nile Red leakage from the nano-droplets. Remarkably, nano-droplets encapsulating 1 wt.% of NR668 did not show any changes in Opti-MEM medium even after 6 h of incubation. In the presence of serum, a relatively slow decrease in the droplet brightness was observed, with about a 2-fold change after incubation for 6 h at 37 °C, which is accompanied by an almost negligible change in the apparent concentration of the emissive species (Fig. 6). Thus, the FCS results confirmed that the nano-droplets encapsulating NR668 are relatively stable in biological media, while Nile Red shows a strong tendency to leak from the droplets in Opti-MEM and particularly in Opti-MEM with serum. These conclusions are fully in line with our FRET results, suggesting that the new Nile Red derivative NR668 bearing three long hydrophobic chains enables both a strong improvement in the dye encapsulation level and an increased nano-droplet stability against dye release in biological media as compared to the parent Nile Red. These three long chains increase the dye hydrophobicity strongly (estimated logP = 9.22 and 2.98 for NR668 and Nile Red, respectively), which decreases its escape drastically from the apolar core of the nano-droplets. The observation of the fast release of Nile Red in our studies corroborates with previous studies showing that other lipophilic molecules can leak from nano-emulsions on the time scale of minutes.34,35
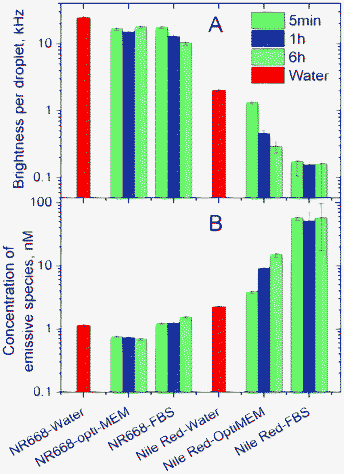 | ||
| Fig. 6 Dye release studies by FCS. (A) Brightness and apparent concentration (B) of emissive species in water and in biological media determined from FCS data. Brightness is the photon count rate per droplet. The nano-emulsions prepared in water were measured 5 min after dilution in the indicated media at room temperature or after incubation in these media at 37 °C for 1 h or 6 h. Data in water, measured 5 min after dilution at room temperature, are presented for comparison. | ||
3.6 Interaction with living cells
To further evaluate our highly fluorescent nano-droplets, we addressed their possible binding and internalization into living cells. Nano-droplets loaded with NR668 (1 wt.%) or Nile Red (0.1 wt.%) were added to living cells (in Opti-MEM without serum) and fluorescence images were recorded after different incubation times (Fig. 7A to D). It can be seen that the cells remained non-fluorescent after incubation with NR668 nano-droplets (Fig. 7C and D). This observation is similar to that reported before for cyanine-dye loaded nanoparticles,36 and is probably connected with the PEGylated surface of the nano-droplets that likely inhibits the cellular uptake of the nanocarriers.56,57 NR668 alone was not tested with cells as it is absolutely insoluble in water. In contrast, cells incubated with Nile Red-loaded nano-droplets showed a clear spotted fluorescence inside the cells that increases with time (Fig. 7A and B). A very similar result is observed when Nile Red is added alone to the cells (see Fig. S3†in the ESI) showing fluorescent dots, which correspond to intracellular lipid droplets according to previous studies.26 As nano-droplets do not enter the cells, the observed intracellular fluorescence is likely due to the release of the Nile Red dye from the droplets inside the cells. Thus, the cellular studies are fully in line with the FRET and FCS data showing the fast leakage of Nile Red into the Opti-MEM medium with serum, and its absence for NR668. These observations are very important, as Nile Red is commonly used for tracking the internalization of various nanostructures, including lipid nano-emulsions or nanoparticles inside the cells. Therefore, Nile Red should be used with great care, as it can lead to artifacts related to dye release. Evidently, NR668 appears much more suitable for monitoring the interaction of lipid-based nanocarriers with cells, as no dye release artifacts are observed with this dye.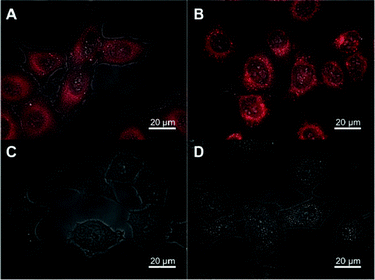 | ||
| Fig. 7 Combined fluorescence and transmission images of HeLa cells incubated with 40 nm nano-droplets containing 0.1 wt.% of Nile Red (A and B) or 1 wt.% of NR668 (C and D) for different lengths of time: 15 min (A and C) and 2 h (B and D). | ||
3.7 In vivo imaging on zebrafish
In order to confirm the suitability of the NR668-loaded nano-droplets for biological imaging and verify the dye leakage in vivo, we performed microangiography experiments on living zebra fish embryos. A 2.3 nL volume of the Nile Red- or NR668-containing nano-emulsions was injected in the sinus venosus of the embryos, a sac that collects blood from the veins at the entry of the heart. Fig. 8 shows a general view of the whole embryo vasculature and a zoomed in view of the trunk region. To confirm the specificity of labeling within the vascular network, we injected the nano-emulsions into a transgenic line expressing eGFP specifically in the endothelial cells (Tg(fli1:eGFP)y1).47 The endothelial cells, which constitute the vessel walls, expressing the eGFP are visualized in the green channel and the nano-droplets in the red one. Both types of nano-droplets were immediately distributed in the entire vascular system. However, the labeling patterns showed very different characteristics within the 5–30 min period after injection. 30 min after injection of the Nile Red-containing nano-emulsion, the dye diffused and accumulated in the endothelial cells, as can be seen from the co-localized green fluorescence from the endothelial cells and the red one of the dye (Fig. 8A–C). Moreover, a diffuse labeling of the surrounding tissues was also observed, indicating a fast spreading of Nile Red over the animal body (Fig. 8B).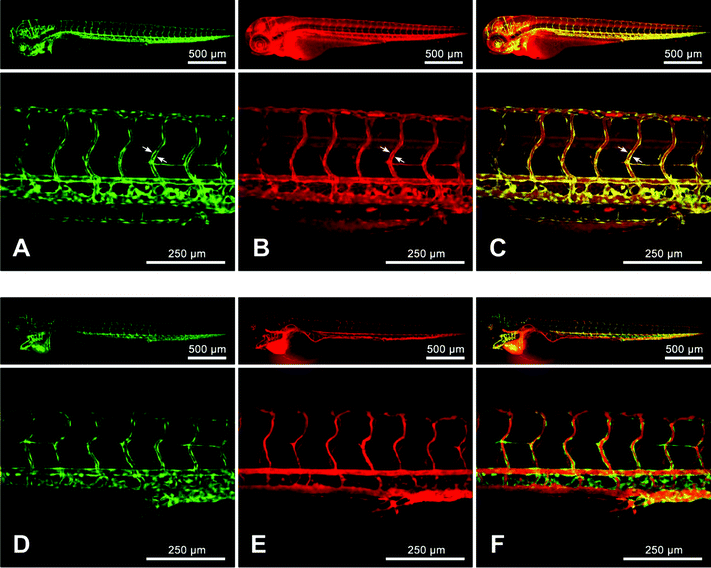 | ||
| Fig. 8 Zebrafish microangiography using nano-droplets containing 0.1 wt.% of Nile Red (A, B and C) or 1 wt.% of NR668 (D, E and F) with the Tg(fli1:eGFP)y1 line. 3 days post fertilization, the living zebrafish embryos were injected with 2.3 nL of nano-emulsions diluted twice in HEPES buffer (pH 7.4) and imaged with a confocal microscope. The images present the global view (upper panels) and a zoomed in view of the trunk vasculature (lower panels). The images in green (A and D) present endothelial cells expressing eGFP, while in red—fluorescence of Nile Red (B) and NR668 (E), 30 min after injection of the nano-emulsion. The arrows show the endothelial cells. The merged image (C) shows the localization of Nile Red in the endothelium and the global diffuse labeling of the entire embryo, while the merged image (F) shows no co-localization of NR688 with the endothelial cells. | ||
In contrast, NR688 was detected exclusively in the lumen of the vessels, as shown in Fig. 8E. No labeling of the endothelial cells was visible 30 min after injection with the nano-emulsion, as the interior of the blood vessels and the endothelial cells are distinctly colored in red and green, without co-localization (Fig. 8F). Thus, in contrast to the nano-droplets loaded with the parent Nile Red, no dye leakage was observed in the blood circulation system with the NR668-loaded nano-droplets within the observation time. This stability of the NR688 nano-emulsion represents an important advantage for microangiography experiments typically performed by injecting fluorescent microbeads58 or QDs.59 In both cited studies, a relatively fast accumulation of the fluorescent particles in the endothelial cells was observed. This labeling of the endothelium can be bothering when a precise delimitation of the lumen is needed, for example during the lumenization of newly formed vessels or vessel fusion during the developmental processes.60 In this context, the NR688-containing nano-droplets represent an imaging tool perfectly adapted for microangiography experiments. Other in vivo studies on similar Labrafac CC®–Solutol HS15® nano-carrier systems showed sufficiently long circulation half-life in the blood stream of Wistar rats (over 2h),61 which showed the potential of these systems for targeted labeling and long-time observations.
This important result together with the FRET, FCS and cellular studies indicates that the modified Nile Red dye NR668 not only allows the fabrication of highly fluorescent nano-droplets, stable against self-quenching, but also prevents dye leakage in biological media. This latter point allows the successful application of the obtained fluorescence nano-droplets to in vivo imaging, avoiding experimental artifacts related to dye leakage.
4 Conclusions
We designed highly lipophilic fluorescent dyes based on 3-alkoxyflavone (F888) and Nile Red (NR668) that can be encapsulated inside the hydrophobic core of lipid nano-emulsion droplets at exceptionally high concentrations (up to 170 mM and 830 dyes per 40 nm droplet for one of the dyes). Due to their bulky nature, these dyes maintained a high fluorescence quantum yield with low self-quenching even at this high loading, allowing the preparation of very bright fluorescent nano-droplets. Moreover, high loading allowed us to realize FRET between two different dyes inside the nano-droplets. FRET and fluorescence correlation spectroscopy (FCS) studies showed that NR668 release in the presence of serum is very slow, while the reference hydrophobic dye Nile Red leaks immediately. This drastic difference in the leakage profile between NR668 and Nile Red was confirmed by in vitro cellular studies. Finally, in vivo imaging in zebrafish showed perfect applicability of NR668-loaded nano-droplets for microangiography, while Nile Red-based droplets showed rapid diffusion of the dye to the endothelial cells of the vessels and to other tissues. Thus, the present work shows that to obtain efficient optical probes for in vitro and in vivo imaging based on nano-droplets, the problem of dye leakage from the nano-droplets in different biological media (serum, living cells and small animals) has to be resolved, and it suggests a path to bright and non-leaking lipid nano-carriers.Acknowledgements
This work was supported by CNRS, Université de Strasbourg, ANR JCJC (ANR-11-JS07-014-01), INSERM, FRM, HFSP and Marie Curie FP7. The financial support of IS from the French Embassy and University of Strasbourg is acknowledged. We thank to D. Dujardin and R. Vauchelles from the PIQ imaging platform for help with the fluorescence imaging. L. Richert and V. Kilin are acknowledged for their help with the FCS measurements.References
- I. Brigger, C. Dubernet and P. Couvreur, Adv. Drug Delivery Rev., 2002, 54, 631 CrossRef CAS
.
- D. Horn and J. Rieger, Angew. Chem., Int. Ed., 2001, 40, 4330 CrossRef CAS
- M. Liong, J. Lu, M. Kovochich, T. Xia, S. G. Ruehm, A. E. Nel, F. Tamanoi and J. I. Zink, ACS Nano, 2008, 2, 889 CrossRef CAS
- P. Sharma, S. Brown, G. Walter, S. Santra and B. Moudgil, Adv. Colloid Interface Sci., 2006, 123–126, 471 CrossRef CAS
- J. Lu, M. Liong, J. I. Zink and F. Tamanoi, Small, 2007, 3, 1341 CrossRef CAS
- X. H. Gao, Y. Y. Cui, R. M. Levenson, L. W. K. Chung and S. M. Nie, Nat. Biotechnol., 2004, 22, 969 CrossRef CAS
- S. Keereweer, J. D. Kerrebijn, P. B. van Driel, B. Xie, E. L. Kaijzel, T. J. Snoeks, I. Que, M. Hutteman, J. R. van der Vorst, J. S. Mieog, A. L. Vahrmeijer, C. J. van de Velde, R. J. Baatenburg de Jong and C. W. Lowik, Mol. Imaging Biol., 2011, 13, 199 CrossRef
- K. Licha and C. Olbrich, Adv. Drug Delivery Rev., 2005, 57, 1087 CrossRef CAS
- J. Rao, A. Dragulescu-Andrasi and H. Yao, Curr. Opin. Biotechnol., 2007, 18, 17 CrossRef CAS
- I. L. Medintz, H. T. Uyeda, E. R. Goldman and H. Mattoussi, Nat. Mater., 2005, 4, 435 CrossRef CAS
- R. Gill, M. Zayats and I. Willner, Angew. Chem., Int. Ed., 2008, 47, 7602 CrossRef CAS
- S. Santra, K. Wang, R. Tapec and W. Tan, J. Biomed. Opt., 2001, 6, 160 CrossRef CAS
- E. B. Cho, D. O. Volkov and I. Sokolov, Small, 2010, 6, 2314 CrossRef CAS
- S. Bonacchi, D. Genovese, R. Juris, M. Montalti, L. Prodi, E. Rampazzo and N. Zaccheroni, Angew. Chem., Int. Ed., 2011, 50, 4056 CrossRef CAS
- R. Hardman, Environ. Health Perspect., 2006, 114, 165 CrossRef
- J. L. Pelley, A. S. Daar and M. A. Saner, Toxicol. Sci., 2009, 112, 276 CrossRef CAS
- V. P. Torchilin, Nat. Rev. Drug Discovery, 2005, 4, 145 CrossRef CAS
- K. T. Plajnsek, S. Pajk, B. Govedarica, S. Pecar, S. Srcic and J. Kristl, Int. J. Pharm., 2011, 416, 384 CrossRef CAS
- M. M. Fryd and T. G. Mason, Annu. Rev. Phys. Chem., 2012, 63, 493 CrossRef CAS
- N. Anton, J. P. Benoit and P. Saulnier, J. Controlled Release, 2008, 128, 185 CrossRef CAS
- N. Anton and T. F. Vandamme, Pharm. Res., 2011, 28, 978 CrossRef CAS
- D. J. McClements, Soft Matter, 2012, 8, 1719 RSC
- I. Texier, M. Goutayer, A. Da Silva, L. Guyon, N. Djaker, V. Josserand, E. Neumann, J. Bibette and F. Vinet, J. Biomed. Opt., 2009, 14, 054005 CrossRef
- B. Heurtault, P. Saulnier, B. Pech, J. E. Proust and J. P. Benoit, Pharm. Res., 2002, 19, 875 CrossRef CAS
- P. P. Constantinides, M. V. Chaubal and R. Shorr, Adv. Drug Delivery Rev., 2008, 60, 757 CrossRef CAS
- S. A. Wissing, O. Kayser and R. H. Muller, Adv. Drug Delivery Rev., 2004, 56, 1257 CrossRef CAS
- Z. Zhang, J. Chen, L. Ding, H. Jin, J. F. Lovell, I. R. Corbin, W. Cao, P. C. Lo, M. Yang, M. S. Tsao, Q. Luo and G. Zheng, Small, 2010, 6, 430 CrossRef CAS
- R. V. Tikekara and N. Nitin, Soft Matter, 2011, 7, 8149 RSC
- A. Wagh, S. Y. Qian and B. Law, Bioconjugate Chem., 2012, 23, 981 CrossRef CAS
- B. Law, A. Curino, T. H. Bugge, R. Weissleder and C. H. Tung, Chem. Biol., 2004, 11, 99 CAS
- H. Patel, C. Tscheka and H. Heerklotz, Soft Matter, 2009, 5, 2849 RSC
- A. S. Al Dwayyan, S. M. H. Qaid, M. A. Majeed Khan and M. S. Al Salhi, Opt. Mater., 2012, 34, 761 CrossRef CAS
- R. Tapec, X. J. Zhao and W. Tan, J. Nanosci. Nanotechnol., 2002, 2, 405 CrossRef CAS
- D. J. McClements and Y. Li, Adv. Colloid Interface Sci., 2010, 159, 213 CrossRef CAS
- A. K. Li, Y. McClements and D. J. H. Xiao, Food Chem., 2012, 132, 799 CrossRef
- M. Goutayer, S. Dufort, V. Josserand, A. Royere, E. Heinrich, F. Vinet, J. Bibette, J. L. Coll and I. Texier, Eur. J. Pharm. Biopharm., 2010, 75, 137 CrossRef CAS
- O. A. Kucherak, L. Richert, Y. Mély and A. S. Klymchenko, Phys. Chem. Chem. Phys., 2012, 14, 2292 RSC
- P. Greenspan, E. P. Mayer and S. D. Fowler, J. Cell Biol., 1985, 100, 965 CrossRef CAS
- G. Diaz, M. Melis, B. Batetta, F. Angius and A. M. Falchi, Micron, 2008, 39, 819 CrossRef CAS
- T. Ozturk, A. S. Klymchenko, A. Capan, S. Oncul, S. Cikrikci, S. Taskiran, B. Tasan, F. B. Kaynak, S. Ozbey and A. P. Demchenko, Tetrahedron, 2007, 63, 10290 CrossRef CAS
- O. A. Kucherak, S. Oncul, Z. Darwich, D. A. Yushchenko, Y. Arntz, P. Didier, Y. Mely and A. S. Klymchenko, J. Am. Chem. Soc., 2010, 132, 4907 CrossRef CAS
- S. M. Ormson, R. G. Brown, F. Vollmer and W. Rettig, J. Photochem. Photobiol., A, 1994, 81, 65 CrossRef CAS
- M. L. Deda, M. Ghedini, I. Aiello, T. Pugliese, F. Barigelletti and G. Accorsi, J. Organomet. Chem., 2005, 690, 857 CrossRef CAS
- J. P. Clamme, J. Azoulay and Y. Mely, Biophys. J., 2003, 84, 1960 CrossRef CAS
-
N. L. Thompson, in Topics in Fluorescence Spectroscopy Techniques, ed. J. R. Lakowicz, Plenum Press, New York, 1991, vol. 1, p. 337 Search PubMed
- P. Didier, J. Godet and Y. Mely, J. Fluoresc., 2009, 19, 561 CrossRef CAS
- N. D. Lawson and B. M. Weinstein, Dev. Biol., 2002, 248, 307 CrossRef CAS
- N. Anton and T. F. Vandamme, Int. J. Pharm., 2009, 377, 142 CrossRef CAS
- N. T. Huynh, C. Passirani, P. Saulnier and J. P. Benoit, Int. J. Pharm., 2009, 379, 201 CrossRef CAS
- T. F. Vandamme and N. Anton, Int. J. Nanomed., 2010, 5, 867 CrossRef CAS
- J. Gravier, F. P. Navarro, T. Delmas, F. Mittler, A. C. Couffin, F. Vinet and I. Texier, J. Biomed. Opt., 2011, 16, 096013 CrossRef
- A. Sulkowska, J. Mol. Struct., 2002, 614, 227 CrossRef CAS
- F. Kratz and U. Beyer, Drug Delivery, 1998, 5, 281 CrossRef CAS
- S. Li, W. C. Tseng, D. Beer Stolz, S. P. Wu, S. C. Watkins and L. Huang, Gene Ther., 1999, 6, 585 CrossRef CAS
- C. Dufour and O. Dangles, Biochim. Biophys. Acta, Gen. Subj., 2005, 1721, 164 CrossRef CAS
- S. Mishra, P. Webster and M. E. Davis, Eur. J. Cell Biol., 2004, 83, 97 CrossRef CAS
- J. Xie, C. Xu, N. Kohler, Y. Hou and S. Sun, Adv. Mater., 2007, 19, 3163 CrossRef CAS
- B. M. Weinstein, D. L Stemple, W. Driever and M. C. Fishman, Nat. Med., 1995, 1, 1143 CrossRef CAS
- S. Rieger, R. P. Kulkarni, D. Darcy, S. E. Fraser and R. W. Köster, Dev. Dyn., 2005, 234, 670 CrossRef CAS
- E. Ellertsdóttir, A. Lenard, Y. Blum, A. Krudewig, L. Herwig, M. Affolter and H. G. Belting, Dev. Biol., 2010, 341, 56 CrossRef
- F. Lacoeuille, F. Hindre, F. Moal, J. Roux, C. Passirani, O. Couturier, P. P. Cales, J. J. Le Jeune, A. Lamprecht and J. P. Benoit, Int. J. Pharm., 2007, 344, 143 CrossRef CAS
Footnotes |
| † Electronic Supplementary Information (ESI) available. See DOI: 10.1039/c2ra21544f |
| ‡ Equal contribution to the work. |
| § Last co-authors |
| This journal is © The Royal Society of Chemistry 2012 |