Microemulsion-mediated hydrothermal synthesis of ZnSe and Fe-doped ZnSe quantum dots with different luminescence characteristics
Lin
Yang
,
Jianguo
Zhu
* and
Dingquan
Xiao
College of Materials Science and Engineering, Sichuan University, Chengdu, 610064, People's Republic of China. E-mail: nic0400@scu.edu.cn; Tel: +86 28 85412415; Fax: +86 28 85416050
First published on 20th July 2012
Abstract
A microemulsion-mediated hydrothermal method has been demonstrated for synthesizing ZnSe and Fe-doped ZnSe quantum dots (QDs). The properties of ZnSe QDs can be controlled by using the surfactants of polyoxyethylene lauryl ether and Triton X-100. The resulting QDs were found to be in a zinc blende crystal structure, with optimal spherical shape, nearly monodispersed and controlled in their Fe/Zn ratio. In terms of the optical spectra, polyoxyethylene lauryl ether attenuates nucleation and growth, yielding smaller ZnSe QDs with a dominant surface-defect luminescence. Conversely, Triton X-100 produces larger ZnSe QDs with a high crystallinity and a lower density of surface defects, resulting in the enhanced band-edge luminescence. A growth mechanism involving the possible formation of nanoparticles based on the effect of surfactant in microemulsions has also been explored in this paper. Using an appropriate surfactant favors the modulation of the strength of the water-in-oil interface and the exchange dynamics of micelles. Highly fluorescent Fe-doped ZnSe QDs were also synthesized. With an increase of Fe2+ concentration, the band-edge emission peak is systematically blue-shifted. This behavior is indicative of a reduction of the reaction rate.
1. Introduction
Semiconductor nanocrystals, or quantum dots (QDs), with their radius below the Bohr exciton radius of their bulk have been widely explored for their unique fundamental properties and potential applications. Usually, they have important optical, electrical and magnetic properties, which may improve or expand the applications of their bulk-sized materials.1–11 The properties and applications of those materials are strongly dependent on their size and size distribution. Therefore, recently much interest has been aroused in the preparation of monodispersed semiconductor nanocrystals and the assessment of the foundation of physicochemical laws at the nanoscale and their practical applications.12–17 At present, zinc selenide (ZnSe), as one of the important Zn-based II–VI semiconductors, has been widely and deeply investigated to develop UV emission materials, and examined as a leading candidate for fabrication of blue light-emitting diodes (LEDs) and laser diodes.18–21 Moreover, ZnSe is also a promising material for windows, lenses, output couplers, beam expanders and optically controlled switching, due to its low absorptivity at infrared wavelength, its visible transmission and high photosensitivity.22–24It is well-known that the photoluminescence (PL) efficiency is very sensitive to the nature of the nanoparticle surface, due to the large surface area and the possible presence of surface states arising from surface nonstoichiometry, unsaturated bonds and uncoordinated atoms, etc. Such surface states act as a quencher of luminescence, thus the control of surface properties in particular is the key to producing highly luminescent ultrafine crystals.
In this work, ZnSe QDs were synthesized using a reverse microemulsion with hydrothermal treatment at 120 °C. As this combines microemulsion with hydrothermal treatment, the crystallinity of nanocrystals could be improved greatly compared with other routes. We characterized structural and optical properties of QDs prepared using X-ray diffraction (XRD), transmission electron microscopy (TEM), UV–vis absorption and photoluminescence (PL) techniques. Two surfactants, polyoxyethylene lauryl ether and Triton X-100, were selected to systematically evaluate the effect of ligand chemistry on the growth and optical properties of ZnSe QDs. The use of appropriate surfactant in the preparation of a microemulsion can reduce the number of dangling bonds on the nanoparticle surface, which are believed to weaken the surface-related nonradiative recombination and enhance the band-edge luminescence efficiency. To further decrease the contribution of surface-related nonradiative recombination, a choice of surfactant type in the synthesis of ZnSe nanocrystals has been introduced in this paper.
Because of the large band-gap energy of ZnSe QDs (2.7 eV), transition-metals or impurities are usually introduced into nanocrystals to modulate their PL emission. These highly emissive doped semiconductor nanocrystals are not only as efficient as standard QDs, but also possess some unique properties, including high temperature stability, zero-reabsorption, long fluorescence lifetimes and reduced chemical sensitivity. Consequently, as compared to pure host ZnSe nanocrystals, these emissive materials of special properties make them ideal for solid-state lighting, light-emitting diodes, lasers and any other applications that may require a high concentration of emitters.25,26 Thus, doping could play a critical role in the luminescence phenomenon of semiconductor nanocrystals.
Although considerable work has been reported in the area of doped QDs, most of the efforts have concentrated on Mn-doped and Cu-doped ZnSe QDs.27–35 Nevertheless, very rare reports of the synthesis of Fe-doped ZnSe (ZnSe:Fe2+) QDs could be found generally. II–VI semiconductors doped with Fe have been the subject of much interest as promising candidates for broadly tunable mid-infrared laser media. The Fe ion can exhibit broad absorption and emission bands with large oscillator strength in the mid-infrared region. Thus, ZnSe:Fe2+ nanocrystal is an attractive material for compact tunable mid-IR lasers operating at room temperature for applications in medicine, environmental control and spectroscopic investigation.
Because the surface-to-volume ratio of nanoparticles is very high, surface defects play a particularly dominant role in the optical properties of nanocrystals. As a result, doped QDs exhibit the surface-defect luminescence, in addition to the impurity-related luminescence band. For instance, Mahamuni36 found that ZnSe:Mn2+ QDs synthesized by a high-temperature organometallic route show not only Mn2+-related orange luminescence, but also a luminescence around 500 nm due to selenium vacancies. Also, Emin and co-workers37 experimentally investigated the fluorescence resonance energy transfer in Mn-doped ZnSe QDs. It was found that the trap-state emission comes from the defect states on the nanoparticle surface, which prevail at short times of growth but disappear at long times. In the present study, we investigate the optical behavior of high-quality ZnSe:Fe2+ QDs, which show only band-edge luminescence and do not show any defect or trap luminescence for low doping levels.
2. Experimental
a. Materials
Zinc acetate dehydrate (Zn(AC)2·H2O, AR, 99.0%), iron (II) sulfate heptahydrate (FeSO4·7H2O, AR, 99.0%), sodium borohydride (NaBH4, AR, 97.0%), selenium powder (Se, 3N, 99.9%) were of analytical grade and used without further purification. Cyclohexane (C6H12, AR, 99.5%), polyoxyethylene lauryl ether (C12H25(OCH2CH2)23OH, CP), Triton X-100 (C8H17C6H4(OCH2CH2)10OH, CP) and 2-propanol ((CH3)2CHOH, AR, 99.7%) were used as purchased from Chengdu Chemical Co. Ultrapure, deionized water was used for the preparation of all aqueous solutions.b. Synthesis of undoped and Fe-doped ZnSe nanocrystals
Nano-sized ZnSe particles were synthesized using a microemulsion-mediated hydrothermal route, similar to the previous report.38 Firstly, we prepared NaHSe aqueous solution (0.5 M, 10 mL) by mixing NaBH4 and Se powder in deionized water with vigorous stirring under a nitrogen atmosphere. Meanwhile, 10 mL of 0.5 M zinc acetate aqueous solution was synthesized by dissolving Zn(AC)2·H2O in deionized water. Then, two types of reverse microemulsion (MA and MB) with different aqueous phases were prepared. Both MA and MB contained three common components, i.e., a surfactant of polyoxyethylene lauryl ether or Triton X-100, co-surfactant of 2-propanol and a continuous oil phase of cyclohexane in the volume ratio of 3![[thin space (1/6-em)]](https://www.rsc.org/images/entities/char_2009.gif) :6:20. The only difference was that MA consisted of Zn(AC)2 aqueous solution, whereas MB contained NaHSe aqueous solution. They were mixed together with continuous stirring at room temperature for 30 min. The resultant mixed microemulsion solution was then sealed into a Teflon-lined autoclave of 100 mL capacity with hydrothermal treatment at 120 °C for 15 h, without stirring, to make the nanoparticles well-crystallized, followed by cooling to room temperature naturally. The yellow precipitates were separated from the reaction media by centrifugation, washed with deionized water and anhydrous ethanol several times and then dried at 50 °C under a vacuum. Finally, ZnSe nanoparticles were obtained.
:6:20. The only difference was that MA consisted of Zn(AC)2 aqueous solution, whereas MB contained NaHSe aqueous solution. They were mixed together with continuous stirring at room temperature for 30 min. The resultant mixed microemulsion solution was then sealed into a Teflon-lined autoclave of 100 mL capacity with hydrothermal treatment at 120 °C for 15 h, without stirring, to make the nanoparticles well-crystallized, followed by cooling to room temperature naturally. The yellow precipitates were separated from the reaction media by centrifugation, washed with deionized water and anhydrous ethanol several times and then dried at 50 °C under a vacuum. Finally, ZnSe nanoparticles were obtained.
The procedure for synthesizing ZnSe:Fe2+ nanocrystals was used with the following changes. A precursor mixture of zinc acetate (Zn(AC)2·H2O) and iron sulfate (FeSO4·7H2O) as dissolved in deionized water under continuous stirring to form a clear yellow solution. In this aqueous solution, the concentration of Fe2+ in ZnSe host was adjusted by varying the FeSO4 amount in the organometallic precursor in the value range of 0.25–5@%. A quaternary microemulsion, water/Triton X-100/2-propanol/cyclohexane was selected for this study.
c. Characterization
The phase formation process was investigated by X-ray diffraction (XRD, D/max-rA model, using nickel-filtered Cu-Kα radiation). The compositional analysis for the as-prepared sample was performed with an energy-dispersive X-ray spectroscopy (EDX) system, an accessory of SEM (JSM-5900LV). UV–vis adsorption spectra were recorded on a Shimadzu 2100 UV–visible spectrophotometer. Fluorescence spectra were performed with an F-7000 FL spectrophotometer. Excitation wavelengths were set at 300–360 nm. All of the optical measurements were performed under ambient conditions. The samples were diluted with deionized water and placed directly in quartz cuvettes (1 cm path length) for characterization, without any size sorting. The photoluminescence quantum yields (PLQYs) of QDs were estimated using quinine sulfate in aqueous 0.05 M H2SO4 as the PL reference. The phase separation point (i.e., the cloud point) of microemulsions was titrated with toluene. The morphology and dispersion state of ZnSe nanocrystals were examined using a transmission electronic microscope (TEM, JEM-2010). Samples for TEM characterization were prepared by dispersing powders on a carbon-coated copper grid. The selected area electron diffraction pattern (SAED) was taken with a camera length of 200 cm. X-ray photoelectron spectroscopy (XPS) was carried out using a Kratos XSAM-800 X-ray photoelectron spectrometer using Mg-Kα radiation (1253.6 eV). Quantitative elemental analysis for the amount of Fe in doped ZnSe QDs was performed using atomic absorption spectroscopy (AAS). Fourier transform infrared (FT-IR) spectra were measured using a Perkin-Elmer Spectrum one FT-IR spectrometer.3. Results and discussion
Temporal evolution of XRD patterns was performed to understand the formation of ZnSe QDs at different reaction times, as shown in Fig. 1a. The positions of all diffraction peaks in the pattern match well with the standard powder diffraction data (Joint Committee for Powder Diffraction Studies (JCPDS) No. 80-0021). The diffraction peaks at 27.0°, 45.5°, and 53.5° of ZnSe QDs could be indexed to the (111), (220), and (311) planes of cubic zinc blende structure with the lattice constant of a = 5.67 Å. The absence of impurities indicates the high purity of the samples. Increasing the reaction time from 0.5 to 15 h shows an increase of diffraction peak intensity and a decrease of diffraction peak full-width at half-maximum (FWHM) due to the improved crystallinity and grain growth. The crystal size estimated by using Scherrer's formula37 gradually increases with the increase of reaction time, as shown in the inset of Fig. 1a. In the initial 6 h of the reaction, the average particle size of ZnSe QDs increases rapidly from 3.2 to 5.6 nm. It increases quickly during the following 4 h of the reaction and then slowly from 5.8 to 7.3 nm, meaning the growth of ZnSe QDs is fast during the first six hours of the reaction and then slows down afterward. In order to further confirm the composition of the sample, EDX analysis was recorded for ZnSe QDs, as shown in Fig. 1b. The EDX pattern clearly indicates the presence of zinc and selenium, which reveals that the sample is composed of Zn and Se elements. The molar ratio of Zn:Se was calculated to be 1.05:1.
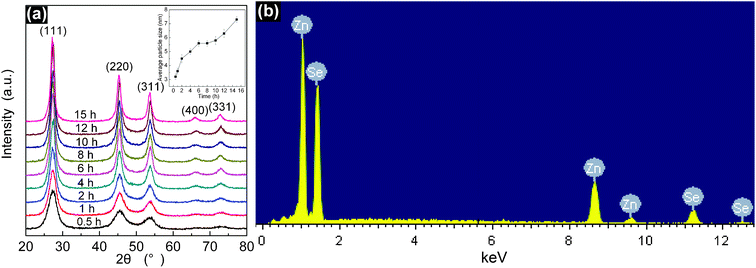 | ||
| Fig. 1 (a) XRD patterns of ZnSe QDs synthesized with hydrothermal treatment at 120 °C for different times; (b) An EDX spectrum of the resulting ZnSe QD. The inset in (a) is the variation in average particle size with the reaction time. | ||
In Fig. 2, ZnSe QDs synthesized in different conditions were monitored by UV–vis absorption spectroscopy. When the polyoxyethylene lauryl ether was used as surfactant, a small ZnSe QD is formed after 1 h with a distinct absorption peak at 376 nm, that is continuously red-shifted to 386 nm after 4 h and 390 nm after 8 h (Fig. 2a). The absorption peak attenuates sharply for longer reaction times, becoming a shoulder at approximately 410 nm. When the surfactant was Triton X-100 (Fig. 2b), a similar result is obtained, where a distinct absorption peak is shifted to longer wavelengths and attenuates with increasing reaction time. At later stages, the absorption peaks are no longer distinct and disappear entirely, showing the formation of a larger ZnSe QD. After 1 h, absorption peaks are observed at 376 and 384 nm for polyoxyethylene lauryl ether and Triton X-100 surfactants, respectively. In brief, under identical synthetic conditions, the smaller ZnSe QD was formed by using polyoxyethylene lauryl ether, while the larger one was obtained with Triton X-100.
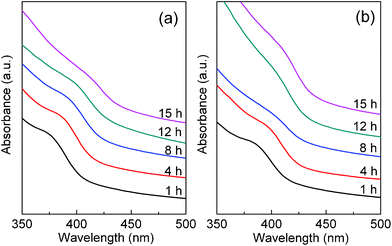 | ||
| Fig. 2 The temporal evolution of UV–vis absorption spectra of ZnSe QDs synthesized with (a) polyoxyethylene lauryl ether and (b) Triton X-100. | ||
The PL spectra of ZnSe QDs synthesized in different conditions are shown in Fig. 3. It is observed that there are two emissions in the semiconductor nanocrystals—band-edge and surface-defect luminescence. Usually, the band-edge emission is sharp and is located near the absorption edge of the nanocrystal, while the surface-defect emission is broad and Stokes-shifted.39 The result indicates that for ZnSe QD synthesized with polyoxyethylene lauryl ether at a reaction time of 1 h, the peak at 385 nm is due to near band-gap emission, whereas the peak at 443 nm is related to surface-defect emission. When the excitation wavelength is varied in discrete steps in the range of 330–360 nm, as shown in Fig. 3a, the band-gap emission peak at 385 nm remains fixed for different excitation wavelengths, manifesting an intrinsic property of ZnSe QDs, whereas the surface-defect-induced emission peak is slightly blue-shifted (from 456 to 443 nm), which is due to a weak dependence of sub-band transitions on excitation energy. Similar results are obtained for ZnSe QDs synthesized at reaction times of 8 and 15 h, as shown in Fig. 3b and c, respectively. Here, the spectra are dominated by near band-gap emission, and surface-defect emission and is not as distinct as at shorter reaction times. In contrast to polyoxyethylene lauryl ether, the spectra are dominated by band-edge emission for the linear, but shorter surfactant of Triton X-100 (Fig. 3d–f). With increasing the reaction time, the surface-defect emission attenuates strongly.
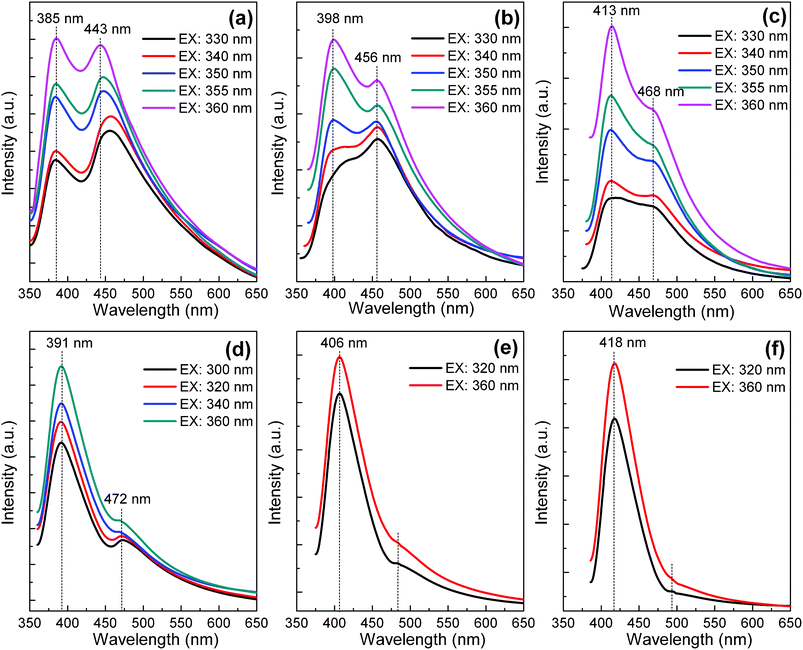 | ||
| Fig. 3 PL spectra of ZnSe QDs synthesized with polyoxyethylene lauryl ether at different reaction times: (a) 1 h, (b) 8 h, and (c) 15 h. PL spectra of ZnSe QDs synthesized with Triton X-100 at different reaction times: (d) 1 h, (e) 8 h and (f) 15 h. | ||
In the present study, the observation of blue shifts in both excitonic absorption and band-edge emission peaks with the decrease of nanocrystal size gives clear evidence for the quantum confinement effect. Semiconductor nanocrystals with a particle radius significantly smaller than the Bohr exciton radius shows strong size-dependent optical properties due to the quantum confinement effect. In this regime there is a progressive increase in band-gap energy with decreasing particle size. The effective mass theory can accurately predict the size-dependent band-gap energy, given by the Brus equation as follows:40,41
 | (1) |
By considering the bulk band gap (2.67 eV), effective masses (m*e = 0.157 me and m*h = 0.64 me), and dielectric constant (ε = 8.7), as well as substituting the nanoparticle diameter d for radius r, this equation is simplified as
 | (2) |
The measured values of band-gap energy (Eg) of ZnSe QDs can be estimated from the UV–vis absorption spectra by using Tauc's relation: (αhv)1/n = c(hv − Eg), where α is the absorption coefficient, hv is the photon energy, c is a constant, Eg is the band-gap energy of nanocrystals, and n depends on type of transition (n = 1/2 for direct band-gap and n = 2 for indirect band-gap). In Fig. 4, the solid circle points are experimentally measured values from the typical absorption spectra (Fig. 2b), which show remarkable agreement with the calculated curve based on eqn (2).
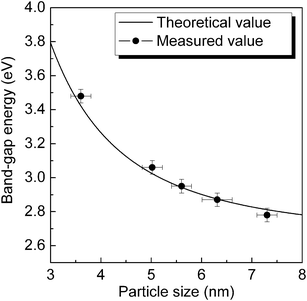 | ||
| Fig. 4 The variation of band-gap energy as a function of particle size of ZnSe QDs. The measured values are shown as solid circles with the error bars on the x and y axes reflecting the mean deviation of particle size and band-gap energy, respectively. | ||
The phase separation point of microemulsions prepared with different surfactants was titrated with toluene, a good solvent for the polyoxyethylene head group of surfactants.42 Toluene was increasingly added to the single-phase reverse microemulsions initially containing fixed amounts of cyclohexane oil, aqueous solution, surfactant and co-surfactant, until phase separation occurred. The amount of toluene in the resultant solution corresponds to the minimum polarity of oil needed to dissociate surfactant molecules away from water droplets to cause the destabilization of reverse micelles. Consequently, the volume ratio of toluene to cyclohexane stands for a qualitative scale for the strength of surfactant to associate with water droplets. The higher the volume ratio of toluene to cyclohexane at the phase separation point is, the stronger the attachment of surfactant film to water droplets will be.
The microemulsions of polyoxyethylene lauryl ether and Triton X-100 become phase-separated when the volume ratios of toluene to cyclohexane exceed 45% and 28%, respectively. This phase separation occurs as the oil continuum becomes sufficiently polar with increasing toluene fraction to cause surfactant molecules to dissociate from the surface of droplets. Because destabilizing the stronger surfactant attachment to droplets needs the higher toluene fraction, it implies that the strength of polyoxyethylene lauryl ether surfactant is larger than that of Triton X-100 surfactant.
The variation of ZnSe nanocrystal size as a function of surfactant is schematically illustrated in Fig. 5 and can be explained as follows. For a surfactant film with a higher strength (i.e., a stronger attachment to droplets or a lower deformability), open water channels are less likely to occur for reacting species to pass through. With fewer droplet dynamic exchanges, reacting species tend to retain and grow in their respective droplets, leading to the formation of more nuclei and smaller nanocrystals (for a given amount of reactants). On the contrary, a lower strength of surfactant film indicates that reacting species become less sterically protected by surfactant film and, hence, can exchange more easily between the water droplets, condensing into larger nanocrystals. In summary, both the stronger surfactant attachment to droplets and the lower surfactant film deformability impart a higher steric hindrance to the droplet exchange of reacting species and, hence, lead to the smaller nanocrystals, which usually have a larger surface area to volume ratio and a higher surface defects density.
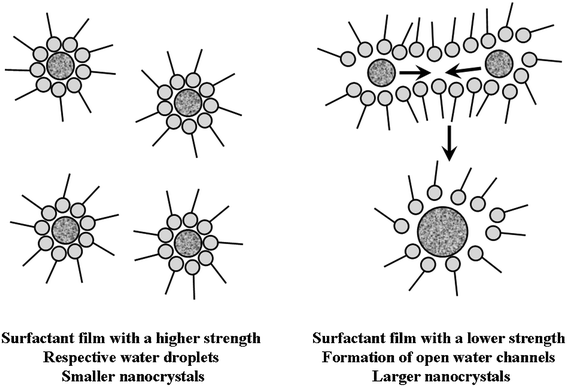 | ||
| Fig. 5 A schematic illustration of the effect of surfactant on the formation of ZnSe nanoparticles in water-in-oil microemulsions. | ||
The phenomenon observed in our study could be explained by the fact that both hydrophilic and hydrophobic groups of polyoxyethylene lauryl ether surfactant are longer than those of Triton X-100 surfactant. Polyoxyethylene lauryl ether with 23 oxyethylene groups attaches more strongly to a water droplet than Triton X-100 with 10 oxyethylene groups. Moreover, the longer hydrocarbon tail of polyoxyethylene lauryl ether also makes the surfactant film less deformable than the shorter tail of Triton X-100. The analysis result is consistent with the titration of the phase separation point of microemulsions. So ZnSe QD synthesized with polyoxyethylene lauryl ether is much smaller.
The PL spectra of ZnSe QD synthesized with Triton X-100 surfactant, which has one more benzenoid group than polyoxyethylene lauryl ether, have occurred with weaker surface-defect luminescence, indicating that the surfactant with a shorter main chain and/or more different types of functional groups contributes fewer structural flaws to the surface. This can be derived from the fact that these groups of surfactant molecules in a microemulsion would attach more tightly to the surface of particles and provide a chemical surface passivation.32,43 This could promote the formation of a perfect crystalline structure, along with a lower surface defect density, resulting in reducing the nonradiative recombination related to the surface states and enhancing the band-edge luminescence efficiency. So controlling the type of surfactant can passivate the surface defects of ZnSe QDs.
Increasing the nanocrystal size during the growth process (Fig. 1a) implies a decrease of surface area to volume ratio in the nanocrystal and, hence, the density of surface-related defects. Eventually, the band-edge luminescence enhances with the increasing quantity of ZnSe QDs. Meanwhile, the emission resulting from the surface defect sites is restrained. After the nanocrystal reaches its final size, the crystalline structure continues to be perfected, which favors the enhanced band-edge luminescence of ZnSe QDs. Conversely, when the nanocrystal size decreases, surface trap states increase rapidly, thus enhancing the surface-defect luminescence efficiency. It is worth noting that the surface-defect emission is shifted to the longer wavelength as the nanocrystal size increases with the increase of reaction time (as shown in Fig. 3), demonstrating that the emission energy of surface states is also correlated to the quantum confinement effect. Because the physical property of surface states is not sensitive to the particle size, eventually the trap depth does not change as much upon altering the particle size. While the band gap decreases as the nanocrystal size increases, the separation between the electron–hole pairs also decreases.39 Hence, the surface-defect luminescence is red-shifted with increasing nanocrystal size.
ZnSe is a wide direct band-gap semiconductor material, allowing the band-gap to be introduced to other metal ions. In this study, it has been demonstrated by using ZnSe QDs as the host matrix to dope with Fe2+ ions. In Fig. 6, ZnSe:Fe2+ QDs synthesized with Triton X-100 at different reaction times were monitored by PL spectra. It is observed that ZnSe:Fe2+ QDs at a reaction time of 10 h show a band-edge luminescence at around 414 nm. Moreover, the smaller QDs are highly susceptible to the generation of defects upon the incorporation of Fe2+. For the lower Fe2+ concentration of ≤1.5%, the surface-defect emission is more intense and broader. However, when the concentration of Fe2+ increases to 2%, the PL spectra are dominated by near band-edge emission and the surface-defect emission peak attenuates strongly. Further increasing Fe2+ concentration up to 5% leads to the decrease in the intensities of band-edge emission and surface-defect emission simultaneously. The highest PLQY is found to be 21%, as shown in the inset of Fig. 6a. It implies that the optimal concentration of Fe2+ in doped ZnSe QDs is 2% and with a further increase of Fe2+ doping concentration, the PL intensity appears to decrease due to a concentration quenching effect. Because at a higher concentration of Fe2+, the isolated Fe ion may locate on the surface or in interstitial positions of crystallites with octahedral symmetry, it would not be in favor of radiative transition and would dramatically quench the luminescence intensity. As a comparison, shown in Fig. 6b, an increase in the doping level (from 0 to 2%) obviously leads to a blue shift (from 418 to 397 nm) in the wavelength and an increase in the emission intensity of ZnSe:Fe2+ QDs at a reaction time of 15 h. This indicates that Fe atoms have been successfully introduced into the ZnSe matrix, because the introduction of impurity ions into the host lattice can significantly reduce the reaction rate,36,44 which is reflected by a decrease in the nanocrystal size along with a increase in the band-gap. Furthermore, as the nanocrystal size decreases, the wave functions of electron and hole are overlapped effectively, which may result in the increase of their recombination probability or rate.45,46 Thus, the as-prepared QDs show an increase of PLQY from 9% up to 33% with increasing Fe2+ doping concentration.
 | ||
| Fig. 6 PL spectra of ZnSe:Fe2+ QDs synthesized with Triton X-100 at reaction times of (a) 10 h and (b) 15 h. The insets are the corresponding PLQYs of ZnSe:Fe2+ QDs as a function of Fe concentration. | ||
Furthermore, from XRD patterns of ZnSe QDs doped with different Fe2+ concentrations at a reaction time of 15 h (Fig. 7a), we can see that all of the diffraction peaks could be indexed to the (111), (220) and (311) planes of the cubic zinc blende structure. Increasing the Fe2+ concentration from 0.3% to 3% shows a decrease of diffraction peak intensity and an increase of diffraction peak FWHM. As shown in Fig. 7b, the crystal size of ZnSe:Fe2+ QDs estimated by using Scherrer's formula gradually decreases with the increase of Fe2+ concentration. The crystal size of ZnSe:Fe 3% QD (6.6 nm) is smaller than that of undoped ZnSe QD (7.3 nm, as shown in Fig. 1a). This gives clear evidence that doping Fe ions could result in the decrease of crystal size.
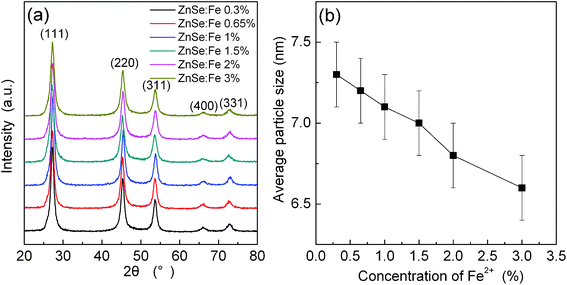 | ||
| Fig. 7 (a) XRD patterns of ZnSe:Fe2+ QDs synthesized with Triton X-100 at a reaction time of 15 h; (b) average particle sizes of ZnSe:Fe2+ QDs calculated from XRD patterns as a function of Fe2+ concentration. | ||
The morphology and nanostructure of ZnSe:Fe 2% QDs characterized by TEM are given in Fig. 8. The sample is dispersed in ethanol by ultrasonic treatment for 20 min, dipped onto a copper grid, and then characterized by TEM. Fig. 8a presents an overview TEM image of the sample. It can be seen that ZnSe:Fe 2% QD at a reaction time of 10 h is agglomerated hard. From the inset of Fig. 8a, we can see that its particle size distribution (PSD) is wide, so there is a great variation in particle size, ranging from 6.1 to 8.6 nm. The larger particles of ≥7.4 nm constitute a large percentage and possibly result from agglomeration behavior of small nanoparticles. As a comparison, ZnSe:Fe 2% QD at a reaction time of 15 h exhibits a better dispersity and relatively uniform spherical shape, and processes a relatively narrow PSD with the average diameter around 7 nm, as shown in Fig. 8b and its inset, respectively. It can be further noted that, as shown in Fig. 8c, the lattice spacing of ZnSe:Fe 2% QD is about 0.32 nm, corresponding to the (111) plane of a cubic zinc blende ZnSe structure, which is in agreement with the XRD result. The regular behavior of the lattice fringes inside the nanocrystal further confirms that most ZnSe nanoparticles have a good crystalline structure with no defects. Fig. 8d is the electron diffraction pattern which consists of five concentric sharp rings, corresponding to (111), (220), (311), (400) and (331) lattice plane of the cubic-phase ZnSe, as reported in the previous literature.24,28,30 Therefore, it can be further confirmed that the QDs process the cubic zinc blende structure, which matches well with that expected for ZnSe nanocrystal.
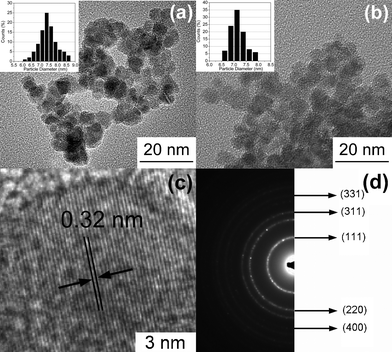 | ||
| Fig. 8 TEM images of ZnSe:Fe 2% QDs synthesized at reaction times of (a) 10 h and (b) 15 h; the representative (c) lattice planes and (d) SAED of the as-prepared ZnSe:Fe2+ QDs. The insets in (a) and (b) are the corresponding size distribution histograms. | ||
It is known that the surface of ZnSe nanocrystals is easily oxidized in the open air. XPS analyses were employed to investigate the surface composition of ZnSe:Fe 2% nanocrystals. Four elements, Zn, Se, Fe and O are observable. The narrow scans for Zn 2p and Se 3d are shown in Fig. 8a and b, respectively. In the narrow scans spectrum of Zn 2p, there are two peaks with binding energies at 1021.4 and 1044.4 eV due to Zn 2p3/2 and Zn 2p1/2, respectively. The single peak of Se 3d with binding energy of 54.0 eV corresponds to the binding state of Se2− in ZnSe QD. In the narrow scans spectrum of Fe 2p (Fig. 9c), the binding energies of 710.7 and 724.0 eV correspond to the peaks of Fe 2p3/2 and Fe 2p1/2, respectively. From the XPS results, the atomic ratio of Zn to Se is calculated to be about 45.96:50.12, which is close to 1:1.1. The superfluous Se may be caused by the oxidation of Se2− on the surface of ZnSe nanoparticles into amorphous Se in the air. Moreover, the O element possibly results from the contamination of the vacuum system.
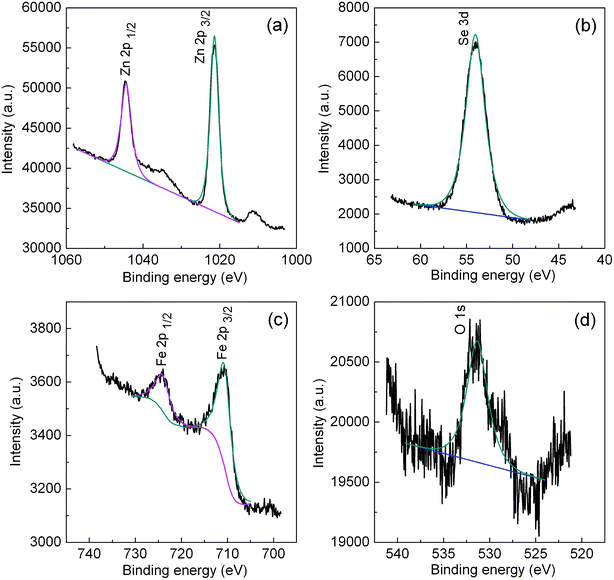 | ||
| Fig. 9 The XPS spectra of ZnSe:Fe 2% QD. | ||
To better evaluate EDX, AAS and XPS measurements, a comparison of atomic ratios of Fe to Zn in ZnSe:Fe2+ QDs measured using these three different technologies is illustrated in Fig. 10. It is worth noting here that the corresponding atomic ratios of Fe to Zn determined by EDX and AAS are more accordant with the expected values calculated from the amounts of injected precursors. The atomic ratio of Fe to Zn in ZnSe QD doped with higher Fe2+ concentrations (5%) determined by XPS is slightly higher than those of the other measurements. In the case of ZnSe:Fe 2%, the atomic ratio of Fe to Zn determined by XPS, however, is found to be nearly two times higher than that determined by AAS. Because XPS is mostly sensitive to the surface atoms, it shows that there is more Fe atom than the real amount of iron precursor. However, EDX and AAS measurements can provide the overall ratio of the two cations in the nanocrystals, thus the atomic ratios of Fe to Zn determined by either EDX or AAS could reflect the real value.
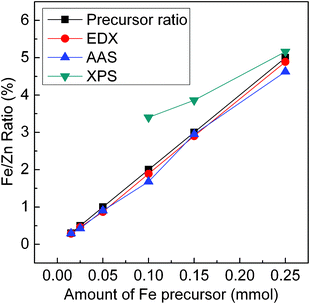 | ||
| Fig. 10 Atomic ratios of Fe to Zn in ZnSe:Fe2+ QDs measured using three different technologies. The detection limit of XPS measurement is 2%. | ||
To understand quantitatively the absorption of organic surfactant on the surface of ZnSe QDs, FT-IR measurements on pure Triton X-100 and as-prepared ZnSe:Fe 2% QDs synthesized with Triton X-100 were carried out as shown in Fig. 11. In the FT-IR spectrum of pure Triton X-100, the broad absorption peak at 3365 cm−1 corresponding to the stretching vibration of hydroxyl groups (O–H) is clearly observed. The sharp bands at 2951 and 2871 cm−1 are owing to the asymmetric and symmetric CH2 stretch, respectively. The intense band at 1610 and 1512 cm−1 due to the stretching vibration of the benzenoid group can be observed together with the asymmetric stretch at 1247 and 1110 cm−1 associated with the aromatic ether. As a comparison, in the FT-IR spectrum of the as-prepared ZnSe:Fe 2% QDs, a broad band at 3000–3700 cm−1 is assigned to the stretching vibration of O–H, which has probably resulted from absorbed water or hydrogen liberated from the carboxylate species binding to the surface of ZnSe nanoparticles, so as to form hydroxyl groups. In addition, the asymmetric and symmetric CH2 stretches are shown to be shifted to 2923 and 2848 cm−1, respectively. In the fingerprint region of 1637–1411 cm−1, the small and almost evenly spaced peaks can be identified as the stretching vibration of the benzenoid group. The band due to the asymmetric stretch of an aromatic ether appears at 1071 cm−1.32 It should be pointed out that the surfactant molecules in the adsorbed state are subject to the field of the solid surface. As a result, the characteristic bands are found to be shifted to a lower frequency region.47,48 The results of FT-IR measurements indicate that Triton X-100 surfactant could be attached on the surface of ZnSe nanoparticles and, thus, the surface of nanospheres is partially covered with the organic ligands acting as a capping agent.
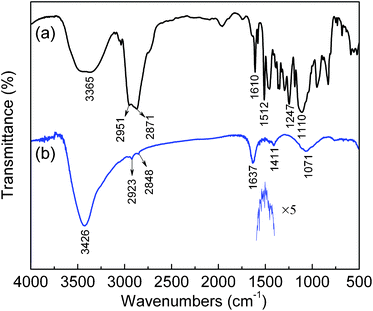 | ||
| Fig. 11 FT-IR spectra of (a) pure Triton X-100 and (b) the as-prepared ZnSe:Fe 2% QDs synthesized with Triton X-100. | ||
4. Conclusions
In the present work, ZnSe and Fe-doped ZnSe QDs were successfully synthesized by a microemulsion-mediated hydrothermal method. The formation of a cubic zinc blende structure has been checked by XRD and reconfirmed by electron diffraction. The optical properties of the as-synthesized QDs could be tuned through the use of polyoxyethylene lauryl ether and Triton X-100 surfactants. Use of polyoxyethylene lauryl ether could attenuate nucleation and growth, yielding small ZnSe QDs with a dominant surface-defect luminescence. Conversely, using Triton X-100 surfactant with a shorter main chain produces larger ZnSe QDs with a high crystallinity and lower density of surface defects, resulting in the enhanced band-edge luminescence because the surface passivation can reduce the nonradiative recombination related to the surface states and enhance the band-edge luminescence efficiency. So using the appropriate type of surfactant could successfully eliminate the surface states of ZnSe QDs and favor the modulation of the strength of the water-in-oil interface and the exchange dynamics of micelles. Moreover, the surface-defect luminescence intensity decreases as the nanocrystal size increases, with increasing the reaction time, indicating the decrease of surface states upon growth. The observation of blue shifts in both excitonic absorption and band-edge emission with the decrease of nanocrystal size gives clear evidence for the quantum confinement effect. A satisfactory fit is found between experimental and calculated data for the band-gap energy of ZnSe samples. Highly fluorescent Fe-doped ZnSe QDs were also synthesized. ZnSe:Fe2+ QDs are confirmed to have a quantum confinement effect in their PL spectra and exhibit near band-edge luminescence. With the increase of Fe2+ concentration, the band-edge emission peak is systematically blue-shifted. This behavior is indicative of a reduction of the reaction rate. In the present case, it is observed that the incorporation of Fe in ZnSe host lattice is responsible for it. ZnSe:Fe 2% QD synthesized with Triton X-100 at a reaction time of 15 h has a relatively uniform spherical shape with an average diameter of 7 nm and a good crystallinity. The proposed method offers the potential for directly synthesizing doped semiconductor nanocrystals with high luminescence efficiency by the proper modification of synthesis conditions.Acknowledgements
This research was supported by the NSFC (Grant No. 60890203) and NSFC (Grant No. 60771016).References
- M. A. Hines and P. Guyot-Sionnest, J. Phys. Chem., 1996, 100, 468–471 CrossRef CAS.
- B. P. Zhang, W. X. Wang, T. Yasuda, Y. Segawa, K. Edamatsu and T. Itoh, Appl. Phys. Lett., 1997, 71, 3370–3372 CrossRef CAS.
- V. I. Klimov, A. A. Mikhailovsky, S. Xu, A. Malko, J. A. Hollingsworth, C. A. Leatherdale, H.-J. Eisler and M. G. Bawendi, Science, 2000, 290, 314–317 CrossRef CAS.
- J. Q. Hu, Y. Bando, Z. W. Liu, T. Sekiguchi, D. Golberg and J. H. Zhan, J. Am. Chem. Soc., 2003, 125, 11306–11313 CrossRef CAS.
- A. Shavel, N. Gaponik and A. Eychmüller, J. Phys. Chem. B, 2004, 108, 5905–5908 CrossRef CAS.
- D. Battaglia, B. Blackman and X. G. Peng, J. Am. Chem. Soc., 2005, 127, 10889–10897 CrossRef CAS.
- A. B. Panda, G. Glaspell and M. S. El-Shall, J. Am. Chem. Soc., 2006, 128, 2790–2791 CrossRef CAS.
- K. Wang, J. J. Chen, W. L. Zhou, Y. Zhang, Y. F. Yan, J. Pern and A. Mascarenhas, Adv. Mater., 2008, 20, 3248–3253 CrossRef CAS.
- S. V. Pol, V. G. Pol, J. M. Calderon-Moreno, S. Cheylan and A. Gedanken, Langmuir, 2008, 24, 10462–10466 CrossRef CAS.
- D.-R. Jung, J. Kim and B. Park, Appl. Phys. Lett., 2010, 96, 211908 CrossRef.
- X. Chen, C. S. Lee, X. M. Meng and W. J. Zhang, Mater. Lett., 2011, 65, 2585–2588 CrossRef CAS.
- C. B. Murray, D. J. Norris and M. G. Bawendi, J. Am. Chem. Soc., 1993, 115, 8706–8715 CrossRef CAS.
- X. G. Peng, J. Wickham and A. P. Alivisatos, J. Am. Chem. Soc., 1998, 120, 5343–5344 CrossRef CAS.
- S. L. Cumberland, K. M. Hanif, A. Javier, G. A. Khitrov, G. F. Strouse, S. M. Woessner and C. S. Yun, Chem. Mater., 2002, 14, 1576–1584 CrossRef CAS.
- N. Myung, Y. Bae and A. J. Bard, Nano Lett., 2003, 3, 1053–1055 CrossRef CAS.
- X. H. Zhong, R. G. Xie, Y. Zhang, T. Basché and W. Knoll, Chem. Mater., 2005, 17, 4038–4042 CrossRef CAS.
- F. Dawood and R. E. Schaak, J. Am. Chem. Soc., 2009, 131, 424–425 CrossRef CAS.
- J. J. Zhu, Y. Koltypin and A. Gedanken, Chem. Mater., 2000, 12, 73–78 CrossRef CAS.
- P. D. Cozzoli, L. Manna, M. L. Curri, S. Kudera, C. Giannini, M. Striccoli and A. Agostiano, Chem. Mater., 2005, 17, 1296–1306 CrossRef CAS.
- Y. Cai, S. K. Chan, I. K. Sou, Y. F. Chan, D. S. Su and N. Wang, Adv. Mater., 2006, 18, 109–114 CrossRef CAS.
- D. D. Fanfair and B. A. Korgel, Chem. Mater., 2007, 19, 4943–4948 CrossRef CAS.
- B. Xiang, H. Z. Zhang, G. H. Li, F. H. Yang, F. H. Su, R. M. Wang, J. Xu, G. W. Lu, X. C. Sun, Q. Zhao and D. P. Yu, Appl. Phys. Lett., 2003, 82, 3330–3332 CrossRef CAS.
- S. L. Xiong, J. M. Shen, Q. Xie, Y. Q. Gao, Q. Tang and Y. T. Qian, Adv. Funct. Mater., 2005, 15, 1787–1792 CrossRef CAS.
- L. H. Zhang, H. Q. Yang, J. Yu, F. H. Shao, L. Li, F. H. Zhang and H. Zhao, J. Phys. Chem. C, 2009, 113, 5434–5443 CAS.
- N. Pradhan, D. Goorskey, J. Thessing and X. G. Peng, J. Am. Chem. Soc., 2005, 127, 17586–17587 CrossRef CAS.
- J. Jaeck, R. Haidar, F. Pardo, J. Pelouard and E. Rosencher, Appl. Phys. Lett., 2010, 96, 211107 CrossRef.
- N. Pradhan, D. M. Battaglia, Y. C. Liu and X. G. Peng, Nano Lett., 2007, 7, 312–317 CrossRef CAS.
- N. Pradhan and X. G. Peng, J. Am. Chem. Soc., 2007, 129, 3339–3347 CrossRef CAS.
- J. S. Han, H. Zhang, Y. Tang, Y. Liu, X. Yao and B. Yang, J. Phys. Chem. C, 2009, 113, 7503–7510 CAS.
- R. S. Zeng, M. Rutherford, R. G. Xie, B. S. Zou and X. G. Peng, Chem. Mater., 2010, 22, 2107–2113 CrossRef CAS.
- R. S. Zeng, T. T. Zhang, G. Z. Dai and B. S. Zou, J. Phys. Chem. C, 2011, 115, 3005–3010 CAS.
- L. M. Gan, B. Liu, C. H. Chew, S. J. Xu, S. J. Chua, G. L. Loy and G. Q. Xu, Langmuir, 1997, 13, 6427–6431 CrossRef CAS.
- L. J. Zu, D. J. Norris, T. A. Kennedy, S. C. Erwin and A. L. Efros, Nano Lett., 2006, 6, 334–340 CrossRef CAS.
- L. J. Zu, A. W. Wills, T. A. Kennedy, E. R. Glaser and D. J. Norris, J. Phys. Chem. C, 2010, 114, 21969–21975 CAS.
- D. G. Chen, R. Viswanatha, G. L. Ong, R. G. Xie, M. Balasubramaninan and X. G. Peng, J. Am. Chem. Soc., 2009, 131, 9333–9339 CrossRef CAS.
- S. Mahamuni, A. D. Lad and S. Patole, J. Phys. Chem. C, 2008, 112, 2271–2277 CAS.
- S. M. Emin, N. Sogoshi, S. Nakabayashi, T. Fujihara and C. D. Dushkin, J. Phys. Chem. C, 2009, 113, 3998–4007 CAS.
- L. Yang, L. Y. Liu, D. Q. Xiao and J. G. Zhu, Mater. Lett., 2012, 72, 113–115 CrossRef CAS.
- W. Chen, Z. G. Wang, Z. J. Lin and L. Y. Lin, Appl. Phys. Lett., 1997, 70, 1465–1467 CrossRef CAS.
- L. E. Brus, J. Chem. Phys., 1983, 79, 5566–5571 CrossRef CAS.
- D.-R. Jung, J. Kim and B. Park, Appl. Phys. Lett., 2010, 96, 211908 CrossRef.
- C. Chang and H. S. Fogler, Langmuir, 1997, 13, 3295–3307 CrossRef CAS.
- W. W. Yu, Y. A. Wang and X. G. Peng, Chem. Mater., 2003, 15, 4300–4308 CrossRef CAS.
- A. D. Lad, C. Rajesh, M. Khan, N. Ali, I. K. Gopalakrishnan, S. K. Kulshreshtha and S. Mahamuni, J. Appl. Phys., 2007, 101, 103906 CrossRef.
- T. Takagahara and K. Takeda, Phys. Rev. B: Condens. Matter, 1992, 46, 15578–15581 CrossRef CAS.
- L. Yang, R. S. Xie, L. Y. Liu, D. Q. Xiao and J. G. Zhu, J. Phys. Chem. C, 2011, 115, 19507–19512 CAS.
- N. Wu, L. Fu, M. Su, M. Aslam, K. C. Wong and V. P. Dravid, Nano Lett., 2004, 4, 383–386 CrossRef CAS.
- D.-J. Kim and K.-K. Koo, Cryst. Growth Des., 2009, 9, 1153–1157 CAS.
| This journal is © The Royal Society of Chemistry 2012 |