Linear and nonlinear optical properties of gold nanocrystal-incorporated mesoporous silica thin films
Jing-Yue
Fang
*a,
Shi-Qiao
Qin
a,
Xue-Ao
Zhang
a,
Yong-Ming
Nie
a and
Fei
Wang
ab
aSchool of science, National University of Defence Technology, Changsha, 410073, China. E-mail: fjy_nudt@yahoo.com.cn; Fax: 86 731 84573293; Tel: 86 731 84573295
bSchool of Physics and Electronics, Central South University, Changsha, 410073, China
First published on 9th October 2012
Abstract
Two kinds of mesoporous silica thin films (MSTFs), embedded with gold nanocrystals (GNCs), are synthesized using different surfactants. The MSTFs are composed of well-ordered mesostructures and the GNCs are well crystallized in the pores of the thin films. Optical absorption peaks, due to the surface plasmon resonance of the GNCs, are observed. Both classical and semi-classical methods are used to describe the dielectric function of the GNCs in the analysis, which showed that the particle size, particle shape, particle filling ratio and the matrix structure determine the absorption properties of the GNC/MSTF nanocomposite. Third-order optical nonlinearity of the nanocomposite was studied by the z-scan technique. The GNC/MSTF nanocomposites exhibited large optical nonlinearities.
Introduction
Nanocomposite thin films formed by nanoparticles embedded in dielectric or semiconductor matrices have been widely investigated in recent years, due to their specific electric and optical properties.1–9 The special optical absorption and large optical nonlinearities are of great practical importance for future optical device applications in optical signal processing and nonlinear optical devices.10–12 Sheng et al.2 and Tanahashi et al.8 reported the large third-order optical nonlinearity (χ(3) ∼2.5 × 10⁻⁶ esu and χ(3) ∼2.0 × 10⁻⁷ esu, respectively) of Au![[thin space (1/6-em)]](https://www.rsc.org/images/entities/char_2009.gif) :SiO2 composite films, which were deposited on quartz substrates by the multitarget magnetron sputtering method. For these studies, dependence of χ(3) on the Au concentration and size was found. Recently, Cui et al.13–15 reported the third-order optical nonlinearities of Au and Fe2O3 nanoparticles incorporated in mesoporous SiO2 and TiO2 thin films, which were prepared on glass slides by a series of processes, such as chemical modification, impregnation, co-assembly and heating at 300 °C in a hydrogen atmosphere. For these studies, they found that the third-order optical nonlinearity might be assigned to the size, dispersion and concentration of the embedded nanoparticles.
:SiO2 composite films, which were deposited on quartz substrates by the multitarget magnetron sputtering method. For these studies, dependence of χ(3) on the Au concentration and size was found. Recently, Cui et al.13–15 reported the third-order optical nonlinearities of Au and Fe2O3 nanoparticles incorporated in mesoporous SiO2 and TiO2 thin films, which were prepared on glass slides by a series of processes, such as chemical modification, impregnation, co-assembly and heating at 300 °C in a hydrogen atmosphere. For these studies, they found that the third-order optical nonlinearity might be assigned to the size, dispersion and concentration of the embedded nanoparticles.
To date, many papers have reported the synthesis of different metals and metal compounds (Au, Ag, Pt, Pd, CdS and TiN) with controlled sizes and morphologies using ordered mesoporous materials as templates.1,16–24 Well-ordered mesoporous silica thin films (MSTF), incorporating gold nanocrystals (GNCs), are one kind of nanocomposite film. In this paper, we study the optical properties of the GNC/MSTF nanocomposite.
The synthesis of the GNC/MSTF nanocomposite using amino-functionalized MSTF (AF-MSTF) as a template has been done according to the method reported in our previous reports.25,26 Due to the well-defined mesoporosity, the regular pore size and the periodical mesopore arrangement, the pore channels can be used as a micro-reactor for GNC incorporation. Since the gold precursor is confined within the isolated mesopores by the silicon framework, aggregation during GNC growth may be avoided. We adopted a so-called co-condensation preparation route, in which amino groups are formed on the inner mesopore surface during the preparation of the MSTFs. Comparatively, in a post-grafting process, the amino groups are grafted onto the wall of mesochannels after modification of the blank MSTFs.7,13 Hence, the concentration of the amino groups will be higher and the dispersion will be more uniform by use of the co-condensation route.
Herein, we present an experimental investigation of the GNC/MSTF nanocomposite linear and nonlinear optical properties. The ultraviolet–visible (UV–vis) absorption spectra show the surface plasmon resonance (SPR) effect of the embedded GNCs. The results were analyzed by a quantum mechanical model combined with effective dielectric theory. The nonlinear optical refractions and absorptions of the prepared nanocomposite were measured by a z-scan technique at 720 nm. The GNC/MSTF nanocomposites exhibited large optical nonlinearities. We found that the linear and nonlinear optical properties of GNC/MSTF composites can be modulated by using MSTFs with different mesostructures and adjusting the reaction time for assembling GNCs.
Experimental section
Preparation of GNC/MSTF nanocomposite
The synthesis of AF-MSTFs was carried out according to the template-assisted evaporation-induced self-assembly (EISA) procedure in the presence of surfactant templates (C16H33(OCH2CH2)10OH, Brij-56 and CH3(CH2)15N+(CH3)3Br−, CTAB, J&K Chemical Ltd.) under acidic conditions, which has been reported in our previous works.25,26 The GNCs were assembled into the pore channels of the resultant MSTFs via a neutralization reaction between the –AuCl4 and –NH4 groups. First, the silicon or glass substrates dip-coated with AF-MSTFs were immersed in HAuCl4 ethanol solution to introduce the gold precursor to the mesoporous channels. The neutralization reaction lasted for a period of time, whilst under vacuum at room temperature. Then, the samples were rinsed with deionized water to flush away free HAuCl4 on the AF-MSTF surfaces and dried in a clean, ambient atmosphere for 24 h. Next, the composite films were calcined at 400 °C (heating rate of 1 °C min−1) for 2 h under a hydrogen atmosphere and cooled to room temperature.Characterization
Transmission electron microscopy (TEM) and high-resolution TEM (HRTEM) images were recorded with a FEI Tecnal G2 F20 S-Twin apparatus at an accelerating voltage of 200 kV. The polished cross-sectional surface was prepared for TEM characterization with a FEI double beam system, QUANTA 3D FEG. The double beam machine was equipped with an in situ micromanipulator. At the beginning of the TEM sample preparation, a protective platinum layer of about 1 μm was deposited on top of the sample to preserve it during the thinning process. Finally, the thin lamella was transferred to a TEM grid designed to be used with in situ micromanipulators for TEM examination. X-Ray diffraction (XRD) patterns were obtained using a Rigaku TTR III diffractometer featuring Cu-Kα radiation (λ = 0.15418 nm) at 40 kV and 200 mA.UV–vis absorption spectra were recorded on a Hitachi U-4100 spectrometer. The third-order optical nonlinearity of the GNC/MSTF nanocomposite was investigated by the z-scan technique. This is a single-beam method based on the principles of spatial beam distortion and offers simplicity as well as very high sensitivity for measuring the sign and magnitude of the nonlinear refractive index, n2. Two kinds of the GNC/MSTF sample, coated on glass substrates, were measured. Z-Scan measurements were performed using a Mai Tai HP Ti:sapphire laser as an ultrafast optical source operated at a repetition rate of 80 MHz. The laser was operated in the TEM00 mode with a fixed power of about 2 W. The beam waist was about 1 mm. The laser, supplying single pulses and centred at 720 nm with a duration of 100 fs, was focused onto the samples at the focal plane with a spot size of about 80 μm. The typical peak intensity was ∼5.0 GW cm−2 at the beam focus. The laser beam went through the samples with a ∼25° angle between the normal to the film surface and the beam direction. In addition, the samples were placed on a computer-controlled step-type stage, which moved along the z-direction with a fixed pace of 25 μm every 10 s.
Results and discussion
Structure of the nanocomposite
The mesostructures of the blank MSTFs and GNCs/MSTFs were characterized by small-angle XRD (SAXRD), the patterns are presented in Fig. 1. The diffraction peaks at 2θ = 1.9 and 3.8° of the blank MSTF prepared by the Brij-56 surfactant can be indexed to (110) and (220) reflections of a 3D cubic (Im3m) mesostructure with a d110 spacing of approx. 4.7 nm and a lattice constant of about 66 Å. During the preparation of GNCs/MSTFs, calcination is a necessary step, which is an intense thermal treatment. After calcination in hydrogen at 400 °C for 2 h, the corresponding diffraction peaks were obvious, as seen in Fig. 1(a), implying that the GNCs/MSTFs kept an ordered mesostructure. However, the diffraction peaks moved towards a higher 2θ region due to further contraction and condensation of the silica framework.15Fig. 1(b) shows the SAXRD patterns of blank MSTFs and GNCs/MSTFs prepared with the CTAB surfactant. The diffraction peaks at 2θ = 2.34, 3.4, 4.74 and 6.8° can be indexed to (100), (110), (200) and (220) reflections of a cubic cell with a d100 spacing of approx. 3.8 nm and a lattice constant of about 37 Å (a more detailed discussion can be found in our previous report).27 With regards to the GNCs/MSTFs, the (100) peak shifts to a higher 2θ, in a similar way to the Brij-56 samples. Furthermore, the thermal effect causes inhomogeneous shrinkage, or even collapse, of the mesostructure, which may account for the decrease of the reflection intensity.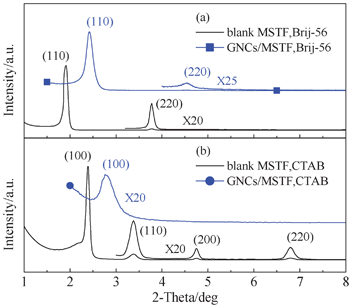 | ||
| Fig. 1 SAXRD patterns of the blank MSTFs and GNCs/MSTFs prepared by (a) Brij-56 and (b) CTAB surfactants. | ||
TEM was used to examine the nature of the mesopores and verify the mesostructure of the MSTFs. The images, shown in Fig. 2(a) and 2(b), were recorded along the perpendicular and parallel direction of the pore channels and show the well-ordered 2D square mesophase of MSTFs fabricated with Brij-56. Thus, the peaks of Fig. 1(a) can also be indexed to (11) and (22) reflections of a 2D square (c2mm) mesostructure. The images shown in Fig. 2(c) and 2(d) depict TEM images of the MSTFs prepared with CTAB with 3D cubic Pm3n mesophase, viewed along the (110) and (210) orientations.28,29 Additionally, we should point out some information necessary for reading the TEM images of the nanoparticles embedded in the MSTFs. With regards to the bright field TEM image, there are a couple of effects that are dependent on the direction of de-focusing (under- or over-focus). When the image is under-focused, the dark areas are high potential regions, where the atoms are located. In going from under- to over-focus, the TEM image inverts the contrast. It is easy to think that Fig. 2(e) is the thin film before introduction of the nanoparticles, while Fig. 2(f) is the one after introduction of the nanoparticles. However, Fig. 2(e) and 2(f) are TEM images of the same sample with different de-focus conditions (Fig. 2(e) is the under-focused image and Fig. 2(f) is the over-focused image).
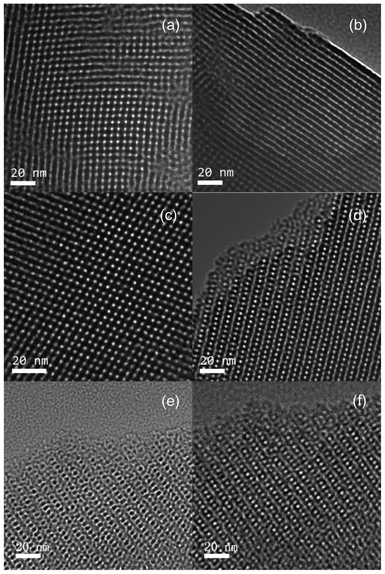 | ||
| Fig. 2 TEM images of blank MSTFs prepared by (a) and (b) Brij-56 and (c)–(f) CTAB surfactants. | ||
Fig. 3 shows the mesopore profiles of the MSTF regions. The average pore periods of the blank MSTFs prepared with Brij-56 and CTAB can be calculated to be 5.2 and 4.3 nm, respectively. The well-ordered MSTFs may be used as nanoreactors to assemble GNCs.
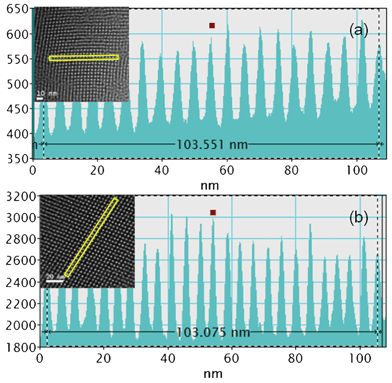 | ||
| Fig. 3 The profiles of the mesopores prepared by (a) Brij-56 and (b) CTAB. The insets show the corresponding TEM images used for the profile analysis. | ||
A cross-sectional bright field TEM image of the GNC/MSTF nanocomposite is shown in Fig. 4. The resultant GNC/MSTF nanocomposite is about 180 nm dip-coated on a 150 nm-thick silicon oxide dielectric on a 500 μm silicon wafer (Fig. 4(a)). The black dots in the composite thin film are the GNCs. Fig. 4(b) shows the well-ordered pore channels and demonstrates that GNCs are embedded at random position along the mesochannels of the thin film with different sizes. The size distribution of Fig. 4(a) is shown in Fig. 4(c). Although more than 85 percent of the GNCs are smaller than the mesopore dimension due to mesopore confinement, a few of them are larger than the mesopore size. In our experiment, the MSTFs serve as a template and can not control the size and distribution of the GNCs exactly. Due to the neutralization reaction between basic –NH4 moieties and HAuCl4, the –AuCl4 groups containing the objective gold element could be effectively incorporated into the inner pore surface. In the subsequent hydrogen reduction, GNCs were redistributed from highly dispersed atoms to aggregated clusters and crystallized well after the thermal annealing.2 This led to an inhomogeneous size and position distribution of the GNCs. Since the particle size is related to the uncontrollable hydrogen reduction and thermal treatment,30 it is hard to obtain a strictly homogeneous dispersion.
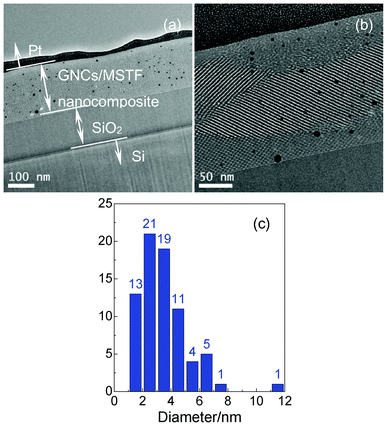 | ||
| Fig. 4 Cross-sectional TEM images of the GNC/MSTF nanocomposite prepared by the Brij-56 surfactant. (b) is the zoom in of (a). (c) is the corresponding size distribution of (b). | ||
The wide-angle XRD (WAXRD) patterns of the GNCs/MSTFs prepared using Brij-56 and CTAB surfactants are shown in Fig. 5(a) and 5(b), respectively. The intense diffraction peaks are all about 2θ = 38°. The peak at 38° can be indexed as the (111) plane of the face-centered cubic (fcc) structure of gold, suggesting that the GNCs are well crystallized in the thin films. Released GNCs were obtained by dissolving the MSTF framework in an ethanolic solution of HF. This method is convenient to allow observation of the GNC morphology and crystal lattice by TEM. The results are shown in the insets of Fig. 5. Although the GNCs appear to be relatively inhomogeneous in size, due to confinement within the MSTF mesopores, the size range of the GNCs is not too large, which can be confirmed by the TEM images of the dispersed GNCs (the insets of Fig. 5). The HRTEM images of the single GNCs show the same d-spacing of about 0.23 nm, indicating that the GNCs crystallized nicely; this result supports the WAXRD findings.
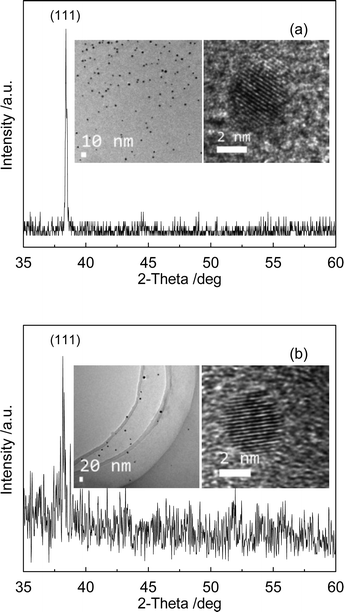 | ||
| Fig. 5 WAXRD patterns in the wide-angle region of the GNC/MSTF nanocomposites produced via (a) Brij-56 and (b) CTAB. The insets show the TEM images of unsupported GNCs and the HRTEM images of singular GNCs. | ||
Linear optical property
The UV–vis absorption spectra of the different samples are shown in Fig. 6. The silicon wafer shows three absorption peaks without the gold nanoparticles. In addition, the absorption spectra are almost the same regardless of whether blank MSTF is deposited or not. As shown in Fig. 4(b), a 180 nm-thick GNC/MSTF nanocomposite layer and a 150 nm-thick silicon oxide layer are observed above the silicon wafer. It is possible that the peaks of the silicon wafer in Fig. 6 stem from a simple absorbance oscillation due to interference phenomena, such as multiple reflection effects taking place at the thin film interfaces. By comparing the peaks of the silicon wafer and blank MSTF prepared via CTAB (Fig. 6), we can draw a conclusion that the interference phenomenon may be caused mainly at the interface of silicon oxide layer, since the nanocomposite is porous and more amorphous than the silicon oxide layer.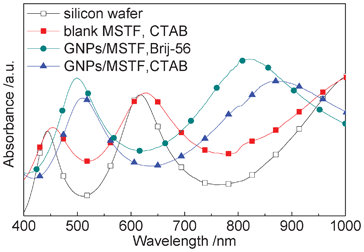 | ||
| Fig. 6 UV–vis absorption spectra of the different samples. The open squares are the results of a silicon wafer with a silicon oxide dielectric on top. The solid squares are the results of a blank MSTF without GNCs prepared by CTAB. The solid circles and triangles are the results of the GNC/MSTF samples prepared in the presence of Brij-56 and CTAB, with neutralization reaction times of 8 and 4 h, respectively. All the samples were prepared on the silicon wafers with the same oxide layer thickness. | ||
Regarding the GNC/MSTF samples, the absorption peaks are located at different wavelengths (Brij-56: 499 and 820 nm; CTAB: 510 and 870 nm). The absorption spectra of the GNC/MSTF samples are a result of the combination of multiple reflection effects on the silicon wafer and the SPR effect of the GNCs. The obvious difference between the absorption peak locations for the blank MSTF sample and the GNC/MSTF sample prepared via CTAB indicates the remarkable SPR effect of the embedded GNCs. What is more, the difference between the spectra of the GNC/MSTF samples prepared by different surfactants may be attributed to the different mesopore size and mesostructure type of the MSTF matrices (Fig. 2), which is related to the assembly of the GNCs and the dielectric constant of the silicon dioxide surroundings.
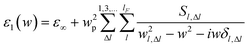
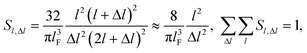
For small particles, where the conduction band breaks up into discrete levels, Genzel has given a quantum-mechanically derived dielectric function, which can be applied to small metallic particles less than 20 nm in diameter.31 The dielectric function of the GNCs, ε1, can be expressed under the restrictions of the dipole transitions as:
 | (1) |
 | (2) |
Together with the Maxwell–Garnett (MG) theory,33,34 the dielectric function εe for the solid thin film embedded with GNCs can be described as:
 | (3) |
 | (4) |
In order to analyze how the matrix dielectric constant, the particle size and the particle content of GNCs affect the absorption peak position of the metallic nanoparticle-embedded composite, calculations were carried out according to eqn (1)–(4). Results are shown in Fig. 7, from which we can conclude that: (1) the absorption peak moves to longer wavelengths (red shifts) as the matrix dielectric constant increases, while the particle size and volume fraction affect the peak location only slightly; (2) there is a near-linear relationship between the peak position and the dielectric constant; (3) the peak position nonlinearly shifts to longer wavelengths with the reducing interval along with the increasing particle size. This proves that both of the matrix and the embedded metallic particles influence the linear optical properties of the nanocomposite.
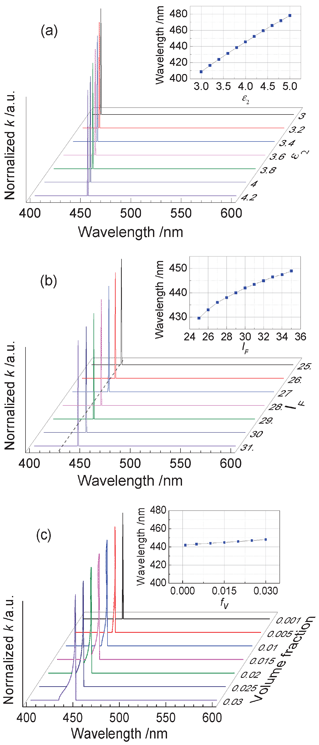 | ||
| Fig. 7 The calculated extinction coefficient of the metallic nanoparticle-embedded composite while varying (a) the matrix dielectric constant, ε2, (b) lF, which implies the particle size and (c) the particle volume fraction fv. The insets show the relationship between the peak wavelength and the parameters of the matrix dielectric constant, particle size and volume fraction. In the calculations, the following values were adopted: n = 5.9 × 1028 m−3, ε∞ = 4 and wp/wF = 1.58, where wF = EF/ħ and EF is the Fermi energy of the GNCs.31 | ||
Supposing that all the particles are shaped like spheroids, in order to analyze how the particle shape influences the absorption properties, we employed the Drude dispersion model to define the dielectric function of the GNCs:
 | (5) |
As for the highly ordered MSTF matrix, its dielectric constant is different from that of bulk SiO2 because of the hollow mesopores. We assume that the dielectric constant of MSTF is described as follows:
 | (6) |
 | (7) |
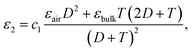
According to eqn (3)–(7), simulated results were obtained and are shown in Fig. 8. It was assumed that the particles were spherical in the calculations of Fig. 8(a)–(c). Without considering silicon oxide film interference, the calculated results shown in Fig. 8 are obviously different from the measurement results of Fig. 6. However, this disagreement does not influence the qualitative analysis of the extinction property of the GNC/MSTF samples. Fig. 8 indicates that the structure of the MSTFs, which influences the matrix dielectric constant, affects the peak location in an obvious way. However, the particle size and filling ratio (one of the factors determining the volume fraction) affect the location only slightly. This matches the results of Fig. 7 well. In addition, how the particle shape (limited to an ellipsoid) influences the extinction properties was investigated. It is clear that, along with an increase of the ratio a/b, the peak position is evidently blue shifted. Moreover, the insets in Fig. 8 tell us that the red shift of the extinction peak is accompanied by a decrease in the volume fraction. However, the increase of the volume fraction caused by the filling ratio and spherical particle size does not change the peak location. There is no direct relationship between the shift behaviour and the volume fraction. This complements the results shown in Fig. 7(c).
 | ||
| Fig. 8 Calculated extinction properties of the GNC/MSTF nanocomposites with different (a) pore structure, (b) spherical particle size, (c) filling ratio and (d) ellipsoidal particle shape. The insets show the relationship between the volume fraction and the wall thickness T, the radius of spherical GNCs a (= b), the particle filling ratio η and the semi-major axis a (≠ b), respectively. In the calculations, the following values were adopted: c1 = 2, c2 = 1, εair = 1, εbulk = 4, the film thickness, H = 200 nm, the constant related to electron–surface interactions, A = 0.43 and the bulk damping constant, γ0 = 4.4 × 10¹⁴ Hz.37 | ||
Combined with effective dielectric theory, we calculated and believe that the red shift of the absorption peaks can be attributed to the SPR of the GNCs. Therefore, we have confirmed that the linear optical properties are evidence of the formation of GNCs within the channels of the MSTFs and the optical properties of the GNC/MSTF nanocomposite can be adjusted by changing the GNCs' shape, size and content, including the MSTF structure. Using different surfactants in the preparation, we obtain different MSTFs with different mesopore sizes and mesostructure types,25 which determine the dielectric constant and the size of the embedded GNCs. Furthermore, by regulating the duration of the neutralization reaction, we could control the volume fraction of the GNCs, which is determined by the size or number of GNCs. The surfactant and the time of the neutralization reaction are two important factors and more research is still required before the final goal of adjusting the linear optical properties of GNC/MSTF nanocomposites can be completed.
Nonlinear optical properties
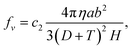
Due to the quantum size effect and interfacial effect, nanocomposite thin films composed of metal particles exhibit large third-order optical nonlinearity.38 We investigated the third-order optical nonlinearity of the GNC/MSTF nanocomposite using the z-scan technique.4,5,25,39,40 Two kinds of GNC/MSTF samples coated on glass substrates were measured. The open-aperture (OA) z-scan results can deduce the nonlinear absorption of the samples, while the closed-aperture (CA) z-scan results can deduce the nonlinear refraction of the samples. The results are shown in Fig. 9. Both the two samples show a pre-focal transmittance valley followed by a post-focal transmittance peak of CA z-scan data, consisting of a raised peak of OA z-scan data, implying self-focusing nonlinearities and positive values for the refractive indices. The OA z-scan curves indicate the presence of nonlinear absorption in the films. Although the relatively low intensity suggests that the nonlinear absorption is feeble, we deduct the nonlinear absorption from the CA output by dividing the CA output by the OA output (the CA curves shown in Fig. 9 are the corrected CA z-scan data). | ||
| Fig. 9 Z-Scan data of GNC/MSTF nanocomposites prepared by (a) Brij-56 and (b) CTAB. The symbols are z-scan measurement results and the solid curves show the calculated results from eqn (8). CA-1 and CA-2 are results of the GNC/MSTF samples measured with closed-aperture and CA-3 is the z-scan results of the glass substrates with blank MSTFs using closed-aperture, while the OAs represent the z-scan data of the GNC/MSTF samples measured with open-aperture. The error bars are added with 5% of the error sources of CA-1 in both (a) and (b). | ||
The intensity-dependent refractive index is expressed as n = n0 + n2I, where I is the intensity of the laser beam within the sample, n0 is the linear refractive index and n2 is the nonlinear refractive index. According to the theoretical analyses originally proposed by Sheik-Bahae et al.,41 the normalized transmittance can be given by:
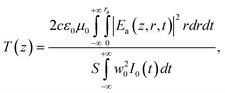 | (8) |
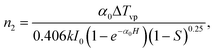 | (9) |
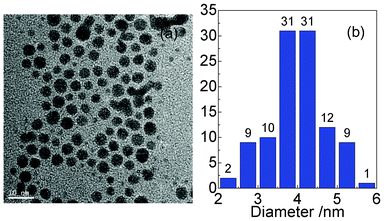 | ||
| Fig. 10 TEM image of the GNCs and the corresponding size distribution. The gold colloid was used to form a GNC film on the glass slide. | ||
In our experiments, the beam radius at the aperture was ∼30 mm, which is three times as large as the aperture radius and S was ∼0.2. Both sides of the glass substrates were coated with the GNC/MSTF sample and the total thickness was ∼400 nm. According to eqn (9), the nonlinear refractive indices of the samples prepared by Brij-56 and CTAB were calculated to be about 8.68 × 10⁻¹¹ and 1.74 × 10⁻¹⁰ cm2 W−1 (namely 6.22 × 10⁻⁷ and 1.25 × 10⁻⁶ esu), respectively, with a linear absorption coefficient of SiO2α0 = 5 × 10⁶ m−1 at 720 nm. In addition, the real part of the third-order optical nonlinear susceptibility can be calculated using n2 according to Reχ(3) = n0n2/(3π).14 On the assumption that the relative dielectric constant of the surrounding medium is 4.0 (n0 ∼2.0), the Reχ(3) values of the Brij-56 and CTAB samples are 1.31 × 10⁻⁷ and 2.62 × 10⁻⁷ esu, respectively. The solid lines in the CA z-scan data are fitting curves obtained from eqn (8). The fits of the calculated curves are good for the nonlinear region of the recorded z-scan curve, except for some interference structures that oscillate near the valleys and peaks. The laser makes contacts with the samples with an oblique incidence angle of ∼25° and the interference structures probably originate from the interference of transmitted light and light reflected by MSTFs.
The observed large refractive nonlinearity in the GNC/MSTF samples mainly originates for three reasons: the interband electric-dipole transitions, hot electron excitations and the thermal contribution.2 On the femtosecond time scale of a pulse width, the thermal contribution, which has a nanosecond, or longer, response time, can be ignored.2 Furthermore, since the thermalization time of electrons is about 500 fs,42 the hot electrons can contribute partially to the nonlinear refractive index at a pulse width of less than 100 fs. As a result, the interband electric-dipole transition is the main physical mechanism inducing the optical nonlinearity in the GNC/MSTF nanocomposites.
Nalda et al.43 reported a thermo-optical effect of Cu:Al2O3 composite films synthesized with alternate pulsed-laser deposition technique. A laser, with 12 ps pulses at a repetition rate from 80 to 40 MHz, was used in their measurement. Patterson et al.44 reported a similar lensing effect of Cu:SiO2 composite films prepared by an RF sputtering technique. They used a laser with 3 ns pulses operated at a 50 Hz repetition rate. They announced that the thermal lens contributes to modification of the divergence of the beam in a z-scan experiment and, thus, misleads the interpretation of the results. However, the situation in the GNC/MSTF composite films studied here is not the same as in those films, which are prepared by a conventional sputtering technique. In our experiments, the same normalized transmittances, CA-1 and CA-2, were obtained on the same position of the same sample, as shown in Fig. 9(a). In addition, the transmittance, CA-1 and CA-2 shown in Fig. 9(b), are the results of repeated measurements. Although the nonlinear properties of the glass substrates with MSTFs may come from a thermal effect, the results indicate that no optical damage (such as ablation) occurred during the measurements and the comparative increase of ΔTvp is as a result of the GNC quantum effect. As seen in Fig. 3, the incorporated GNCs are sparsely dispersed in the matrix with a low concentration. Thus, the electron–phonon coupling to the matrix may be slight. In addition, the large surface area is beneficial for thermal diffusion under adequate ventilation and the high pore volumes of the MSTF matrix promote heat loss and avoid the thermal lens effect. As a result, the thermal lens effect as a result of cumulative heating induced by consecutive pulses may be neglected.
It is also noticed that the optical nonlinearity of this kind of material is related to the incident light, the particle size, the matrix refractive index and the particle concentration.2,8,13,14 Thus, we tentatively put forward that the optical nonlinearity of the GNC/MSTF nanocomposite can be adjusted as the mesostructure of the MSTF is tunable and the size and concentration of the GNCs can be controlled. Unfortunately, we should point out that a study of the dependence of the optical nonlinearity of the GNC/MSTF nanocomposite with regards to these factors has not yet been carried out.
Conclusions
In conclusion, we have synthesized and characterized a GNC/MSTF nanocomposite. Results show that the MSTF is a good template with well-ordered mesopores and well-crystallized GNCs can be assembled into the pore channels by neutralization and reduction procedures. However, it is difficult to realize the GNC arrays located at the top of MSTF with a uniform size in our experiment. In addition, it is hard to get an ideal homogenous dispersion of GNCs. The UV–vis spectra show the nanocomposite film possesses linear optical properties. Analytic results of a quantum mechanical model are in good agreement with the ones obtained by the Drude dispersion model. All of the factors of the particle size, particle shape, filling ration and film structure influence the linear optical properties of the nanocomposite. By using the z-scan technique, we measured the nonlinear refractive indices of the GNC/MSTF samples at 720 nm without thermo-optical effects. The calculated values of n2 are about 8.6 × 10⁻¹¹ and 1.7 × 10⁻¹⁰ cm2 W−1. It is possible that the linear and nonlinear optical properties of the GNC/MSTF nanocomposite could be adjusted by changing the experiment conditions (such as the use of a different surfactant, the neutralization reaction, calcination, and so on). The results presented here suggest the potential applications of this material in optical devices.Acknowledgements
The present work was financially supported by the Advanced Research Foundation of the National University of Defence Technology under grant No. JC11-02-19 and the National Natural Science Foundation of China under grant No. 11104349. The authors thank Wendy Chen, Application Engineer at FEI Company, for preparation of the TEM samples.References
- H. Y. Fan, K. Yang, D. M. Boye, T. Sigmon, K. J. Malloy, H. Xu, G. P. López and C. J. Brinker, Science, 2004, 304, 567 CrossRef CAS.
- H. B. Liao, R. F. Xiao, J. S. Fu, P. Yu, G. K. L. Wong and P. Sheng, Appl. Phys. Lett., 1997, 70, 1 CrossRef CAS.
- H. B. Liao, R. F. Xiao, H. Wang, K. S. Wong and G. K. L. Wong, Appl. Phys. Lett., 1998, 72, 1817 CrossRef CAS.
- G. Battaglin, P. Calvelli, E. Cattaruzza, F. Gonella, R. Polloni, G. Mattei and P. Mazzoldi, Appl. Phys. Lett., 2001, 78, 3953 CrossRef CAS.
- G. Yang, W. Wang, Y. L. Zhou, H. B. Lu, G. Z. Yang and Z. G. Chen, Appl. Phys. Lett., 2002, 81, 3969 CrossRef CAS.
- Q. F. Zhang, W. M. Liu, Z. Q. Xue, J. L. Wu, S. F. Wang, D. L. Wang and Q. H. Gong, Appl. Phys. Lett., 2003, 82, 958 CrossRef CAS.
- J. L. Gu, J. L. Shi, G. J. You, L. M. Xiong, S. X. Qian, Z. L. Hua and H. R. Chen, Adv. Mater., 2005, 17, 557 CrossRef CAS.
- Ichiro Tanahashi, Yoshio Manabe, Takao Tohda, Satoshi Sasaki and Arao Nakamura, J. Appl. Phys., 1996, 79, 1244 CrossRef CAS.
- P. Prem Kiran, B. N. Shivakiran Bhaktha, D. Narayana Rao and Goutam De, J. Appl. Phys., 2004, 96, 6717 CrossRef.
- X. A. Zhang, Y. Q. Chi, J. Y. Fang, H. Q. Zhong, S. L. Chang, L. Fang and S. Q. Qin, Phys. Lett. A, 2010, 374, 4880 CrossRef CAS.
- A. K. Das and S. Mukhopadhyay, Chinese Opt. Lett., 2005, 3, 172 Search PubMed.
- Q. Q. Wang, J. B. Han, H. M. Gong, D. J. Chen, X. J. Zhao, J. Y. Feng and J. J. Ren, Adv. Funct. Mater., 2006, 16, 2405 CrossRef CAS.
- F. M. Cui, Z. Hua, X. Z. Cui, L. M. Guo, C. Y. Wei, W. B. Bu and J. L. Shi, Dalton Trans., 2009, 2679 RSC.
- F. M. Cui, Z. Hua, C. Y. Wei, J. Q. Li, Z. Gao and J. L. Shi, J. Mater. Chem., 2009, 19, 7632 RSC.
- F. M. Cui, C. D Feng, R. J. Xie, Z. L. Hua, Hideyuki Ohtsuka, Yoshio Sakka and J. L. Shi, Opt. Express, 2010, 18(3), 2010 CrossRef CAS.
- S. Besson, T. Gacoin, C. Ricolleau, C. Jacauiod and J. P. Boilot, Nano Lett., 2002, 2, 409 CrossRef CAS.
- Kashinath Rangu Patil, Young Kyu Hwang, Deok Kyu Kim, JongSan Chang and SangEon Park, Bull. Korean Chem. Soc., 2005, 26, 1025 CrossRef CAS.
- S. Besson, T. Gacoin, C. Ricolleau and J. P. Boilot, Chem. Commun., 2003, 3, 360 RSC.
- Yann Battie, Nathalie Destouches, Laurence Bois, Fernand Chassagneux, Nathalie Moncoffre, Nelly Toulhoat, Damien Jamon, Youcef Ouerdane, Stéphane Parola and Aziz Boukenter, J. Nanopart. Res., 2010, 12, 1073 CrossRef CAS.
- Atsushi Fukuoka, Hidenobu Araki, Yuzuru Sakamoto, Noriaki Sugimoto, Hiroshi Tsukada, oko Kumai, Yusuke Akimoto and Masaru Ichikawa, Nano Lett., 2002, 2, 793 CrossRef CAS.
- Yoko Kumai, Hiroshi Tsukada, Yusuke Akimoto, Noriaki Sugimoto, Yoshiki Seno, Atsushi Fukuoka, Masaru Ichikawa and Shinji Inagaki, Adv. Mater., 2006, 18, 760 CrossRef CAS.
- Atsushi Fukuoka, Hidenobu Araki, Jun-ichi Kimura, Yuzuru Sakamoto, Takanori Higuchi, Noriaki Sugimoto, Shinji Inagakic and Masaru Ichikawa, J. Mater. Chem., 2004, 14, 752 RSC.
- H. S. Hsueh, C. T. Yang, Jeffrey I. Zink and Michael H. Huang, J. Phys. Chem. B, 2005, 109, 4404 CrossRef CAS.
- H. Y. Fan, Adam Wright, John Gabaldon, Adrian Rodriguez, C. Jeffrey Brinker and Y. B. Jiang, Adv. Funct. Mater., 2006, 16, 891 CrossRef CAS.
- X. A. Zhang, W. J. Wu, J. F. Wang and X. Z. Tian, Appl. Surf. Sci., 2008, 254, 2893 CrossRef CAS.
- X. A. Zhang, J. F. Wang, W. J. Wu, S. W. Qian and Y. H. Man, Electrochem. Commun., 2007, 9, 2098 CrossRef CAS.
- J. Y. Fang, S. Q. Qin, S. L. Chang and X. A. Zhang, Microporous Mesoporous Mater., 2011, 145, 205 CrossRef CAS.
- Y. F. Lu, Rahul Ganguli, Celeste A. Drewien, Mark T. Anderson, C. Jeffrey Brinker, W. L. Gong, Y. X. Guo, Hermes Soyez, Bruce Dunn, Michael H. Huang and Jeffrey I. Zink, Nature, 1997, 389, 364 CrossRef CAS.
- Yasuhiro Sakamoto, Mizue Kaneda, Osamu Terasaki, Dong Yuan Zhao, Ji Man Kim, Galen Stuckyk, Hyun June Shin and Ryong Ryoo, Nature, 2000, 408, 449 CrossRef CAS.
- F. M. Cui, C. D. Feng, R. J. Xie, Z.L. Hua, X. Z. Cui, J. Zhou, C. Y. Wei, Hideyuki Ohtsuka, Yoshio Sakkad and Jianlin Shi, J. Mater. Chem., 2010, 20, 8399 RSC.
- L. Genzel, T. P. Martin and U. Kreibig, Z. Phys. B: Condens. Matter Quanta, 1975, 21, 339 CrossRef CAS.
- Paul Mulvaney, Langmuir, 1996, 12, 788 CrossRef CAS.
- G. L. Hornyak, C. J. Patrissi, C. R. Martin, J.-C. Valmalette, J. Dutta and H. Hofmann, Nanostruct. Mater., 1997, 9, 575 CrossRef CAS.
- M. Y. Koledintseva, R. E. DuBroff and R. W. Schwartz, Prog. Electromagn. Res., 2006, 63, 223 CrossRef.
- C. F. Bohren and D. R. Huffman, Absorption and scattering of light by small particles, Wiley Interscience, New York 1983 Search PubMed.
- Pinchuk, U. Kreibig and A. Hilger, Surf. Sci., 2004, 557, 269 CrossRef CAS.
- H. Hodak José, Arnim Henglein and Gregory V. Hartland, J. Chem. Phys., 2000, 112, 5942 CrossRef.
- H. P. Li, B. Liu, C. H. Kam, Y. L. Lam, W. X. Que, L. M. Gan, C. H. Chew and G. Q. Xu, Opt. Mater., 2000, 14, 321 CrossRef CAS.
- H. Shen, B. L. Cheng, G. W. Lu, T. Y. Ning, D. Y. Guan, Y. L. Zhou and Z. H. Chen, Nanotechnology, 2006, 17, 4274 CrossRef CAS.
- Evangelia Xenogiannopoulou, Kostas Iliopoulos, Stelios Couris, Tanya Karakouz, Alexander Vaskevich and Israel Rubinstein, Adv. Funct. Mater., 2008, 18, 1281 CrossRef CAS.
- Mansoor Sheik-Bahae, Ali A. Said, Wei Tai-Huei, David J. Hagan and E. W. Van Stryland, IEEE J. Quantum Electron., 1990, 26, 760 CrossRef CAS.
- S. L. Logunov, T. S. Ahmadi, M. A. El-Sayed, J. T. Khoury and R. L. Whetten, J. Phys. Chem. B, 1997, 101(19), 3713 CrossRef CAS.
- R. de Nalda, R. del Coso, J. Requejo-Isidro, J. Olivares, A. Suarez-Garcia, J. Solis and C. N. Afonso, J. Opt. Soc. Am. B, 2002, 19(2), 289 CrossRef CAS.
- M. Patterson Brian, W. Roc White, Todd A. Robbins and Randall J. Knize, Appl. Opt., 1998, 37(10), 1854 CrossRef.
| This journal is © The Royal Society of Chemistry 2012 |