Redox additive aqueous polymer gel electrolyte for an electric double layer capacitor†
S. T.
Senthilkumar
a,
R. Kalai
Selvan
*a,
N.
Ponpandian
b and
J. S.
Melo
c
aSolid State Ionics and Energy Devices Laboratory, Department of Physics, Bharathiar University, Coimbatore, 641 046, India. E-mail: selvankram@buc.edu.in; Fax: +91 422 2425706; Tel: +91 422 2428446
bDepartment of Nanoscience and Technology, Bharathiar University, Coimbatore, 641 046, India.
cNuclear Agriculture and Biotechnology Division, BARC Trombay, Mumbai, 400 008, India
First published on 31st August 2012
Abstract
A hydroquinone mediated PVA–H2SO4 gel electrolyte (PHHQ) and activated carbon from bio-waste were prepared for supercapacitor fabrication. PHHQ delivered a higher capacitance (941 F g−1 at 1 mA cm−2) and energy density (20 Wh kg−1 at 0.33 W g−1) than the PVA–H2SO4 gel electrolyte (425 F g−1 at 1 mA cm−2, 9 Wh kg−1 at 0.33 W g−1).
Recently, polymer electrolytes have become more attractive for the emerging applications of energy storage devices such as batteries, supercapacitors and fuel cells because of the drawbacks including leakage, corrosion and packing problem encountered with liquid electrolytes. In order to overcome these practical difficulties, polymer solid or polymer (hydro) gel electrolytes have been used.1 Nevertheless, polymer gel electrolytes such as poly(vinyl alcohol) (PVA), poly(vinyl chloride), poly(ethylene oxide) (PEO), poly(vinylidene carbonate) and poly(vinylidene fluoride) have a certain distinct advantage of better ionic conductivity (10−3 to 10−4 S cm−1) than solid electrolytes (10−7 to 10−8 S cm−1).1,2 Polymer gel electrolytes contain a large amount of water in the polymer matrix which can enhance the ionic conductivity. However among the used polymers, PVA is the most examined polymer because of its low cost, good electrochemical stability, good mechanical properties and non-toxic nature.1
In the recent past, electrical double layer capacitors (EDLCs) known as supercapacitors (SCs) were considered as one of the prominent energy storage systems due to their good safety, fast charging–discharging, long cycle life and higher power density. Unfortunately, its practical application is impeded by its lower energy density. To facilitate the energy density, researchers have tried to identify various types of electrode materials (metal oxides/hydroxides,3–5 polymers6 and carbon based materials7,8) and electrolytes (organic, inorganic, ionic liquids solutions9 and polymer electrolytes1,10).
Recently, some pioneering work was carried out with polymer gel electrolytes to enhance the capacitance of the SCs by introducing redox electrochemical active compounds or additives into the gel electrolytes. Notably, Yu et al.10a reported that KI introduced PVA–KOH polymer electrolyte exhibits an improved capacitance of 236.9 F g−1, which is nearly 74.28% more than the PVA–KOH electrolyte. Similarly, the NaI–I2 embedded PEO–LiClO4 provides a much higher specific charge of 210 C g−1 than pristine PEO–LiClO4 (45 C g−1).10b Subsequently, P-benzenediol incorporated into a PVA–H2SO4 gel electrolyte also showed an increased capacitance compared to the absence of P-benzenediol, from 129.29 F g−1 to 474.29 F g−1.11
Herein, we report the electrochemical behaviour of a hydroquinone incorporated polymer gel electrolyte for SCs. Fig. 1 is a schematic representation for the preparation of aqueous PVA–H2SO4 polymer gel electrolyte. In detail, 1 g of PVA was dissolved in 20 ml of distilled H2O with magnetic stirring at 50 °C for 5 h to form the transparent gel like solution (Step 1). Further, 0.015 mol of diluted (10 ml, distilled H2O) H2SO4 (Step 2) followed by 0.5 g of hydroquinone (HQ) was added to the above solution with constant stirring for 1 h. The solution was then kept at 40 °C to form the PVA–H2SO4–HQ (PHHQ) gel electrolyte. Similarly, the same procedure was repeated for the synthesis of the PVA–H2SO4 (PH) polymer gel electrolyte without using HQ.
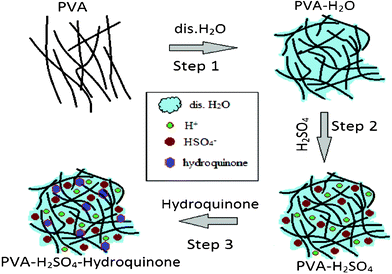 | ||
| Fig. 1 Formation mechanism of the PVA–H2SO4–hydroquinone polymer gel electrolyte. | ||
Likewise, the activated carbon (AC) is also derived from Eichhornia crassipes for the active electrode using the following procedure. The dehydrated Eichhornia crassipes were pulverized. Then the desired amount of pre-heated sample was activated in 10% of KOH for 24 h. Subsequently, it was carbonized at 600 °C (K600), 700 °C (K700) and 800 °C (K800) for 2 h under argon atmosphere. Further, the carbonized sample was washed with distilled H2O and desired amount of 1 M HCl until the pH became nearly 6–7 and was finally dried at 100 °C for overnight.
The working electrode was fabricated by mixing of prepared activated carbon (20 mg), carbon black (2 mg) and poly(vinylidene fluoride) (PVDF, 2 mg) in a mass ratio of about 83.3![[thin space (1/6-em)]](https://www.rsc.org/images/entities/char_2009.gif) :
:![[thin space (1/6-em)]](https://www.rsc.org/images/entities/char_2009.gif) 8.3
8.3![[thin space (1/6-em)]](https://www.rsc.org/images/entities/char_2009.gif) :
:![[thin space (1/6-em)]](https://www.rsc.org/images/entities/char_2009.gif) 8.3 and dispersed in 0.4 ml of N-methyl-2-pyrrolidone (NMP) to produce a homogenous slurry. Here, the carbon black and PVDF act as the conductive agent and binder, respectively. Then 12 μl of resulting slurry was coated onto the 0.04 mm thick 305 stainless steel sheet (1 cm × 1 cm). The loaded activated carbon was calculated to be 0.6 mg (except carbon black and PVDF mass) on each electrode. Finally, the fabricated electrodes were dried overnight at 50 °C. The symmetric SCs were then assembled using two identical fabricated activated carbon electrodes with prepared polymer electrolyte. Here, the polymer gel electrolyte can perform the dual role of electrolyte and separator. The electrode preparation and assembly of SCs were successfully completed in air atmosphere. The assembled SCs were tested by cyclic voltammetry (CV) at different scan rates (5–50 mV s−1), galvanostatic charge–discharge (GCD) at different current densities (1–20 mA cm−2) in the potential range of 0 to 0.8 V and electrochemical impedance spectroscopy (EIS) at an a.c. amplitude of 10 mV with the frequency ranges from 30 mHz to 1 MHz. Four different types of SCs were fabricated and the detailed configurations are K600/PH/K600, K700/PH/K700, K800/PH/K800 and K700/PHHQ/K700, which are further denoted as P, PHS, PHSS and PHHQS respectively.
8.3 and dispersed in 0.4 ml of N-methyl-2-pyrrolidone (NMP) to produce a homogenous slurry. Here, the carbon black and PVDF act as the conductive agent and binder, respectively. Then 12 μl of resulting slurry was coated onto the 0.04 mm thick 305 stainless steel sheet (1 cm × 1 cm). The loaded activated carbon was calculated to be 0.6 mg (except carbon black and PVDF mass) on each electrode. Finally, the fabricated electrodes were dried overnight at 50 °C. The symmetric SCs were then assembled using two identical fabricated activated carbon electrodes with prepared polymer electrolyte. Here, the polymer gel electrolyte can perform the dual role of electrolyte and separator. The electrode preparation and assembly of SCs were successfully completed in air atmosphere. The assembled SCs were tested by cyclic voltammetry (CV) at different scan rates (5–50 mV s−1), galvanostatic charge–discharge (GCD) at different current densities (1–20 mA cm−2) in the potential range of 0 to 0.8 V and electrochemical impedance spectroscopy (EIS) at an a.c. amplitude of 10 mV with the frequency ranges from 30 mHz to 1 MHz. Four different types of SCs were fabricated and the detailed configurations are K600/PH/K600, K700/PH/K700, K800/PH/K800 and K700/PHHQ/K700, which are further denoted as P, PHS, PHSS and PHHQS respectively.
The representative XRD pattern of prepared AC (K700) shows broad peaks (Fig. 2a) at 2θ of about 23° and small peak at 42° corresponding to the (100) and (101) plane reflection respectively that indicates the amorphous carbon structure.12 The Raman spectra (Fig. 2b) also showed the highly disordered carbon characteristics. The peak at about ∼1360 cm−1 is attributed to the D band which indicates the breathing mode vibration of A1g, related to disordered carbon. The observed G band at ∼1565 cm−1 relates to in-plane stretching vibration mode of E2g in sp2 carbons.13 The typical SEM image (Fig. 2c) infers the porous microstructure of AC without any particular shape. The FTIR spectra were examined to know the presence of functionalities on AC (Fig. 2d). The observed broad peak at about 3200 cm−1 corresponds to hydroxyl functional groups. The peaks at 1064 and 1224 cm−1 are ascribed to –C–OH and C–O stretching vibrations. The peak at 1430 cm−1 is related to –CH2. Similarly, the peak at 1562 cm−1 is ascribed to the quinone group, which is expected to be involved in redox reactions during electrochemical performance. The additional peaks at 871 cm−1 and 583 cm−1, are assigned to aromatic (–C–H) and siloxane groups.14,15a
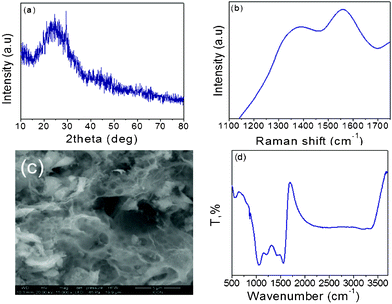 | ||
| Fig. 2 Typical XRD pattern (a), Raman spectra (b), SEM (c) and FTIR spectra (d) of activated carbon (K700). | ||
From the measured CV (Fig. 3a) curve at 5 mV s−1, for the fabricated SCs using PVA–H2SO4 as the electrolyte (P, PHS and PHSS) is almost ideally capacitive i.e. rectangular behaviour without any redox peak. It means that the large amount of capacitance is contributed by an accumulation of charges at electrode–electrolyte interfaces. Even at higher scan rate of 100 mV s−1 (Fig. S2†), it retains its original behaviour that further substantiates the good electrochemically active behaviour of the materials. Compared with P and PHSS, PHS covers the wide current integral area which reveals its high specific capacitance (Csp). The triangular nature of charge–discharge curve (Fig. 3b) further substantiates the EDLC behaviour. The calculated Csp from the charge–discharge curve are 377, 425 and 317 F g−1 for P, PHS and PHSS respectively at 1 mA cm−2. Overall, the PHS delivered the higher Csp than the P and PHSS (for detail see ESI†) and the reported values.15b In order to further enhance the Csp of PHS, the HQ incorporated PVA–H2SO4 (PHHQ) gel was used as the electrolyte and the corresponding CV and charge discharge pattern are also given in Fig. (3a, b) respectively. Interestingly, PHHQS exhibits the reversible redox peak (Fig. 3a) and covers a larger current area than PHS in the CV curves. This enhanced current rate is due to the occurrence of a redox reaction between the HQ–quinone (Q) couples.16a Because during the charging, HQ is oxidized to Q by generation of 2H+ with 2e− and during discharge, Q is reduced to HQ via absorption of 2H+ with 2e− (Fig. 4), the HQ incorporated PVA–H2SO4 electrolyte can boost up the total capacitance of the SC via its electrochemical redox behaviour. The PHHQS shows a small deviation in the CV curve (Fig. S3a†) at a higher scan rate of 100 mV s−1, which may be the reason for incomplete redox reactions at fast ionic charge–discharge process and narrow access of ions on electrode–electrode interfaces. Similarly, the PHHQS exhibits a relatively nonlinear curve during charge–discharge (Fig. 3b), which reveals the pseduocapacitance nature. The shape of the charge–discharge curves do not vary even at a higher current density, which further reveals the good capacitive performance of SC (Fig. S3b†).10,11 The specific capacitance of the hydroquinone incorporated PVA–H2SO4 gel electrolyte (PHHQS) is twice the value (941 F g−1) of pristine PHS (425 F g−1), which is comparable to or higher than the reported values (Table 1).10,11 The current density is increased from 1 to 20 mA cm−2, the specific capacitance (Fig. 3c) of P, PHS, PHSS and PHHQS is decreased to 275, 333, 260 and 374 F g−1, respectively. Here, PHHQS shows a relatively lower capacitance retention (39.7%) at higher current density (20 mA cm−2), while it was 73%, 78.3% and 82.3% for P, PHS and PHSS respectively. This decreasing capacitance at higher current density may be because the hydroquinone is not completely utilized in the redox reaction. However, it still shows a higher capacitance of about 11% more than the PHS. The PHHQS delivers a significantly higher energy density of 20 Wh kg−1 at a power density of 0.33 W g−1 than P, PHS, and PHSS (Fig. 3d) and reported values (Table 1). It can be concluded that the energy density can be increased nearly twofold by introducing hydroquinone into PVA–H2SO4.
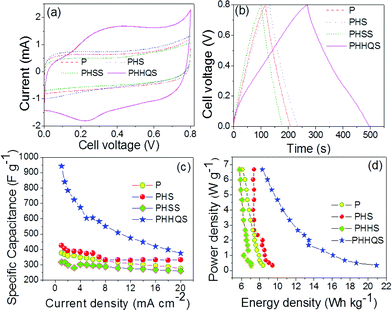 | ||
| Fig. 3 CV curve at 5 mV s−1 (a), charge–discharge curve at 1 mA cm−2 (b), current density vs. Csp (c) and Ragone plot (d) of P, PHS, PHSS and PHHQS. | ||
 | ||
| Fig. 4 Typical redox process between hydroquinone and quinine. | ||
| Polymer gel supercapcitor | Specific capacitance (Csp) | Energy density (E) Wh kg−1 | Ref. |
|---|---|---|---|
| P-benzenediol–PVA–H2SO4 | 474.29 F g−1 | 11.31 | 11 |
| KI–PVA–H2SO4 | 236.9 F g−1 | 15.34 | 10a |
| PHHQS | 941 F g−1 | 20 | Present work |
The EIS analysis is further evidence to study the mechanism of charge storage. The PHS shows an almost vertical line at a lower frequency region to the real axis of the Nyquist plot (Fig. 5a) and it reveals the pure capacitive behaviour. However, a small deviated line is obtained at the middle frequency region for PHHQS and is associated with the pseudocapacitance, so it may exhibit larger Warburg/diffusion resistance than PHS. The semicircle is acquired at higher frequency and is related to inner and charge transfer resistance of the gel electrolyte, respectively. The inner (Rs), charge transfer (Rct) and Warburg/diffusion (W) resistance of gel electrolytes were obtained by using the best fit and the corresponding equivalent circuit is given in Fig. S5e.† The measured inner resistance (Rs) of the gel electrolyte of PHHQS is smaller (1 Ω) than that of PHS (1.2 Ω), which infers a small improved ionic conductivity of the HQ incorporated gel electrolyte.16b Whereas, the charge transfer resistance (Rct) is obtained to be 1 and 4 Ω respectively. On the other hand, the PHHQS shows a higher diffusion resistance of 1.9 Ω than PHS (0.75 Ω). Here, PHHQS exhibits a higher charge transfer resistance than that of PHS, which may be as a result of the poor electrical conductivity of HQ or the redox reaction involvement of hydroquinone during the electrochemical process. However, due to its participation in the redox reaction it can enhance the capacitance, thus its contribution is considerable for practical application.
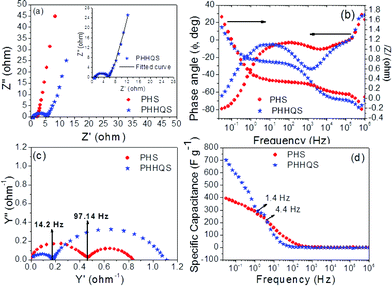 | ||
| Fig. 5 Nyquist plot (a), Frequency vs. /z/ and Φ (b), admittance plot (c) and frequency vs. specific capacitance (e) of PHS and PHHQS. (Inset Fig. a is evidence the best fit of Nyquist plot of PHHQS). | ||
The frequency dependent impedance (Fig. 5b) decreases with increasing frequency at both lower and higher frequency regions. The observed frequency independent impedance at middle frequency region reveals the ionic diffusion from electrolyte to the porous electrode. However, PHHQS exhibits a higher impedance in the middle frequency region, which may be from the lower ionic conductivity/diffusion (or frequency dependence ionic diffusion) of the electrolyte. In addition, the obtained larger diffusion resistance of PHHQS is mainly associated with this middle frequency region, which may be due to the response frequency region for the redox reaction of HQ/Q. However, the observed low impedance of PHHQS at lower and higher frequency region than PHS, infers the good ionic diffusion behaviour of PHHQS. Therefore, PHHQS shows lower inner resistance at high frequency and short diffusion length at lower frequency (Fig. 5a). Similarly, the higher phase angle (Fig. 5b) value, −79° of PHS reveals the ideal capacitive nature because it is closer to −90°. Although PHHQS exhibits a low phase angle value of −64° it may be the contribution of partial ideal capacitive behaviour or the redox nature.16c However, the lower phase angle leads to quick ionic diffusion.3Fig. 5c shows the admittance plot of PHS and PHHQS and is generally characterized by knee frequency. It can be seen that the PHHQS displays low knee frequency (14.2 Hz) than PHS (97.1 Hz) which further substantiates the higher charge transfer resistance of the electrolyte (Fig. 5c).5,3
The observed decrease in capacitance with increase in frequency (Fig. 5d), indicates that a high proportion of capacitance is derived at low frequency rather than at high frequency. However, the higher capacitance value is still obtained for PHHQS which coincides well with charge–discharge capacitance. The calculated function frequency (fo) (at which frequency, 50% of capacitance remains from its maximum capacitance) of PHS and PHHQS are ∼4.4 and ∼1.4 Hz and the resultant relaxation time (τo = 1/fo) constants are 227.2 and 714.3 ms, respectively. Here, the PHHQS exhibits the higher relaxation time constant which specifies a slower energy liberating ability of the device, so it can deliver the energy for an extended time.7,17
Moreover, the cycling stability (Fig. 6a) of PHS and PHHQS were examined through charge–discharge at 5 mA cm−2. It was found that the PHHQS retained about 83% stability after 400 cycles, whereas the PHS could retain about 94%. Nevertheless, after 200 cycles PHHQS maintains the constant capacitance value and this value is higher than the reported values.18a,b Here, the capacitance decay is possibly because of the increasing aggregation of HQ in pores and amorphous area of the electrode active material for the few cycles (∼200 cycles in our case).10b However, after 400 cycles PHHQS can deliver capacitance of 500 F g−1 which is about 33% higher than PVA–H2SO4 (333 F g−1). Fig. 6b shows the charge–discharge curves of 1st and 300th cycles at 5 mA cm−2 and it indicates the decrease of capacitance with cycles. Moreover, the electrochemical stability of the PHHQ could be improved by some further modifications in the synthesis protocol. As a result of incorporating hydroquinone into the PVA–H2SO4 gel electrolyte used SC (PHHQS) can still hope for practical application. Moreover, we connected the five SCs in series and observed that the SCs can turn on the light emitting diode with excellent brightness (Fig. 7).
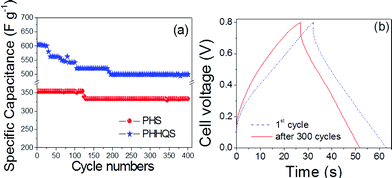 | ||
| Fig. 6 Cycle life (a) and charge–discharge of PHHQS (b) at 5 mA cm−2. | ||
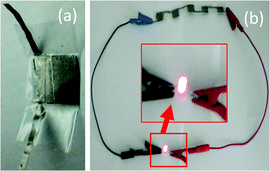 | ||
| Fig. 7 A photograph of a single SC (a) and light emitting diode turned on by five SCs connected in series (b). | ||
In summary, after incorporating hydroquinone into the PVA–H2SO4 gel electrolyte (PHHQ), this supercapacitor can deliver a higher capacitance and energy density of 941 F g−1 at 1 mA cm−2 and 20 Wh kg−1 at 0.33 W g−1 compared with the PVA–H2SO4 gel electrolyte. Thus, we consider the assembly of the biomass derived activated carbon and hydroquinone mediated PVA–H2SO4 supercapacitor to be excellent for practical applications.
Acknowledgements
The authors gratefully thank financial support from DAE-BRNS (No. 2010/37P/46/BRNS).References
- N. A. Choudhury, H. Sampth and A. K. Shukla, Energy Environ. Sci., 2009, 2, 55 CAS.
- M. Selvakumar and D. K. Bhat, J. Appl. Polym. Sci., 2008, 110, 594 CrossRef CAS.
- D. Yuan, J. Zheng, N. Kristian, Y. Wang and X. Wang, Electrochem. Commun., 2009, 11, 313 CrossRef CAS.
- G. Godillot, L. G. Demourgues, P. L. Taberna, P. Simon and C. Delmas, Electrochem. Solid-State Lett., 2011, 14, 139 CrossRef.
- S. L. Chou, J. Z. Wang, H. K. Liu and S. X. Dou, J. Electrochem. Soc., 2008, 115, 926 CrossRef.
- R. Liu, S. I. Cho and S. B. Lee, Nanotechnology, 2008, 19, 215710 CrossRef.
- X. Yang, J. Zhu, L. Qiu and D. Li, Adv. Mater., 2011, 23, 2833 CrossRef CAS.
- S. T. S. Kumar, B. S. Kumar, S. Balaji, C. Sanjeeviraja and R. K. Selvan, Mater. Res. Bull., 2011, 46, 413 CrossRef.
- J. Huang, B. G. Sumpta and V. Meunier, Chem.–Eur. J., 2008, 14, 6614 CrossRef CAS.
- (a) H. Yu, J. Wu, L. Fu, K. Xu, X. Zhang, Y. Lin and J. Lin, Electrochim. Acta, 2011, 56, 6881 CrossRef CAS; (b) J. Zhou, Y. Yin, A.N. Mansour and X. Zhou, Electrochem. Solid-State Lett., 2011, 14, A25–A28 CrossRef CAS.
- H. Yu, J. Wu, L. Fan, Y. Lin, K. Xu, Z. Tang, C. Cheng, S. Tang, J. Lin, M. Huang and Z. Lan, J. Power Sources, 2012, 198, 402 CrossRef CAS.
- V. Subramanian, C. Luo, A. M. Stephan, K. S. Nahm, S. Thomas and B. Wei, J. Phys. Chem. C, 2007, 111, 7527 CAS.
- Y. K. Hsu, Y. C. Chen, Y. G. Lin, L. C. Chen and K. H. Chen, J. Mater. Chem., 2012, 22, 3383 RSC.
- W. Shen, Z. Li and Y. Liu, Recent Pat. Chem. Eng., 2008, 1, 27 CrossRef CAS.
- (a) Y. Chen, Y. Ma and Y. Guo, Adv. Colloid Interface Sci., 2011, 163, 39 CrossRef CAS; (b) C. Meng, C. Liu, L. Chen, C. Hu and S. Fan, Nano Lett., 2010, 10, 4025 CrossRef CAS.
- (a) S. Roldan, C. Blance, M. Granda, R. Menendez and R. Santamaria, Angew. Chem., Int. Ed., 2011, 50, 1699 CrossRef CAS; (b) H. Yu, L. Fan, J. Wu, Y. Lin, M. Huang, J. Lin and Z. Lan, RSC Advances, 2012, 2, 6736 RSC; (c) B. E. Conway, Electrochemical supercapacitor, Kluwer Academic/Plenum Publisher, New York, 1999 Search PubMed.
- V. Ganesh, S. Pitchumani and V. Lakshminarayanan, J. Power Sources, 2006, 158, 1523 CrossRef CAS.
- (a) Z. L. Wang, R. Guo, G.R. Li, H.L. Lu, Z. Q. Liu, F. M. Xiao, M. Zhang and Y. X. Tong, J. Mater. Chem., 2012, 22, 2401 RSC; (b) J. T. Keams and M. E. Roberts, J. Mater. Chem., 2012, 124, 4819 Search PubMed.
Footnote |
| † Electronic Supplementary Information (ESI) available: XRD, FTIR and SEM of K600 and K800, detailed CV, charge–discharge, EIS etc. See DOI: 10.1039/c2ra21387g |
| This journal is © The Royal Society of Chemistry 2012 |
