Structure of a large colloidal crystal – controlling orientation and three-dimensional order†
Maja S.
Hellsing
*a,
Adrian R.
Rennie
a,
Richard K.
Heenan
b and
Sarah E.
Rogers
b
aDepartment of Physics and Astronomy, Box 516, 751 20 Uppsala, Sweden. E-mail: Maja.Hellsing@physics.uu.se; Tel: +46 18 4713556
bISIS Facility, Rutherford Appleton Laboratory, Didcot, OX11 0QX, United Kingdom. E-mail: richard.heenan@stfc.ac.uk; Tel: +44 1235 446744
First published on 13th June 2012
Abstract
The three-dimensional crystal structure of charge stabilised polystyrene latex in deionised water was investigated by small-angle neutron diffraction. Crystallisation with a grain size of approximately 1 × 1 cm2 was observed when the sample was flowed gently in to a 2 mm path cell. Bragg scattering peaks arising from the structure were observed under rotation about three perpendicular axes of the sample. The diffraction patterns indicate clearly that there is a cubic close packed structure with a 110 axis perpendicular to the cell wall. Rotations in small steps show large changes and indicate that the crystal is well oriented and has three-dimensional order. The crystal orientation was controlled by the meniscus and direction of flow when filling the cell.
Introduction and background
In recent years, there has been great interest in ordered colloidal systems, and there are many applications where the properties of these systems can be exploited. Colloidal crystals that show three dimensional order can be used directly in photonic applications or as templates to obtain ‘inverse opal’ photonic crystals.1–3 Thin films of colloids, that self-assemble into two-dimensional structures, can be used to obtain ordered antidot arrays using nanofilm lithography.4,5 In their liquid state, concentrated colloidal dispersions have many industrial applications. For example they are used in health care products, food and paints.6 In these applications, a high degree of order such as that induced by crystallization may either improve the materials or affect the properties of the product in an undesirable way. Information about colloidal crystals can then be used to optimise appropriate structures.Colloids can also be used as model systems to understand the packing and order of atoms. Knowledge about the properties of dispersions can be used to understand the structure and the dynamic behaviour of vapour, liquid and crystalline systems.7,8 Charge stabilized spherical particles, such as polystyrene latex, are convenient for fundamental studies of the stability and forces that govern colloidal dispersions. Long-range electrostatic interaction of the particles enables crystals to form at low volume fractions.7 If colloids are composed of material that deforms, crystallization at high volume fractions may be different to that observed for hard particles.9 The relative positions of particles in a colloidal dispersion is determined by the balance of attractive and repulsive forces that provide a stable, or at least metastable, equilibrium.10 The separation and forces determine the structure and for charged colloidal particles calculations analogous to those for ionic solids can be made.11 Self-assembly of colloidal particles at an interface may also be markedly different to that in the bulk.12
Colloidal crystals with order in three dimensions can be described in crystallographic terms. Crystals of spheres are often found to assemble in close packed structures and there are many reports of observations of oriented colloidal crystals. Flow, and particularly oscillatory shear, was found to promote close packed structures.13,14 Colloidal crystals have also formed in systems without flow and have been studied previously.15–17 Shear of a colloidal crystal can either enhance or destroy order. It may also transform a structure of close packed layers from face centred cubic (fcc) to other stacking of the planes so that hexagonal symmetry is dominant and resembles more the hexagonal close packed (hcp) structure.18–20 The differences in diffraction from various ordered or random sequences of stacked close packed layers has been discussed explicitly for the case of colloidal crystals.21,22 Another means to alter the stacking of colloidal particles is to change the concentration of either the particles or electrolyte. Phase transitions have been observed with these changes.23–25 Light scattering has been used to study the structure and correlations between colloidal particles.8,14 The diffraction from small crystallites gives rise to the characteristic iridescence that is seen in concentrated colloidal dispersions viewed in white light. For detailed studies, optical diffraction suffers from two drawbacks: the wavelength is large and so often only nearest neighbour correlations can be observed. A further difficulty in studies of concentrated dispersions is that they are often opaque and so only the structure near a surface can be investigated.8,23,26
A variety of materials have been studied in experiments and these include soft particles that are swollen to different extents according to environmental parameters such as temperature.27–30 These studies have used neutron scattering, light scattering and electron microscopy but as in many other studies large single crystal domains were not observed. In contrast samples that have been subject to shear have often displayed scattering patterns that indicate uniform orientation over areas of about 1 cm2. Polystyrene latex that has a soft interaction potential has been the subject of a number of studies19,31 and the interpretation of spot patterns has been discussed in detail.21,32 However, unambiguous identification of crystal structures is difficult if only data that represent either a ‘powder’ or a single sample plane are available. This paper describes a study of a large single crystal using multiple rotation axes that avoids these difficulties and presents data for a sample with a structure that was not distorted by extensive shear.
Small-angle neutron scattering
Small-angle neutron scattering (SANS) is useful to investigate structure at colloidal length scales. As neutrons interact weakly with matter they can be used to measure the bulk of a sample that is unperturbed by walls. Although the method is often used to study dilute or non-interacting particles, repeating structures, as in a crystal, give rise to Bragg scattering peaks. The condition for constructive interference from crystallographic planes with a separation d is met when the waves are scattered such that they add in-phase. For a single crystal with given scattering angle, θ, this condition is described by the Bragg equation:| 2dsin(θ/2) = nλ | (1) |
| cosα = (h1h2 + k1k2 + l1l2)/√(h12 + k12 + l12)(h22 + k22 + l22) | (2) |
In an X-ray diffraction experiment with a solid such as a metallic element, the wavelength of the beam is the same order as the separation between the atoms and the resolution of the scattering angle between peaks is high. However, for neutron studies of colloidal crystals the wavelength is much smaller than both the particle size and their separation. In many respects, these conditions more resemble electron diffraction where a number of diffraction peaks can be seen on a planar detector.
The absolute intensity in small-angle neutron scattering measurements can be expressed as the product of the contrast and two functions that describe the structure within the sample:
| I(Q) = kP(Q)S(Q) | (3) |
| Scattering length density, ρ/10−6 Å−2 | Incoherent scattering cross-section/10−28 m2 | |
|---|---|---|
| Latex | 1.41 | — |
| H2O | −0.56 | 161 |
| D2O | 6.35 | 4.1 |
The results in this study are based on neutron diffraction measured at small-angles from a large colloidal crystal formed with a minimum of shear of the sample. Interpretation of data is based on information derived from Q values of Bragg scattering peaks coupled with information about their relative positions. From that information, the latex crystal structure could be deduced. The orientation of the crystal domain with respect to the cell could also be determined.
Experimental
This study uses primarily a polystyrene latex PS3, prepared following the procedure that has been described previously by Goodwin et al.38 Styrene (Merck ≥ 99%) was distilled at low pressure to remove inhibitor. The emulsion polymerisation was made in deionised water under nitrogen gas flow with added sodium dodecyl sulfate (Sigma Aldrich ≥ 99%). Potassium persulfate was used as initiator (Fluka ≥ 98%) and the reaction allowed to continue for 24 h at 60 °C with constant stirring. Details of the composition of the reaction mixture are provided in Table I, supporting information.† The latex was then dialysed extensively (Spectra/Por 7 Dialysis Membrane, 3.7 ml cm−1, molecular weight cut-off 50![[thin space (1/6-em)]](https://www.rsc.org/images/entities/char_2009.gif) 000 formula weight) in deionised water (resistivity 18 MΩ cm) to remove ionic and surfactant residues that remained from the polymerisation.
000 formula weight) in deionised water (resistivity 18 MΩ cm) to remove ionic and surfactant residues that remained from the polymerisation.
Small-angle neutron scattering data were measured with the SANS2D instrument at the ISIS facility, U.K.39,40 SANS2D is a time-of-flight instrument, and a wavelength range of 1.75 to 12.5 Å was used. SANS2D has a position sensitive two-dimensional detector with ∼5.1 mm pixel size. For this experiment, the sample to detector distance was set to 12 m. The source aperture was 12 mm diameter and the circular aperture defining the beam in front of the sample was 8 mm diameter, and the measurement times for each pattern were about 30 min each. All measurements were made at room temperature. The sample holder used in the experiment has been described previously.41 In brief, it consists of two crystals of silicon and sapphire, separated by a PTFE spacer that has filling ports. The thickness of the sample was 2 mm. The rotational axes are shown in Fig. 1. When the angles ω, χ and φ are set to zero, the large flat face of the cell was perpendicular to the incident beam and parallel with the detector. The top and bottom edges of the cell were horizontal.
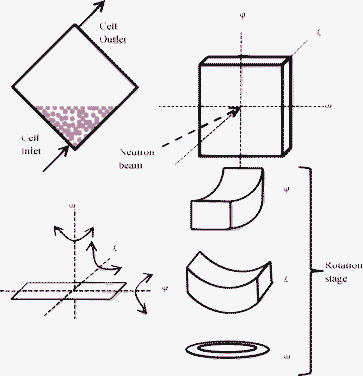 | ||
| Fig. 1 Diagram showing the geometry of filling of the cell and experimental set-up with the cell eucentrically mounted in the beam with the possibility to rotate about three axes ω, χ and φ. | ||
The sample holder was set approximately at χ = 45°, ω and φ = 0° rotation during sample injection, as shown in Fig. 1. The sample was injected into the sample holder very gently with a flow rate of approximately 1 ml min−1 in order to avoid shearing the sample strongly. The latex volume fraction was determined by drying to constant weight to be 0.087 ± 0.001. To characterise the sample two separate measurements were made of diluted latex, 0.5% vol. concentration, with 1 mM added sodium chloride dispersed in different contrasts, H2O and D2O. This data is shown in Fig. 2 and provides a measurement of the form factor P(Q) of the polystyrene latex that is needed for interpretation of neutron diffraction data measured with the concentrated sample. The data showed many minima, and a good fit could be obtained including only two parameters, the particle radius and the particle polydispersity. The model fit in Fig. 2 is for uniform spherical particles of radius of 724 ± 10 Å and a polydispersity with a Gaussian distribution of 4%. The fit includes smearing due to instrumental resolution and a small amount of multiple scattering. Characterisation of the latex was also performed with dynamic light scattering, scanning electron microscopy (shown in Fig. 3) and atomic force microscopy. The average radius of the particles from these measurements was found to be 720 Å with a polydispersity of about 2%, in good agreement with the neutron results.
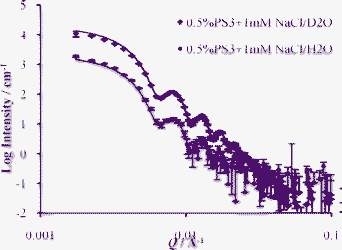 | ||
| Fig. 2 SANS data for dilute latex (PS3) form factor P(Q). Dilute 0.5% vol. latex (PS3) with 1 mM added NaCl measured in different contrasts, D2O and H2O, with model fits. Background scattering from the D2O and H2O has been subtracted. | ||
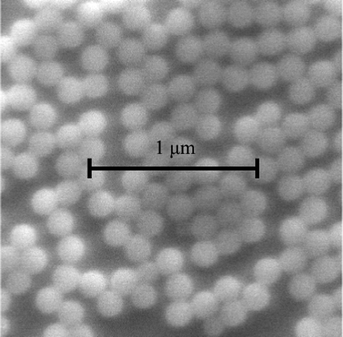 | ||
| Fig. 3 SEM of dried dilute latex PS3. | ||
Results
Latex crystal
For the sample of polystyrene latex (PS3) at a concentration of 8.7% by volume, dispersed in deionised H2O, a clear pattern of diffraction spots was observed with SANS. The illuminated area is somewhat larger than the aperture size when the sample is rotated. The crystal size could be estimated to have lateral dimensions of the order of 1 cm as discrete peaks are observed with a beam diameter of 8 mm. A picture of the sample in the cell after measurement is shown in Fig. 4. It displayed strong iridescence with a large area with a uniform hue when viewed in white light at a fixed angle. The sample cell was mounted on the goniometer stage to enable rotation of the crystal so that diffraction from different planes could be observed. Measurements with all rotational axes set to zero and neutron beam perpendicular to the sample, through the centre of the cell, gave a scattering pattern shown in Fig. 5a left. Two rings of intensity are clearly visible, with six scattering maxima on each. The scattering maxima on the innermost ring appear at Q = 0.0027 ± 0.0003 Å−1 and the maxima on an outer ring at Q = 0.0042 ± 0.0003 Å−1. In the outer ring, the two maxima that lie in the direction of cell fill are much more intense than the other four maxima. The resolution is determined by the angular divergence of the beam and spread in wavelength that is taken in regrouping the data. This makes the relative uncertainty in Q large for small values of Q and the scattering maxima are consequently rather broad. The finite neutron counts also limit resolution that can be used with reasonable statistical accuracy. Hence, the data is presented so that each square pixel in Fig. 5 represents a range ΔQx and ΔQy of 0.0003 Å−1.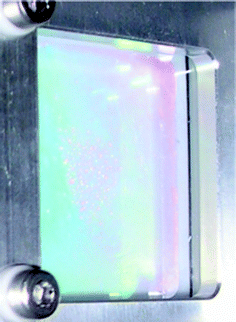 | ||
| Fig. 4 Photograph of latex PS3 in the measurement cell. | ||
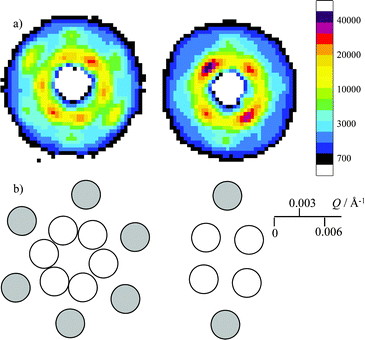 | ||
| Fig. 5 Crystal orientation. a) Left, 2D scattering pattern from the crystal with the cell oriented at ω, χ, φ = 0°, and right, ω = 45° with χ and φ = 0°). b) Bragg indices for the patterns shown in a) where white circles indicate diffraction peaks from 111 and 002 planes. The grey circles show positions of diffraction peaks from 220 planes. | ||
Cell rotation and peak indexing
In order to determine what type of crystal was formed, and its orientation, the cell was rotated around the ω-axis in steps of 15° up to ω = 45° with χ and φ set at zero. On rotation of the sample from 0 to 45°, the symmetry of the inner ring changed from six fold to four fold as seen in Fig. 5. The data for intermediate orientations of ω are shown in the supporting information, Fig. I.† In the right of Fig. 5, the symmetry in the outer ring has changed to show just two weak scattering maxima and the inner ring has four-fold symmetry. This suggests that there is diffraction from the close packed cubic structure crystal structure, with the 110 plane aligned perpendicular to the cell wall.For a fcc crystal with the 110 plane aligned with the cell wall, a 45° ω-rotation brings the 100 plane normal to the neutron beam, with four-fold symmetry as observed. The indexing of the scattering patterns is shown in Fig. 5b. For the scattering pattern with six-fold symmetry, the maxima on the inner ring centred at Q = 0.0027 Å−1 correspond to diffraction from 111 planes. Scattering maxima from 002 planes would arise centred at Q = 0.0031 Å−1 which is very close to the observed position. Within the resolution of the experiment and because of the breadth of the scattering maxima, it is not possible with confidence to differentiate the two peaks. The outer ring with scattering maxima centred at Q = 0.0042 Å−1, corresponds to 220 peaks, where the two peaks in the direction of cell fill are more intense compared to the other four. For the scattering pattern with four-fold symmetry, (Fig. 5 right) all four maxima on the inner ring arise from 002 peaks, and the outer two maxima are 220 peaks.
This observed orientation is different to that found by Ashdown et al.19 for a similar latex sample measured in a Couette shear cell, where the fcc crystal was found to align with the 111 plane parallel to the cell wall. In studies of flow-induced order, the crystal structure is often found to consist of close packed planes parallel to the flow. For the fcc structure this corresponds to 111 planes aligned parallel to the cell wall18,21 but it has been suggested that stacking faults are likely.
The hcp and body centred cubic structures would also show scattering maxima at Q-values similar to the fcc structure for this sample. However, the relative positions of scattering maxima in the two-dimensional scattering patterns from ω-rotations between 0 and 45° do not correspond to the symmetry expected for either the hcp or the bcc crystal structures. Other possible crystal structures have lower packing densities of particles and the positions of diffraction peaks are inconsistent with this concentration of sample.
Data corresponds to expected packing density
Scattering maxima centred at Q = 0.0027 Å−1 correspond to a repeat distance, d(111), in the sample of about 2330 Å, where d = (2π/Qp) is calculated from eqn (1). This corresponds to the separation of the centres of adjacent particles in the repeating structure. The lattice parameter, a = d(111)√3 and cell volume, a3 can be calculated simply. As the fcc unit cell contains 4 particles, this corresponds well with the calculated repeat distance of 2330 ± 30 Å, based on the concentration and size of the latex particles.Small step rotations – determination of crystal alignment
In order to determine how well the crystal was aligned or ordered rotations about the ω-axis with a smaller step size were made. Scattering patterns were measured as ω changed from zero to ten degrees in five degree steps with χ and φ fixed at −2.5° and −15° respectively. The offset in χ and φ were chosen so that the rotation of ω corresponded approximately to a simple crystallographic axis. These data shown in Fig. 6 indicate that with the cell set at ω = 0°, χ = −2.5° and φ = −15° only the scattering maxima for 111 and 002 planes are observed. The 15° offset in φ causes the scattering maxima from the 220 planes to be observed at larger values of ω. This would otherwise be seen when ω = 0°. As expected, rotation about χ with ω and φ set to zero simply turns the scattering pattern in the plane of the detector. This is shown in the supporting information, Fig. II.†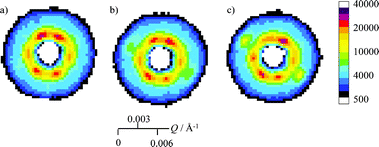 | ||
| Fig. 6 ω rotation of a) 0° b) 5° and c) 10° brings the 220 planes in to the diffraction pattern (Q = 0.0042 ± 0.0003 Å−1). Here χ = −2.5° and φ = −15° rotation. | ||
Some hints of the diffraction from the 220 type planes can be seen on rotating the cell from 0° to 5° in ω. On further rotation of 5°, the 220 type planes were clearly visible. This is shown in Fig. 7, where the data for intensity in rings of constant Q from the two-dimensional scattering patterns in Fig. 6 are plotted against the azimuthal angle in the plane of the detector, ψ. The inner ring covers a Q-range of 0.0025 to 0.0035 Å−1 and the outer ring a Q-range of 0.0040 to 0.0045 Å−1. The six peaks on the inner ring are equally spaced in ψ. There are some changes of the intensity of peaks originating from the 111 and 002 planes on the inner ring: where the scattering at ψ equal to 63° and 117° is higher intensity than the other four peaks. For the outer ring the change is pronounced at ψ of −33° and 147°, with the 220 scattering intensity increasing three-fold.
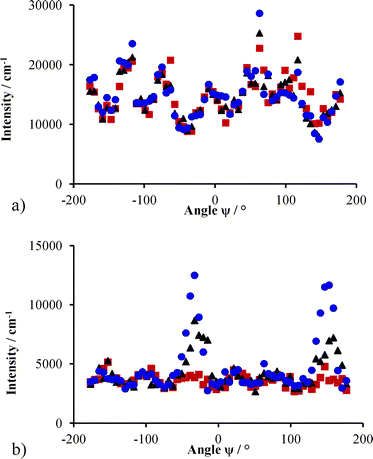 | ||
| Fig. 7 Intensity as a function of angle ψ around a ring of constant Q for ω rotations of 0° (■), 5° (▲) and 10° (●) (χ = −2.5° and φ = −15°). The inner ring in a) shows little variation upon changing the ω rotation, but in the outer ring, b) the 220 planes are brought into view. | ||
The offset in the peak positions with respect to ψ and ω indicate that the crystal may not be perfectly aligned. It is unsurprising that there should be some disorder or mosaicity in a crystal with extremely low yield stress such those formed by self-assembly in a liquid at low volume fraction. The particles are known to be highly mobile and the samples flow as a normal liquid.
Reproducibility
Results have been presented for a polystyrene latex, PS3 that readily forms large crystals as seen from the iridescence. Clear spot patterns were obtained, and the sample was mounted on a stage that enabled crystal identification. However, it is interesting to note that large crystals have been seen for other charge stabilised polystyrene latices, both with rather different size such as PS4 and PS11. These latices were prepared in a similar manner to PS3. The details of sample preparation are given in the supporting information, Table I.† The polymerisation temperature for PS4 and PS11 was 70 °C instead of 60 °C as for PS3, in order to make particles with smaller radius. Latex characterisation parameters are shown in Table 2. For the measurements on PS11, the experimental arrangement on SANS2D was similar to that described above but unfortunately only a few patterns in particular orientations could be recorded in a 1 mm path flow cell. The measurements on PS4 at the Institut Laue Langevin, Grenoble were part of a more extensive study of flow alignment. The results from these measurements are interesting and full details will be published separately. There were only restricted possibilities of rotation in the experimental arrangement and the results will not be discussed in detail. It is clear from these additional measurements shown in Fig. 8 that six-fold hexagonal scattering patterns arising from a large single crystal were obtained, and that the alignment of the crystal corresponds to the direction of flow when the cell was filled. The cell used in both these experiments was 10 mm wide and 1 mm thick, and the samples were exposed to more shear stress than the sample of PS3. For measurements with PS3, the cell was 50 mm wide and 2 mm thick. The sample in Fig. 8a (PS11) was filled horizontally. The two intense maxima on the outer ring are clearly aligned in the direction of flow. In Fig. 8b (PS4), the cell was filled vertically from bottom up. Rotating the cell by about 5° in ω, caused the 220 peaks to no longer be visible. Even rotation by 1° reduced the intensity by more than a factor of 10 which shows that the sample is very well aligned. Other data in the literature, measured in Couette cells, also provides reproducible diffraction patterns.| Latex | PS3 | PS4 | PS11 |
|---|---|---|---|
| Radius/Å | 724 | 483 | 370 |
| Volume fraction | 0.087 | 0.078 | 0.093 |
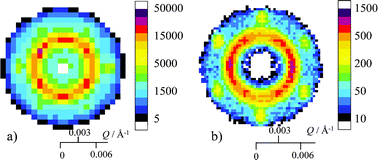 | ||
| Fig. 8 Hexagonal scattering patterns obtained from large crystal formation of latex a) PS11 (measured on SANS2D, ISIS, U.K.) and b) PS4 (measured on D11, ILL, France) with the cell at zero rotation. | ||
Interpretation of S(Q)
Fig. 9 shows scattering contributions arising from two different PS3 samples. One is a sample of 10% volume PS3 in H2O that was injected drop wise with a pipette into a standard fused quartz cell of thickness 1 mm. No significant preferential orientation was seen in the two-dimensional scattering pattern. The scattering from the sample can be considered as a powder average of diffraction from small crystallites that are well ordered but without three-dimensional alignment as a single crystal. This powder average scattering is compared to the circular or azimuthal average of the scattering from the single crystal PS3 sample in H2O at 8.7% volume that was well aligned in a single direction. The average is taken for the data in Fig. 5a left, with the rotational axes ω, χ and φ all set to zero. The advantage of single crystal data is apparent with peaks better resolved when only certain planes are in the diffraction condition. Viewing the scattering in this way, one can see that interpreting data up to Q of approximately 0.007 Å−1 is justifiable. Data at higher Q is dominated by the latex form-factor P(Q), which for monodisperse samples show many orders of minima as seen in Fig. 2, with the precise shape dominated by effects of resolution and multiple scattering.42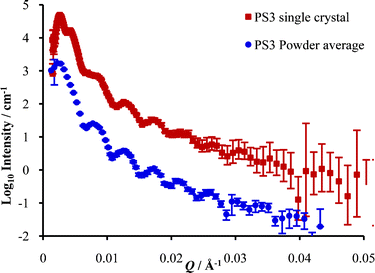 | ||
| Fig. 9 Scattering data for PS3 latex (8.7%) single crystal averaged for all ψ in one orientation (all rotational axes, ω, χ and φ zero) and the ‘powder’ sample of PS3 latex (10%), offset by a factor of ten. | ||
For latices of these sizes and concentrations, multiple scattering may arise and that can affect the measured scattering patterns by smearing out the minima.42,43 The expected multiple scattering contribution can be calculated and a simple procedure using a convolution integral to account for two-fold scattering allows for most of the observed broadening. Understanding this behaviour as well as the instrumental resolution is very important if one is contemplating using eqn (3) and dividing the measured intensity by a form factor to obtain the structure factor. It can be helpful to remove the P(Q) contribution when interpreting scattering data and view only the scattering contribution arising from the inter particle correlations S(Q). Measurements to determine P(Q) for the latex were made in two contrasts, H2O and D2O (details of scattering length densities are found in Table 1). The single crystal sample was dispersed in H2O. As can be seen in Fig. 2 which shows the latex P(Q) for both H2O and D2O as media, the major difference between the curves is that scattering for particles dispersed in H2O reaches the back ground level at lower Q due to the larger incoherent scattering. The plot of the ratio of the two determinations of P(Q) can be found in the supporting information Fig. III,† and it corresponds to the expected calculated scattering length density difference. The higher contrast and lower background gives a smaller uncertainty for the data measured in D2O.
Despite these problems, it can be useful to inspect approximations to S(Q) as they can display the variation with the crystal orientation angles, ω, χ and φ or the azimuthal angle, ψ. The subtle changes in S(Q) can be seen more clearly than in the raw intensity data that varies over many orders of magnitude. For that reason P(Q) measured in D2O was used as a divider, and the resulting ratioed two-dimensional scattering pattern is shown in Fig. 10. It should be noted the intensity scale in Fig. 10 has a very limited range compared to that in Fig. 5a left. This method of analysis has been reported in other studies of one dimensional scattering data from latex crystals.15,17 The scattering peaks from the 111, 002 and 220 planes are seen in Fig. 10 as in the undivided data where contributions from both P(Q) and S(Q) are included. However, in the S(Q) pattern additional scattering maxima can be seen at higher values of Q, where planes such as 113, 222, 004 and 331 would give rise to Bragg peaks for the fcc structure. The maxima tend to overlap and do not appear at regularly spaced values of ψ around the ring, and the maxima are therefore difficult to index specifically. The prominent appearance of the third ring compared to the inner two is due to a minimum in the form-factor P(Q) at this Q.
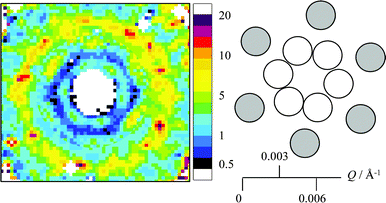 | ||
| Fig. 10 Two-dimensional representation of S(Q); intensity data for ω, φ , χ = 0° divided by the measured P(Q) form factor. Data for Q < 0.0045 Å−1 is reduced with finer bins compared to data for Q > 0.0045 Å−1. | ||
In Fig. 11 the latex ratio spectrum S(Q) (Fig. 10) is shown as a one-dimensional circular average with intensity plotted against Q. Some positions of Bragg peaks are indicated. This representation of the data emphasises the importance of distinguishing the variations in scattering that arise from the sample form factor P(Q) and the structure factor S(Q) when interpreting scattering data from this kind of sample. The peaks at Q smaller than about 0.007 Å−1 are Bragg scattering maxima, whereas the apparent maxima at higher Q arise due to smearing of the minima in the form-factor P(Q) and should not be misinterpreted as diffraction peaks. In viewing the data in this representation, one can however obtain further information on the sample. The first scattering maxima arising from 111 and 002 peaks have a main peak as well as a small shoulder at slightly higher Q. The shoulder would arise from scattering from the 002 plane as expected.
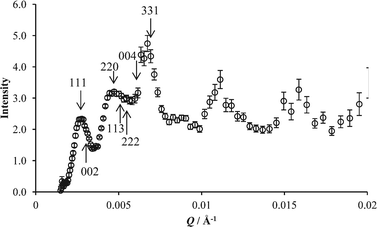 | ||
| Fig. 11 One-dimensional representation of data S(Q) measured with ω, χ and φ at 0°. The intensity data is divided by the measured form factor P(Q). | ||
Conclusions
Reproducible crystallisation with three-dimensional and long-range order was observed for several different samples of latex, with a range of sizes. An extensive study with a large crystal gave rise to discrete Bragg scattering peaks, where the nearest neighbour spacing corresponds to the expected value from the density of the sample. The crystal structure could be determined unambiguously as face centred cubic. Rotating the sample by 45° gave a change in the symmetry of the observed scattering from six-fold to four-fold as expected for the fcc structure. Indexing further peaks allowed the crystal orientation to be determined.This detailed information would not be obtained from a ‘powder’ sample that gives rise to an average diffraction pattern from many randomly arranged crystallites. The crystallite with a lateral size of order 1 cm was formed after gently flowing the sample in to the cell. The direction of flow was found to control the orientation of the crystal. The crystal was aligned with a 110 plane parallel to the cell wall and was well oriented as small rotations showed big changes of scattering intensity. This formation of large crystals should be compared to the usual crystallites that form in the bulk or at the wall of a storage bottle and are often about 1 mm diameter.
In interpretation of scattering data from monodisperse samples by evaluating the structure factor, great care must be taken to avoid artefacts from the minima in the form factor as scattering maxima in the structure factor. The small changes in the structure factor can be dominated by larger differences in multiple scattering and resolution broadening.
Knowledge as to how to form a large three-dimensional crystal with specific orientation is of great importance. It is expected that these results can be applied to applications that require large uniform nanostructures. Relevant fields include development of storage devices that can exploit lithography to prepare two-dimensional arrays of metallic particles on a substrate as well as templating for three-dimensional photonic materials.
Acknowledgements
We are grateful to the ISIS facility for allocation of beam time for these experiments. We would also like to thank Dr Paul Butler for helpful discussions during the experiment.References
- F. Meseguer, Colloids Surf., A, 2005, 270–271, 1–7 CrossRef CAS.
- H. Míguez, F. Meseguer, C. López, A. Mifsud, J. S. Moya and L. Vázquez, Langmuir, 1997, 13, 6009–6011 CrossRef.
- J. H. J. Thijssen, A. V. Petukhov, D. C. 't Hart, A. Imhof, C. H. M. van der Werf, R. E. I. Schropp and A. van Blaaderen, Adv. Mater., 2006, 18, 1662–1666 CrossRef CAS.
- E. Th. Papaioannou, V. Kapaklis, P. Patoka, M. Giersig, P. Fumagalli, A. Garcia-Martin, E. Ferreiro-Vila and G. Ctistis, Phys. Rev. B: Condens. Matter Mater. Phys., 2010, 81, 054424 CrossRef.
- A. Kosiorek, W. Kandulski, P. Chudzinski, K. Kempa and M. Giersig, Nano Lett., 2004, 4, 1359–1363 CrossRef CAS.
- Modern Aspects of Colloidal Dispersions, R. H. Ottewill and A. R. Rennie, Kluwer Academic Publishers, Dordrecht, 1997, ISBN 0-7923-48192-2 Search PubMed.
- R. H. Ottewill, Langmuir, 1989, 5, 4–9 CrossRef CAS.
- P. N. Pusey, W. van Megen, P. Bartlett, B. J. Ackerson, J. G. Rarity and S. M. Underwood, Phys. Rev. Lett., 1989, 63, 2753–2756 CrossRef CAS.
- J. C. Pàmies, A. Cacciuto and D. Frenkel, J. Chem. Phys., 2009, 131, 044514 CrossRef.
- H. N. W. Lekkerkerker and R. Tuinier, Colloids and the Depletion Interaction, Lecture Notes in Physics Volume 833, Springer, Dordrecht, The Netherlands, 2011 Search PubMed.
- J. J. Spitzer, Langmuir, 2004, 20, 537–539 CrossRef CAS.
- G. Vernizzi, D. Zhang and M. O. de la Cruz, Soft Matter, 2011, 7, 6285–6293 RSC.
- I. W. Hamley, J. A. Pople, C. Booth, Y.-W. Yang and S. M. King, Langmuir, 1998, 14, 3182–3186 CrossRef CAS.
- S. M. Clarke and A. R. Rennie, Faraday Discuss., 1996, 104, 49–63 RSC.
- T. Haranda, H. Matsuoka, T. Ikeda, H. Yamaoka, N. Hamaya, S. Sasaki, T. Mori, M. Hashimoto and T. Takahashi, Colloids Surf., A, 2000, 174, 99–111 CrossRef.
- T. Okubo, H. Yoshimi, T. Shimizu and R. H. Ottewill, Colloid Polym. Sci., 2000, 278, 469–474 CAS.
- H. Matsuoka, H. Tanaka, T. Hashimoto and N. Ise, Phys. Rev. B, 1987, 36, 1754–1765 CrossRef.
- Ch. Dux, S. Musa, V. Reus, H. Versmold, D. Schwahn and P. Lindner, J. Chem. Phys., 1998, 109, 2556–2561 CrossRef CAS.
- S. Ashdown, I. Marković, R. H. Ottewill, P. Lindner, R. C. Oberthűr and A. R. Rennie, Langmuir, 1990, 6, 303–307 CrossRef CAS.
- S. Förster, A. Timmann, C. Schellbach, A. Frömsdorf, A. Kornowski, H. Weller, S. V. Rothand and P. Lindner, Nat. Mater., 2007, 6, 888–893 CrossRef.
- S. M. Clarke, A. R. Rennie and R. H. Ottewill, Langmuir, 1997, 13, 1964–1969 CrossRef CAS.
- H. Versmold, J. Phys. Chem. B, 2010, 114, 4115–4121 CrossRef CAS.
- D. J. Cebula, J. W. Goodwin, G. C. Jeffrey, R. H. Ottewill, A. Parentich and R. A. Richardson, Faraday Discuss. Chem. Soc., 1983, 76, 37–52 RSC.
- E. B. Sirota, H. D. Ou-Yang, S. K. Sinha, P. M. Chaikin, J. D. Axe and Y. Fuji, Phys. Rev. Lett., 1989, 62, 1524–1527 CrossRef CAS.
- H. Versmold and Ch. Dux, Colloid Polym. Sci., 2000, 278, 181–185 CAS.
- R. H. Ottewill, A. Parentich and R. A. Richardson, Colloids Surf., A, 2000, 161, 231–242 CrossRef CAS.
- T. Hellweg, C. D. Dewhurst, E. Brückner and K. Kratz, Colloid Polym. Sci., 2000, 278, 972–978 CAS.
- T. Hellweg, C. D. Dewhurst, W. Eimer and K. Kratz, Langmuir, 2004, 20, 4330–4335 CrossRef CAS.
- S. Tang, Z. Hu, Z. Cheng and J. Wu, Langmuir, 2004, 20, 8858–8864 CrossRef CAS.
- J. D. Debord, S. Eustis, S. B. Debord, M. T. Lofye and L. A. Lyon, Adv. Mater., 2002, 14, 658–662 CrossRef CAS.
- B. J. Ackerson, J. B. Hayter, N. A. Clark and L. Cotter, J. Chem. Phys., 1986, 84, 2344–2349 CrossRef CAS.
- W. Loose and B. J. Ackerson, J. Chem. Phys., 1994, 101, 7211–7220 CrossRef CAS.
- A. Guinier, X-ray diffraction in Crystals, Imperfect Crystals, and Amorphous Bodies, Dover Publications, New York, 1994 Search PubMed.
- J. K. Cockcroft, A Hypertext Book of Crystallographic Space Group Diagrams and Tables, http://img.chem.ucl.ac.uk/sgp/mainmenu.htm, 1999 Search PubMed.
- International Tables for Crystallography, Volume A, Space Group Symmetry, Wiley, Hoboken, N.J., USA, 5th edn, 2005 Search PubMed.
- F. Candau and R. H. Ottewill, Scientific Methods for the Study of Polymer Colloids and Their Applications, Kluwer Academic Publishers, Dordrecht, 1990 Search PubMed.
- R. E. Ghosh, S. U. Egelhaaf and A. R. Rennie, A Computing Guide for Small-Angle Scattering Experiments, Institut Laue Langevin Publications, 5th edn, 2006, ILL06GH05T Search PubMed.
- J. W. Goodwin, J. Hearn, C. C. Ho and R. H. Ottewill, Colloid Polym. Sci., 1974, 252, 464–471 CAS.
- R. K. Heenan, S. M. King, D. S. Turner and J. R. Treadgold, Proc ICANS-XVII, 2006, 780–785 Search PubMed.
- R. K. Heenan, S. E. Rogers, D. Turner, A. E. Terry, J. Treadgold and S. M. King, Neutron News, 2011, 22, 19–21 CrossRef.
- M. S. Hellsing, A. R. Rennie, L. Porcar and C.-J. Englund, Prog. Colloid Polym. Sci., 2011, 138, 139–142 CAS.
- J. R. D. Copley, J. Appl. Crystallogr., 1988, 21, 639–644 CrossRef CAS.
- J. Šaroun, J. Appl. Crystallogr., 2000, 33, 824–828 CrossRef.
Footnote |
| † Electronic supplementary information (ESI) available: This includes details of the reaction mixtures for preparation of different latices. Further diffraction data measured in other orientations are shown and a comparison of scattering in different contrasts is provided. See DOI: 10.1039/c2ra21092d |
| This journal is © The Royal Society of Chemistry 2012 |
