Direct production of glucose from glycogen under microwave irradiation†
Miri
Klein
a,
Indra Neel
Pulidindi
a,
Nina
Perkas
a,
Ella
Meltzer-Mats
b,
Arie
Gruzman
b and
Aharon
Gedanken
*a
aKanbar Laboratory for Nanomaterials, Center for Advanced Materials and Nanotechnology, Bar Ilan University, Ramat Gan, 52900 Israel. E-mail: gedanken@mail.biu.ac.il; Fax: 972-7384053.
bDivision of Medicinal Chemistry, Department of Chemistry, Bar Ilan University, Ramat Gan, 52900 Israel
First published on 13th June 2012
Abstract
The production of fermentable sugars from renewable sources is a challenge. An attempt was made to exploit glycogen as a potential feedstock for the production of glucose. The microwave-assisted acidic hydrolysis was applied for glycogen decomposition for the first time. The optimal conditions for the hydrolysis reaction (yield of glucose – 62 wt.%) were identified: microwave irradiation time – 10 min and concentration of acid – 1 M HCl. Microwave irradiation has dramatically reduced the reaction time from more than 6 h (at 80 °C under an oil bath) to 10 min. 13C NMR spectroscopy was employed to monitor the progress of the hydrolysis reaction. HPLC analysis was employed to evaluate the yield of glucose. Thus, the viability of the use of glycogen as an economically and environmentally benign precursor to the production of glucose has been demonstrated.
1. Introduction
The twin problems of energy security and climate change have caused a paradigm shift from the use of non-renewable energy sources (fossil fuels) to renewable energy sources (biofuels).1,2 Currently, 97% of the energy consumed in transport, industry and governmental organizations is supplied by petroleum. As the world petroleum reserves are being depleted, alternate non petroleum-based energy sources are being investigated vigorously.3 Biofuels form one of the promising alternative energy sources that contribute positively to the reduction of CO2 emissions (clean environment), reduce the dependence on petroleum-based fuels (foreign exchange savings), generate new employment opportunities, and aid in the development of rural communities (socioeconomic issues).4–5 The term biofuels refers to the liquid or gaseous fuels produced from biological (organic) sources (biomass, including energy crops, crop residues, glycogen) and employed for transport applications.6–8 Biofuels are an economically viable and cost effective alternative to the existing fossil fuels.6,9Among the biofuels, bioethanol is a trusted alternative to fossil fuels. Bioethanol is currently produced worldwide on a large scale (14–26 million tons). In the next two decades bioethanol is expected to be the most extensively used and predominant fuel for transportation.10 Brazil has currently been the most successful nation in producing bioethanol from either sugar cane juice or molasses. In 2010, Brazil produced 27 billion liters of bioethanol with the domestic market increasing steadily.11 Brazil and United States alone have produced about 70% of the world's bioethanol. Several other countries with an agronomic-based economy can adopt the currently-used fermentation technology for bioethanol production.4,12
Biomass is currently being advocated and investigated intensively as a feedstock for the production of bioethanol.3,6,13–17 Conventionally, bioethanol is produced by the biological fermentation of carbohydrate polymers such as starch and cellulose generated from plant materials.16,18–24 In sharp contrast to the fast depleting petroleum-based fuels, bioethanol is both a renewable and environmentally friendly (carbon neutral) fuel.25–30 In addition, owing to the high octane number (108.6) 31 and heat of vaporization (38.6 kJ mol−1), ethanol is an alternative fuel. It can be used as neat alcohol in specific engines or can be blended with gasoline.4 The typical challenges in the economically feasible production of bioethanol include: (1) identifying appropriate feedstock; (2) developing suitable pretreatment methods; and (3) developing fast and efficient methods of hydrolysis for the release of glucose from carbohydrate polymers (starch, cellulose and glycogen) and the subsequent fermentation of the sugars.7,10,12,14,18,25,30,32–37
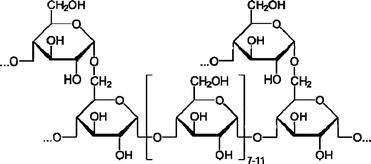
Just as sugars are stored in plants as cellulose and starch, glucose is stored in animal cells as glycogen. Glycogen, a biopolymer, is a rich and abundant source of glucose [Scheme 1].
Animal remains serve as the natural source of glycogen. Energy in animals is accumulated in the liver and muscles as glycogen.38 Glycogen is an appropriate, more viable and advantageous feedstock for glucose production rather than lignocellulosic biomass, as it needs no additional pretreatment. The synthesis of glycogen from CO2 by photosynthesis, and subsequently converting it to glucose, has recently become a challenge that will make glycogen an abundant and renewable feedstock for glucose.5
To the best of our knowledge, the information on the conversion of glycogen to biofuel has not been reported in the literature. Thus, the focus of the current investigation is to develop an efficient method for the production of glucose from glycogen. This work is the first attempt on the hydrolysis of glycogen using microwave irradiation. The process was done in a regular microwave oven equipped with a reflux column. The products were analyzed by 13C NMR and HPLC.
2. Experimental
2.1 Materials
Glycogen from bovine liver, α-D-anhydrous glucose 96%, and sodium hydroxide 98%, were purchased from Sigma–Aldrich Co., (St. Louis, MO, USA). The water used was double distilled. Hydrochloric acid (about 32%) was purchased from Frutarom Ltd., Haifa, Israel. Deionized water and acetonitrile (HPLC grade) were purchased from Merck KGaA, Darmstadt, Germany.2.2 Synthesis and characterization
A typical glycogen hydrolysis process comprises of subjecting 0.4 g of glycogen in a 20 mL HCl solution to microwave irradiation. The hydrolysis process was carried out in a domestic microwave modified so as to have provision for a distillation column passing through the microwave (MW) oven (for enhanced operation safety). The MW system also contained a stirring facility that operated during the reaction.39–41 The microwave oven operated at 2.45 GHz in a batch mode under air at atmospheric pressure. The output of the applied microwave reactor was 1100 W. Reaction parameters such as the acid concentration and microwave irradiation time were varied to optimize the hydrolysis process. For comparison, the glycogen hydrolysis reaction was also carried out under conventional reflux conditions under an oil bath at 80 °C. To evaluate the effect of temperature as well as microwave heating on the glycogen hydrolysis reaction, the reaction was also carried out in a commercial microwave oven (MARS5, CEM Corporation, Matthews, USA) where there is a provision for temperature control. After the hydrolysis process, the reaction products were filtered through a filter paper.13C NMR analysis was performed on a Bruker Avance DPX 300 instrument using D2O as a solvent. For the HPLC analysis the reaction products of glycogen hydrolysis were neutralized with dilute NaOH and lyophilized for 24 h. The solid mass (0.5 g) was diluted with 2 mL of HPLC grade water and analyzed with an HPLC device (Young Lin Clarity 9100 with 9160 PDA UV detector). UV detection was carried out at 195 nm. The flow rate was set to 1.0 mL min−1 and injections of 100 μL were made. A Luna Phenomenex 5μ NH2 column 100 A column was used (250 mm × 4.6 mm). The ratio of acetonitrile and deionized water used was 80% to 20%.42 A guard column was attached to the inlet of the column to prevent clogging. The content of the glucose in the hydrolyzate was calculated according to the weight of the solid mass obtained after the hydrolysis reaction and lyophilization.
In order to have an idea of the exact amount of solid mass obtained from the hydrolyzate through lyophilization, the residual amount of water was deduced by thermogravimetric analysis (TGA). TGA analysis was carried out using a Mettler TGA/STDA 851 device. In the TGA experiment, the sample powders were heated from 25 to 600 °C at a heating rate of 10 °C min−1 under Ar atmosphere.
3. Results and discussion
3.1. Identification of products by 13C NMR
The 13C NMR spectra of the reactant (authentic sample of glycogen) and the reaction product (hydrolyzate of glycogen in 1 M HCl) are depicted in Fig. 1A.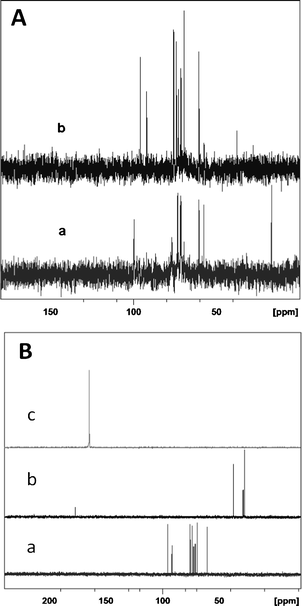 | ||
| Fig. 1 13C NMR spectra: A – authentic sample of glycogen (a) and hydrolyzate from glycogen (b) in 1 M HCl upon microwave irradiation; B – authentic samples of glucose (a), levulinic acid (b) and formic acid (c). | ||
It can be seen that upon microwave irradiation for 10 min in the presence of 1M of HCl, the peaks typical of glycogen (60.6, 69.4, 71.2, 71.6, 71.8, 73.4, 76.8, 99.6 ppm) disappeared completely. Conversely, peaks characteristic of glucose (60.3 (C6), 69.2 (C4), 72.4 (C2), 73.7 (C3), 75.3 (C5) and 95.3 (C1)) are observed, indicating the complete conversion of glycogen. No other sugars, such as xylose, were found in the products.43–44 Glucose can be fermented readily by Saccharomyces cerevisiae to ethanol relative to other sugars. Apart from glucose, under specific reaction conditions, levulinic and formic acid were also formed. These are the decomposition products of glucose.
Peaks at 27.9 and 37.7 ppm were also observed, typical of methylene adjacent to the carboxylic group and methylene adjacent to the carbonyl group of levulinic acid (CH3COCH2CH2COOH) (Fig. 1A (b)). The peak at 29.1 ppm corresponds to the methyl group and peak at 177.4 ppm corresponds to the carboxyl group (clearly visible in Fig. SI†). The appearance of levulinic acid is associated with the formation of hydroxymethyl furfural (HMF) (from glucose) and its subsequent decomposition to levulinic acid and formic acid. The 13C NMR spectrum of HMF is shown in Fig. SII.† No signals typical of HMF were seen in the hydrolyzate (Fig. 1A (b)) implying that the decomposition of HMF to levulinic and formic acid is complete and fast under microwave irradiation. To confirm the presence of glucose and levulinic acid in the hydrolyzate, the 13C NMR spectra of the authentic samples of glucose, levulinic acid (Fig. SIII†) and formic acid were recorded and shown in Fig. 1B. The spectral features of the hydrolysis products of glycogen (Fig. 1A) match well with the authentic samples of glucose and levulinic acid (Fig. 1B), confirming their formation during microwave irradiation. The schematic representation of the conversion of glycogen to glucose and levulinic acid and formic acid is depicted in Scheme 2.
 | ||
| Scheme 2 Schematic representation of hydrolysis of glycogen. | ||
3.2. Effect of concentration of HCl on the hydrolysis of glycogen
The reaction parameters were optimized to obtain the highest yield of glucose from the glycogen and the products composition was tested. The different concentrations of HCl (no acid, 0.5, 1, 3 and 5 M) were tested, and among them 1 M of HCl was found to be the optimum value with a complete conversion of glycogen upon microwave irradiation for a period of 10 min (Table 1).| Conc. of HCl/M | Reactant | Reaction products | ||
|---|---|---|---|---|
| Glycogen | Glucose | L.A.a | F.A.a | |
| a L.A. – levulinic acid; F.A. – formic acid. “+” present; “−” absent. | ||||
| 5 | − | + | + | + |
| 3 | − | + | + | + |
| 1 | − | + | + | + |
| 0.5 | + | + | − | − |
| No acid | + | − | − | − |
With 0.5 M of HCl, the conversion of glycogen was not complete. In the absence of HCl, even under microwave irradiation, the glycogen hydrolysis reaction did not proceed, indicating that the presence of an acid catalyst is inevitable for the conversion of glycogen to glucose. In the presence of HCl with a concentration above 0.5 M, the hydrolysis product of glycogen, namely glucose, underwent further reactivity to form HMF, which subsequently decomposed to levulinic acid and formic acid.45–49
3.3. Effect of reaction time on the hydrolysis of glycogen under microwave irradiation
The influence of time on the microwave-assisted hydrolysis of glycogen was tested at different intervals (2, 4, 6, 8 and 10 min). The 13C NMR spectra of the hydrolyzates obtained from the irradiation of glycogen (0.4 g) with the optimal concentration of HCl (1 M, 20 mL) are depicted in Fig. SIV.†The nature of the glycogen hydrolysis products obtained as a function of time is summarized in Table 2. In the case of 2, 4 and 6 min irradiation, together with the glucose peaks, a peak typical of glycogen (99 ppm) was also observed, indicating that the conversion of glycogen was not complete. Upon irradiation for 10 min, only glucose, but no trace of glycogen, is observed, indicating the complete conversion of glycogen to glucose. In addition to glucose, peaks typical of levulinic acid (27.9 and 37.7 ppm) were also observed, indicating that the decomposition of glucose to levulinic acid and formic acid took place through the formation of HMF.
| Reaction time/min | Reactant | Reaction products | ||
|---|---|---|---|---|
| Glycogen | Glucose | L.A. | F.A. | |
| a L.A. – levulinic acid; F.A. – formic acid. “+” present; “−” absent. | ||||
| 10 | − | + | + | + |
| 8 | − | + | + | + |
| 6 | + | + | − | − |
| 4 | + | + | − | − |
| 2 | + | + | − | − |
3.4. Determination of the glucose content by HPLC
The content of glucose in the reaction products was determined by HPLC analysis. A representative HPLC chromatogram recorded on the hydrolyzate obtained from the irradiation of glycogen (0.4 g in 1 M HCl, 20 mL) for 10 min is shown in Fig. 2. The peak with a retention time of 8.9 min is of glucose,42 which is known from the chromatograms recorded for preparing a calibration plot with varying amounts of glucose.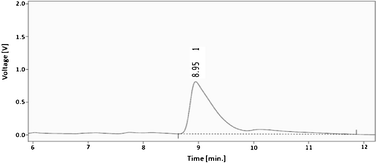 | ||
| Fig. 2 Typical HPLC chromatogram of the hydrolyzate (from 0.4 g glycogen in 20 mL, 1 M of HCl for 10 min). | ||
The yields (wt.%) of glucose (deduced from HPLC chromatograms) as a function of time of microwave irradiation are shown in Fig. 3. A steady increase in the yield of glucose with irradiation time from 2 (32 wt.%) to 10 (62 wt.%) minutes is observed. The optimum time of microwave irradiation with the highest yield (62%) of glucose is 10 min.
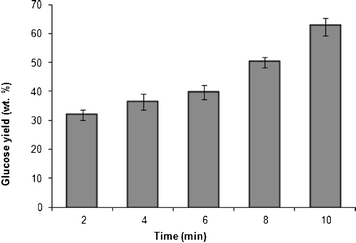 | ||
| Fig. 3 Glucose yield (wt.%) as a function of time of irradiation of the hydrolyzate (glycogen (0.4 g) in HCl (1 M, 20 mL)). | ||
The method of hydrolysis was extrapolated to higher amount of glycogen (2.0 g) as well. Complete conversion of glycogen with a glucose yield of 68 wt.% was observed under identical conditions. The slightly higher yield (68 wt.%) of glucose with the higher amount of glycogen (2.0 g) relative to the smaller amount used before (0.4 g), is due to the increased number of molecular collisions leading to the reduction in the activation energy barrier and thereby resulting in the formation of increased amount of the product, glucose.
Thus, the results obtained on glucose production upon the hydrolysis of glycogen under acidic conditions indicated the potential of glycogen as a promising feedstock for the generation of fermentable sugars.
3.5. Comparison of the effect of microwave irradiation vs. heating at 80 °C under an oil bath
To elucidate the accelerating effect of microwave irradiation in the glycogen hydrolysis reaction, the reaction was carried out both under microwave irradiation and in conventional heating with a reflux system in an oil bath at 80 °C with 1 M of HCl. A pictorial representation of the two processes is depicted in Fig. 4.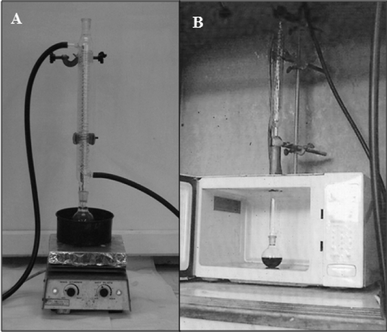 | ||
| Fig. 4 Pictorial representation of the hydrolysis of glycogen carried out under (A) an oil bath at 80 °C and (B) microwave irradiation. | ||
The analysis of the 13C NMR of the hydrolyzates obtained from microwave irradiation is presented in Fig. SIV† and Table 2. The microwave hydrolysis reaction was completed in a short period, 10 min. In the case of the heating with an oil bath, even after 6 hours, traces of glycogen (peak at 99 ppm) are observed in the 13C NMR spectrum of the hydrolysis (Fig. 5, Table SV†). This indicates that conventional heating at 80 °C with an oil bath requires more than 6 h, whereas the same process is completed in 10 min under microwave irradiation.
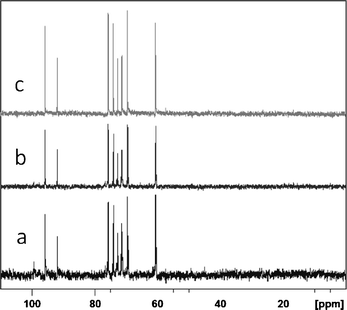 | ||
| Fig. 5 13C NMR spectra of the reaction product of glycogen hydrolysis carried out with 1 M HCl under heating with an oil bath at 80 °C for various time periods (a) 3 h, (b) 6 h and (c) 22 h. | ||
Interestingly, when the reaction is carried out on an oil bath, no degradation products of glucose such as levulinic acid and formic acid were observed. The only reaction product of the hydrolysis of glycogen is glucose, even after 22 h of heating under an oil bath (Fig. 5c and Table SV†). The yield of glucose, as deduced from HPLC analysis, after 22 h of glycogen hydrolysis under reflux conditions, is 39 wt.%.
For comparison, the glycogen hydrolysis reaction was also carried out under identical conditions (0.4 g glycogen, 1 M of HCl, 20 mL, 10 min) in a commercial microwave oven where good control over the temperature can be achieved. The MW hydrolysis reaction was carried out at 80 °C for different time periods, namely, 8, 10 and 12 min. Glucose was the sole product of hydrolysis, unlike the byproducts such as levulinic acid and formic acid formed when the hydrolysis was carried out in a domestic microwave oven (Fig. SVI†). The relative yields of glucose as a function of microwave irradiation (commercial microwave oven, CEM) time, are pictorially represented in Fig. 6.
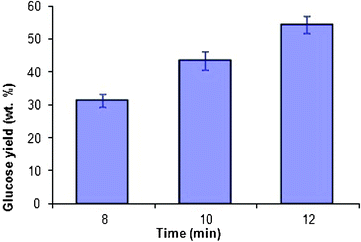 | ||
| Fig. 6 Glucose yield (wt.%) as a function of time of irradiation of the hydrolyzate in a commercial microwave oven, CEM, at 80 °C (glycogen (0.4 g) in HCl (1 M, 20 mL)). | ||
The yields (wt.%) of glucose were found to be 31, 43 and 54 wt.% when the hydrolysis reaction was carried out for 8, 10 and 12 min, respectively. It should be noted that, in a short duration of 12 min, a 54 wt.% yield of glucose is produced under microwave irradiation (CEM) relative to only 39 wt.% yield of glucose obtained under conventional heating after 22 h.
The higher yield of glucose (62 wt.%) in the case of microwave irradiation in a domestic microwave oven relative to that of a commercial oven, CEM (43 wt.%) may be probably due to the higher temperatures generated in the former case. The commercial MW oven enables a precise control of temperature which is not possible in the domestic microwave oven. Thus, the microwave irradiation, either domestic or commercial, facilitates the acceleration of the glycogen hydrolysis process.
More than 6 h is needed for the full conversion of glycogen with 1 M HCl at 80 °C under regular stirring. The use of microwave irradiation has dramatically reduced the reaction time from more than 6 h to 10 min with 1 M HCl. This difference is due to the superheating achieved under microwave radiation of the reaction mixture, unlike the conventional heating in a oil bath which is reflected in the use of either domestic or commercial MW ovens. Even when the temperature is fixed at 80 °C, hot spots in the liquid can occur, accelerating the reaction, as compared to conventional heating at the same temperature. This MW irradiation is more effective in the degradation of the glycogen and accelerates the hydrolysis reaction.
4. Conclusions
The microwave irradiation of glycogen under acid conditions (1 M HCl) yielded a complete conversion with the highest yield of glucose (62 wt.%) in a time period as short as 10 min. When the hydrolysis reaction was carried out under conventional heating (oil bath), more than 6 h were needed for the complete conversion of glycogen. Thus, the accelerating effect of microwave energy for the production of fermentable sugar (glucose) from glycogen has been demonstrated. Upon acid hydrolysis, glycogen yielded exclusively glucose as the fermentable sugar and no other C5 or C6 sugars are produced, which are formed inevitably when lignocellulosic biomass is employed as a feedstock for the generation of sugars. As glycogen can be produced from abundant and renewable chemical feedstock like CO2, the use of glycogen as a precursor for glucose generation is an economically and environmentally benign alternative to cellulose. As far as the application of the current process is concerned, it is limited to animal sources which provide currently very small amounts of glycogen. However, starving cyanobacteria of nitrogen might soon become a viable source of glycogen, providing a cheap and renewable source of glycogen.50References
- A. Zhou and E. Thomson, Appl. Energy, 2009, 86, S11 CrossRef.
- J. Rupprecht, J. Biotechnol., 2009, 142, 10 CrossRef CAS.
- J. R. Mielenz, Curr. Opin. Microbiol., 2001, 4, 324 CrossRef CAS.
- H. Chen and W. Qiu, Biotechnol. Adv., 2010, 28, 556 CrossRef CAS.
- G. C. Dismukes, D. Carrieri, N. Bennette, G. M. Ananyev and M. C. Posewitz, Curr. Opin. Biotechnol., 2008, 19, 235 CrossRef CAS.
- A. Demirbas, Energy Convers. Manage., 2008, 49, 2106 CrossRef CAS.
- H. Fukuda, A. Kondob and S. Tamalampudi, Biochem. Eng. J., 2009, 44, 2 CrossRef CAS.
- Y. Kang Ong and S. Bhatia, Energy, 2010, 35, 111 CrossRef.
- B. Phalan, Appl. Energy, 2009, 86, S21 CrossRef CAS.
- M. A. das Neves, T. Kimura, N. Shimizu and M. Nakajima, Dyn. Biochem., Process Biotechnol. Mol. Biol., 2007, 1, 1 Search PubMed.
- H. V. Amorim, M. L. Lopes, J. V. Castro Oliveira, M. S. Buckeridge and G. H. Goldman, Appl. Microbiol. Biotechnol., 2011, 91, 1267 CrossRef CAS.
- S. Nitayavardhana, P. Shrestha, M. L. Rasmussen, B. P. Lamsal, J. (Hans) van Leeuwen and S. K. Khanal, Bioresour. Technol., 2010, 101, 2741 CrossRef CAS.
- P. Alvira, E. Tomás–Pejó, M. Ballesteros and M. J. Negro, Bioresour. Technol., 2010, 101, 4851 CrossRef CAS.
- N. S. Mosier, R. Hendrickson, M. Brewer, N. Ho, M. Sedlak, R. Dreshel, G. Welch, B. S. Dien, A. Aden and M. R. Ladisch, Appl. Biochem. Biotechnol., 2005, 125, 77 CrossRef CAS.
- M. R. Ladisch, M.C. Flickinger and G. T. Tsao, Energy, 1979, 4, 263 CrossRef CAS.
- B. B. Hallac, P. Sannigrahi, Y. Pu, M. Ray, R. J. Murphy and A. J. Ragauskas, J. Agric. Food Chem., 2009, 57, 1275 CrossRef CAS.
- F. Jiang, Q. Zhu, D. Ma, X. Liu and X. Han, J. Mol. Catal. A: Chem., 2011, 334, 8 CrossRef CAS.
- A. Demirabaş, Energy Sources, 2005, 27, 327 CrossRef.
- J. Pang, A. Wang, M. Zheng and T. Zhang, Chem. Commun., 2010, 46, 6935 RSC.
- S. Van de Vyver, L. Peng, J. Geboers, H. Schepers, F. de Clippel, C. J. Gommes, B. Goderis, P. A. Jacobs and B. F. Sels, Green Chem., 2010, 12, 1560 RSC.
- V. Varatharajan, R. Hoover, J. Li, T. Vasanthan, K. K. M. Nantanga, K. Seetharaman, Q. Liu, E. Donner, S. Jaiswal and R. N. Chibbar, Food Res. Int., 2011, 44, 2594 CrossRef CAS.
- Q. Jin, H. Zhang, L. Yan, L. Qu and H. Huang, Biomass Bioenergy, 2011, 35, 4158 CrossRef CAS.
- A. A. Shatalov and H. Pereira, Carbohydr. Polym., 2012, 87, 210 CrossRef CAS.
- Y. Xue, J. Rusli, H. Chang, R. Philips and H. Jameel, Appl. Biochem. Biotechnol., 2011, 166, 839 CrossRef.
- S. Nikolić, L. Mojović, M. Rakin, D. Pejin and D. Savić, Chem. Ind. Chem. Eng. Q., 2008, 14, 231 CrossRef.
- A. Parmar, N. K. Singh, A. Pandey, E. Gnansounou and D. Madamwar, Bioresour. Technol., 2011, 102, 10163 CrossRef CAS.
- C. Sasaki, R. Takada, T. Watanabe, Y. Honda, S. Karita, Y. Nakamura and T. Watanabe, Bioresour. Technol., 2011, 102, 9942 CrossRef CAS.
- Y. Paivi, F. C. Johan and T. J. Mohammad, J. Biotechnol., 2011, 156, 22 CrossRef.
- M. O. S. Dias, M. P. Cunha, C. D. F. Jesus, R. F. Maciel and A. Bonomi, Bioresour. Technol., 2011, 102, 8964 CrossRef CAS.
- A. K. Chandel, C. ES, R. Rudravaram, M. L. Narasu, L. V. Rao and P. Ravindra, Biotechnol. Mol. Biol. Rev., 2007, 2, 14 Search PubMed.
- M. Eyidogan, A. Necati Ozsezen, M. Canakci and A. Turkcan, Fuel, 2010, 89, 2713 CrossRef CAS.
- C. A. Cardona and Ó. J. Sánchez, Bioresour. Technol., 2007, 98, 2415 CrossRef CAS.
- B. Palmarola–Adrados, P. Chotěborska, M. Galbe and G. Zacchi, Bioresour. Technol., 2005, 96, 843 CrossRef.
- M. Linde, M. Galbe and G. Zacchi, Bioresour. Technol., 2008, 99, 6505 CrossRef CAS.
- Y. Sun and J. Cheng, Bioresour. Technol., 2002, 83, 1 CrossRef CAS.
- D. Yamaguchi and M. Hara, Solid State Sci., 2010, 12, 1018 CrossRef CAS.
- N. S. Mosier, C. M. Ladisch and M. R. Ladisch, Biotechnol. Bioeng., 2002, 79, 610 CrossRef CAS.
- D. L. Nelson, M. M. Cox, 2001. Carbohydrates and glycobiology – polysaccharides, in: Lehninger principles of biochemistry, 4th Edition, W. H. Freeman, pp. 247–255 Search PubMed.
- M. Koberg, R. Abu–Much and A. Gedanken, Bioresour. Technol., 2011, 102, 1073 CrossRef CAS.
- Y. Groisman and A. Gedanken, J. Phys. Chem. C, 2008, 112, 8802 CAS.
- P. Klan, M. Hajek and V. Cirkva, J. Photochem. Photobiol., A, 2001, 140, 185 CrossRef CAS.
- N. A. Rahman and J. Jahim, Mod. Appl. Sci., 2008, 2, 151 CAS.
- A. Madhavan, A. Srivastava, A. Kondo and V. S. Bisaria, Crit. Rev. Biotechnol., 2012, 32, 22 CrossRef CAS.
- K. Okamoto, R. Kanawaku, M. Masumoto and H. Yanase, Enzyme Microb. Technol., 2012, 50, 96 CrossRef CAS.
- L. Kupiainen, J. Ahola and J. Tanskanen, Chem. Eng. Res. Des., 2011, 89, 2706 CrossRef CAS.
- J. Qi and L. Xiuyang, Chin. J. Chem. Eng., 2008, 16, 890 CrossRef.
- S. V. Vyver, J. Thomas, J. Geboers, S. Keyzer, M. Smet, W. Dehaen, P. A. Jacobs and B. F. Sels, Energy Environ. Sci., 2011, 4, 3601 Search PubMed.
- A. S. Amarasekhara and C. C. Ebede, Bioresour. Technol., 2009, 100, 5301 CrossRef.
- C. Chun, M. A. Xiaogian and C. Peilin, Chin. J. Chem. Eng., 2006, 14, 708 CrossRef.
- S. Aikawa, Y. Izumi, F. Matsuda, T. Hasunuma, J. S. Chang and A. Kondo, Bioresour. Technol., 2012, 108, 211 CrossRef CAS.
Footnote |
| † Electronic Supplementary Information (ESI) available. See DOI: 10.1039/c2ra21066e/ |
| This journal is © The Royal Society of Chemistry 2012 |

