DOI:
10.1039/C2RA21017G
(Paper)
RSC Adv., 2012,
2, 6784-6791
Fabrication and CO2 adsorption performance of bimodal porous silica hollow spheres with amine-modified surfaces
Received
23rd May 2012
, Accepted 23rd May 2012
First published on 25th May 2012
Abstract
Carbon dioxide capture and storage (CCS) solutions have received enormous attention because CO2 is a primary greenhouse gas and plays a key role in global warming and climate change. In this work, bimodal meso-/macroporous SiO2 hollow sphere (BMSHS) samples with high specific surface areas were prepared by a hydrothermal method. Cetyltrimethylammonium bromide (CTAB) and perfluorododecanoic acid (PFDOA) were used as cotemplates and the CTAB/PFDOA weight ratio (R) was varied. The prepared samples were further modified with tetraethylenepentamine (TEPA), and characterized by X-ray diffraction (XRD), transmission electron microscopy (TEM), Fourier-transform infrared (FTIR), X-ray photoelectron spectroscopy (XPS), differential thermal analysis (DTA), thermal gravimetric analysis (TGA), and N2 physisorption techniques. This was followed by CO2 capture tests using a pure CO2 stream in the temperature range of 35–130 °C. The results showed that all of the prepared samples contained small mesopores with a peak pore size of ca. 3–4 nm and larger mesopores or macropores with a peak pore diameter of ca. 103 to 117 nm. The mesopores and macropores are from the shell and the cavity of hollow spheres, respectively. The R exhibited a significant influence on the specific surface area, as the specific surface areas increased with increasing R. All of the TEPA-modified samples exhibited good CO2 adsorption abilities, which were related to the amount of loaded TEPA, adsorption temperature, and the specific surface areas of the samples. A optimal amount of TEPA loading (about 50 wt%) and adsorption temperature (about 110 °C) were determined. The CO2 adsorption amount increased proportionally with the specific surface area. The maximum CO2 adsorption amount (4.41 mmol g−1 adsorbent) was achieved on the BMSHS sample prepared at R = 40 and TEPA loading of 50 wt%. The present study provides new insight into the design and synthesis of novel porous materials for CO2 capture.
1. Introduction
Carbon dioxide capture and storage (CCS) from large point sources such as power plants have received increasing more attention because of its key role in global warming and climate change as it is a primary greenhouse gas.1,2 Various novel technologies and materials have been used to capture and store CO2.1–3 One of the main processes used for the capture of industrially produced CO2 is the use of amine baths. This type of CO2 scrubbing is also used in life support systems in confined spaces including submarines, space vehicles, and other inhabited vessels for space exploration platforms.4 However, this industrial process for CO2 capture using amines has several obvious disadvantages, such as solvent degradation, corrosion, and foaming.5 Replacement of CO2 absorption in liquid amine baths to CO2 adsorption on amine-functionalized solids may be an interesting way to overcome these disadvantages.6
Recently, many investigations have indicated that CO2 adsorption of solid sorbent materials is one promising and important method for CO2 capture.7–9 Especially, aqueous amines immobilized in or on mesoporous silica adsorbents have attracted considerable attention due to their high efficiency and selectivity for CO2 capture from a gas mixture.2,7 In this regard, ordered mesoporous silica materials offer excellent structural characteristics such as large pore size, high surface area, and many highly dispersed active sites on the pore surface. These facilitate the distribution of amines throughout the pore space, thereby enhancing the CO2 adsorption capacity of the adsorbents.8,9 Leal et al.10 may have been the first to functionalize the surface of silica with an aminosilane for its use in the adsorption of CO2. After that, further work was performed to investigate the adsorption of CO2 on the surface of amine-functionalized materials using different techniques and different amine molecules. For example, in situ infrared investigations provided new insights into the reaction mechanisms between CO2 and amine site on functionalized silica and the formation of carbamate and carbonate species.10–16 Usually, there are two main amine-functionalized methods to obtain the supported amine sorbents:2,9 (i) porous solids impregnated with liquid organic polymer such as poly(ethyleneimine) (PEI) by a wet impregnation method and (ii) amines that are covalently linked to a porous support via the use of silane chemistry. “Wet impregnation” of mesoporous silica with amines may be a facile method to obtain a high capacity adsorbent.
In recent years, solid materials with hierarchically multimodal pore-size distributions have attracted enormous attention,17–20 because they combine the benefits of high surface area micro- and mesoporosity with the accessible diffusion pathways of macroporous networks and play key roles in industrial processes, from catalysis and catalytic supports to pollutant adsorption and purification.19,20 The controlled synthesis and self-assembly of hierarchically porous materials such as crystalline oxide semiconductors, amorphous silica, and elemental carbon should therefore lead to higher separation and catalytic efficiency and new applications in large-molecule catalysis, biomolecule separations, miniaturization of electronic devices, and chromatographic supports.21–23 Furthermore, the type of porous silica materials has been found to play a vital role in the CO2-capture performance of these adsorbents. Thus, various mesoporous silica solid powders such as MCM-41,8,24 MCM-48,15,25 pore expanded MCM-41,26 SBA-12,27 SBA-15,28 SBA-16,29 HMS,30 mesoporous silica microspheres,31 and mesocellular silica foam32 were investigated for CO2 adsorption. However, to the best of our knowledge, there are no reports of CO2 adsorption on bimodal mesoporous silica hollow spheres with amine-modified surfaces.
Herein, we present a simple and effective strategy to fabricate bimodal mesoporous silica hollow spheres using CTAB and PFDOA as cotemplates by varying the CTAB/PFDOA weight ratio followed by their surface amine modification. The as-prepared samples exhibit a unique hollow spherical morphology, relatively high surface area, and bimodal porous structures. Experimental studies of their performance as adsorbents for CO2 capture from a pure CO2 stream showed that they are very promising materials for CO2 adsorption.
2. Experimental
2.1. Preparation
All reagents used in the experiments were analytical grade. Perfluorododecanoic acid (PFDOA) was purchased from Alfa Aesar, and all other reagents were from Shanghai Chemical Reagent Co, China and used without further purification. Distilled water was used for all synthesis and treatment processes.
Preparation of bimodal meso-/macroporous SiO2 hollow sphere (BMSHS).
BMSHS samples were prepared according to the method reported previously by Yu et al.33 CTAB and PFDOA were used as cotemplates and their weight ratio (R) was varied. Typically, 0.2 g of CTAB was dissolved in 96 mL of distilled water with stirring at room temperature. Aqueous NaOH solution (0.7 mL, 2 M) and a given amount of PFDOA (0.04 g) were then added to the solution (R = 5). The temperature of the solution was raised and kept at 80 °C. To this solution, tetraethyl orthosilicate (TEOS, 1.34 mL) was added. The mixture was continuously stirred for an additional 2 h. The resulting products were collected by filtration and dried at room temperature. The templates were removed by calcination at 550 °C for 5 h. The samples were also prepared at R = 20 and 40. The above prepared samples were labeled as R5, R20 and R40 (see Table 1).
Table 1 Textural properties of the BMSHS samples
| Samples |
d
100 (nm) |
S
BET (m2/g) |
APSa (nm) |
PVa (cm3/g) |
Porosity (%) |
|
APS: Average pore size; PV: Pore volume.
|
| R5 |
4.2 |
436 |
4.4 |
0.48 |
52.7 |
| R20 |
4.2 |
892 |
4.4 |
0.97 |
69.2 |
| R40 |
4.9 |
923 |
3.7 |
0.86 |
66.6 |
Surface amine modification of BMSHS samples.
The amine-modified BMSHS samples were prepared by a wet impregnation method. A given amount of tetraethylenepentamine (TEPA) was dissolved in 10 g of ethanol under stirring for 0.5 h, and then 0.2 g of R5, R20 or R40 samples were separately added into the TEPA ethanol solution, and the solution was kept at 80 °C. After stirring for 2 h, the samples were centrifuged and evaporated at 80 °C for 6 h. These amine-modified samples were labled as R5-n, R20-n or R40-n, where n represents the weight percentage of TEPA in the sample.
2.2 Characterization
Low angle powder X-ray diffraction (XRD) patterns were obtained on a D/Max-RB X-ray diffractometer (Rigaku, Japan) with Cu-Kα radiation (λ = 0.15418 nm) at a scan rate (2θ) of 0.05° s−1. The accelerating voltage and the applied current were 40 kV and 80 mA, respectively. Transmission electron microscopy (TEM) observation was conducted using a JEM-2100F electron microscope (JEOL, Japan) at an accelerating voltage of 200 kV. The Brunauer–Emmett–Teller (BET) specific surface areas (SBET) and porous structures of the samples were analyzed by a Micromeritics ASAP 2020 nitrogen adsorption apparatus (USA). All of the samples were degassed at 180 °C before nitrogen adsorption measurements. The SBET was determined by a multipoint BET method using the adsorption data in the relative pressure (P/P0) range of 0.05–0.3. The nitrogen adsorption volume at the relative pressure (P/P0) of 0.99 was used to determine the pore volume (VP). The results are listed in Table 1. The desorption isotherm was used to determine the pore size distribution via the Barret–Joyner–Halender (BJH) method, assuming a cylindrical pore modal. FTIR spectra were collected using a Shimadzu IRAffinity-1 FTIR spectrometer in the frequency range of 4000–500 cm−1. X-Ray photoelectron spectroscopy (XPS) measurement was performed in an ultrahigh vacuum VG ESCALAB 210 electron spectrometer equipped with a multichannel detector. The spectra were excited using Mg-Kα (1253.6 eV) radiation (operated at 200 W) of a twin anode in the constant analyzer energy mode with a pass energy of 30 eV. The thermal chemical and physical properties of the amine-modified R40-50 were characterized by differential thermal analysis (DTA) and thermal gravimetric analysis (TGA). The DTA-TGA was performed on a DTG-60H analyzer (Shimadzu Corp., Tokyo, Japan). About 10 mg of the sample was heated at 10 °C min−1 to 600 °C in air.
2.3 CO2 adsorption measurements
The adsorption of CO2 on the BMSHS samples was measured using a Chemisorb 2720 pulse chemisorption system (Micromeritics, USA) according to our previously reported method.34,35 Prior to the adsorption analysis, the samples (around 50–100 mg) were activated by heating in carrier gas (He) at 100 °C for 0.5 h to remove preadsorbed CO2 and water, then cooled down to 35 °C. Then, the carrier gas was stopped and the introduced CO2 was allowed to come into contact with the adsorbent for 3 h. When the adsorption process was finished, the temperature of the reactor was decreased to 35 °C while purging the sample with a He flow. In general, the purge process continued for about 20 min, and then CO2 Temperature Programmed Desorption (TPD) was performed at a rate of 5 °C min−1 to 150 °C. The CO2 adsorption experiments were performed at the four temperatures: 35, 75, 110 and 130 °C.
3. Results and discussion
3.1 Textural properties
3.1.1 Nitrogen adsorption isotherms.
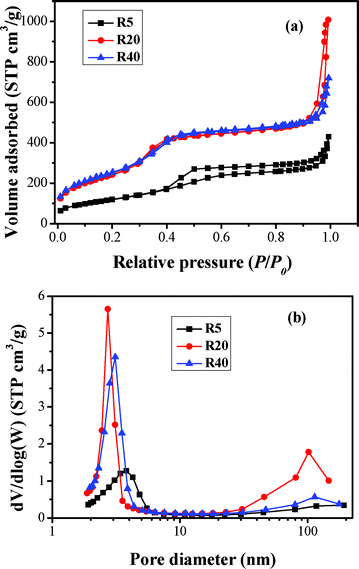
The porous structures and BET surface areas of the as-prepared samples were investigated based on nitrogen sorption measurements. The effect of R on nitrogen adsorption isotherms and the corresponding pore size distributions of BMSHS samples are shown in Fig. 1. The structural parameters derived from these isotherms are summarized in Table 1. According to the Brunauer–Deming–Deming–Teller (BDDT) classification, All isotherms in Fig. 1a are Type IV, which refers to mesoporous materials.34–37 Furthermore, the isotherms have two hysteresis loops, indicating a bimodal pore size distribution in the mesoporous and macroporous regions.38 The shapes of the two hysteresis loops are different from each other. At low relative pressure between 0.3 and 0.7, the hysteresis loops are type H1, suggesting the presence of cylindrical mesopores.34 However, at high relative pressures between 0.9 and 1.0, the shape of the hysteresis loops are type H3, implying the presence of slitlike pores.36,37 For the R20 and R40 samples, the isotherms exhibit high adsorption at the low relative pressure range of 0–0.2, indicating that the powders contain a small amount of micropores (type I).
 |
| | Fig. 1 Nitrogen sorption isotherms (a) and the corresponding pore size distribution curves (b) for the R5, R20 and R40 samples. | |
The above bimodal pore-size distributions are further confirmed by their corresponding pore-size distribution in Fig. 1b. The R5, R20 and R40 samples contain small mesopores (peak pores at 3.8, 2.8 and 3.1 nm, respectively) and larger mesopores or macropores with peak pore diameters at ca. 117, 103 and 114 nm, respectively. The R exerts an obvious influence on the pore structure and BET surface area of the obtained samples (see Table 1). With increasing R, the shapes of nitrogen adsorption and desorption isotherms show two obvious changes, implying a great variation in the specific surface areas and pore structures. Firstly, with increasing R, the isotherms shift upwards, implying an increase in the specific surface area. Secondly, the isotherms corresponding to the samples obtained at R = 20 and 40 show higher absorption at high relative pressure (P/P0) range (approaching 1), indicating the formation of more macropores and/or the increase of their pore volume.
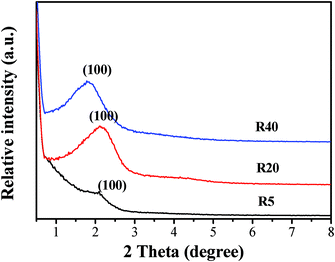
3.1.2 XRD results.
The small-angle XRD patterns in Fig. 2 indicate the presence of uniform mesoporosity. It is well-known that the diffraction patterns at small angles provide information about the possible organization of mesopores.34,39 As can be seen in Fig. 2, the small-angle XRD patterns for the samples studied exhibit one peak at 2θ between 1.5° and 2.5°. This indicates the presence of uniform mesopores, which may be ordered or wormlike. The increasing intensity of the small-angle peaks recorded for R20 and R40 indicates the direction of the mesostructure enhancement.
 |
| | Fig. 2 Low-angle XRD patterns for the R5, R20 and R40 samples after calcination. | |
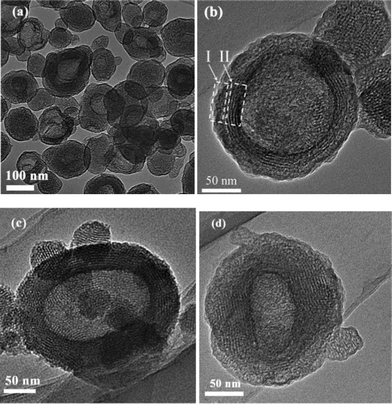
3.1.3 TEM images.
The morphology and textural properties of the samples was further investigated by TEM and high-resolution TEM (HRTEM). Fig. 3 exhibits TEM and HRTEM images of the R5 and R40 samples. It can be seen from Fig. 3 that the particles have an ellipsoidal morphology. The length of the particles is in the range of about 100–250 nm, and the width ranges from about 80 to 230 nm. The difference in electron-density between the dark edge and pale centre clearly confirms the presence of a core–shell structure and a hollow interior. Further observation of Fig. 3b, c and d indicates the presence of domains with ordered channel-like mesopores, which is in good agreement with the intense XRD peak at small angles (Fig. 2). The HRTEM images show that the channels are uniform, and they correspond to the pore width (ca. 3 nm) obtained from the above adsorption data. The particles possess complex core–shell structures. Within each ellipsoidal structure, the hollow cavity is surrounded by dual-structured walls. This dual-wall structure can be observed in Fig. 3b and d, and indicated by arrows and rectangle frames). Region I at the outer shell shows an almost amorphous region, and region II at the inner shell edge shows a multilamellar structure and a nearly hexagonally arrayed mesostructure viewed along the [110] direction. In this case, the observed results are slightly different from that reported by Yang et al.33 The d spacing is estimated to be 3.9 nm, in accordance with the XRD results. Consequently, it is not surprising that the prepared BMSHS samples contain mesopores of ca. 3–4 nm in the shell of hollow core–shell structures and macropores of 103–117 nm in the core.
 |
| | Fig. 3 TEM images of the R5 (a and b) and R40 (c and d) samples after calcination. | |
3.2 Surface amine modification
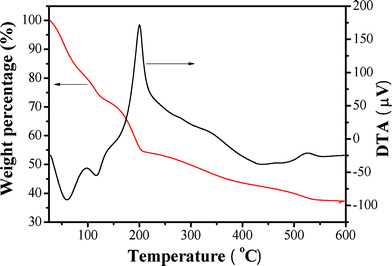
3.2.1 DTA-TGA analysis
The amount of TEPA loaded into the porous silica hollow spheres by the impregnation method described above was measured by thermogravimetry. Fig. 4 reveals DTA and TGA curves of a TEPA-modified R40-50 sample. From the DTA curve, three main exothermic peaks at ca. 200, 350 and 527 °C and two small endothermic peaks at ca. 60 and 117 °C could be seen, corresponding to five weight loss regions in the TGA curve. The first two endothermic peaks occur at about 60 and 117 °C, respectively. This is attributed to desorption of moisture, CO2 and TEPA. In the temperature range of 120–600 °C, three exothermic peaks appear at about 200, 350 and 527 °C. These are ascribed to the combustion of the organic materials. The total weight loss is about 63.6% in the temperature range of 23–600 °C. If the adsorbed moisture and CO2 are excluded from the total weight loss, the loading of TEPA on the R40-50 sample could be estimated at about 50 wt%. The TGA result suggests that virtually identical amounts of TEPA are loaded into the mesoporous silica hollow spheres and apparently no significant TEPA loss occurs during the impregnation process.9
 |
| | Fig. 4 DTA and TGA profiles of TEPA-modified R40-50 sample. | |
3.2.2 FTIR analysis.
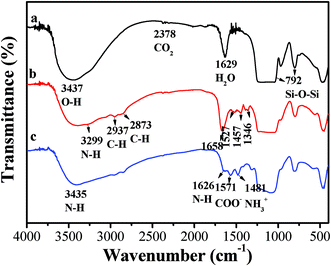
FTIR was used to investigate surface amine modification of the samples. The IR spectra of all unmodified and modified samples were similar, therefore only the IR spectra of representative unmodified R40 and a TEPA-modified R40 sample are presented in Fig. 5. The unmodified R40 sample exhibited a strong FTIR band at around 3437 cm−1. This band could be assigned to the O–H stretching vibrations of the hydrogen-bonded silanol groups and adsorbed water molecules. Another strong band located at 1629 cm−1 was attributed to adsorbed water (Fig. 5a). These two strong IR bands suggests that the prepared sample contained a large amount of hydroxyl groups due to its high BET surface areas. After TEPA loading, the band at 3437 cm−1 corresponding to O–H bending was still observed in the IR spectra, but its intensity decreases greatly (Fig. 5b). This indicates that the surface hydroxyl groups of R40 samples reacted with the amine groups in TEPA possibly forming Si–O−N+H3R and/or Si–O−N+H2R2 groups.9,40 However, the band at 1629 cm−1 corresponding to adsorbed water was not observed in the IR spectra (Fig. 5b), suggesting that the adsorbed water was completely substituted by TEPA. It also implies a high loading of TEPA in the R40 sample due to its special hollow core–shell structure. Additionally, a small band at about 2378 cm−1 was observed in the spectra, which is assigned to a stretching vibration of gaseous CO2.6
 |
| | Fig. 5 FTIR spectra for unmodified R40 (a), TEPA-modified R40-50 (b) and TEPA-modified R40-50 after the adsorption of CO2 (c). | |
Some additional bands could be clearly observed in the FTIR spectra of the modified R40 sample (Fig. 5b) compared to that of the unmodified R40 sample. The broad band appearing at 3299 cm−1 could be attributed to amine N–H stretching vibrations. Two distinctly new bands appeared at 2937 and 2873 cm−1, which were due to the CH2 stretching modes of the TEPA chains. Two other IR bands appeared at 1527 and 1457 cm−1, which could be characteristics of the asymmetric and symmetric bending of primary amines (NH2), respectively. The bands observed at 1658 cm−1 in the Fig. 5b were assigned to the bending of secondary amines [N(R)H] in TEPA.9,41 In addition, the bands at 1390 and 1346 cm−1 could be ascribed to NCOO skeletal vibration.9,42
For the adsorption of CO2 on a pure silica sample (such as R40), only physisorption takes place. CO2 is only weakly adsorbed due to electrostatic interactions,6 and no bond or carbonate formation with the silica surface takes place. Therefore, it is not surprising that no obvious bands were observed in the 1800–1000 cm−1 region of the corresponding IR spectrum (not shown here). However, for TEPA-modified R40 samples, which contain primary amines (RNH2) and secondary amines (R2NH), both amines can react with CO2 and lead to the formation of a carbamate ion by following reactions 1 and 2. The presence of water then regenerates amine molecules by reactions 3 and 4.9,11,42,43
| | | CO2 + 2RNH2 ↔ RNHCOO− + RNH3+ | (1) |
| | | CO2 + 2R2NH ↔ R2NCOO− + R2NH2+ | (2) |
| | | RNHCOO− + H2O ↔ RNH2 + HCO3− | (3) |
| | | R2NCOO− + H2O ↔ R2NH + HCO3− | (4) |
In the presence of water, the amine groups can also directly react with CO
2 and H
2O to form bicarbonate ion (HCO
3−), as shown in
reactions 5 and
6.
9,12,43,44| | | CO2 + H2O + RNH2 ↔ HCO3− + RNH3+ | (5) |
| | | CO2 + H2O + R2NH ↔ HCO3− + R2NH2+ | (6) |
where R was an alkyl group and CO
2 could also react with H
2O to produce HCO
3− and CO
32−.
It is well-known that adsorbents based on high surface area inorganic supports incorporating basic organic groups, usually amines, are of particular interest. The interaction between the basic surface and acidic CO2 molecules is thought to result in the formation of surface ammonium carbamates under anhydrous conditions and the formation of ammonium bicarbonate and carbonate species in the presence of water, as given in Scheme 1. Similar to the amine absorption process, the CO2 adsorption capacity is 0.5 mol CO2/mol surface-bound amine group in the absence of water, and 1.0 mol CO2/mol surface-bound amine in the presence of water. This is because in the absence of water one CO2 molecule interacts with two amine sites and in the presence of water one CO2 molecule interacts with one amine site.45 In the infrared spectra (Fig. 5c) of the amine-modified R40 sample after the adsorption of CO2, the presence of carbamate is further confirmed by bands corresponding to the N–H stretching (3435 cm−1), the N–H bending (1626 cm−1), the COO− asymmetric stretching vibration (∼1571 cm−1), and the NH3+ bending (∼1481 cm−1).6
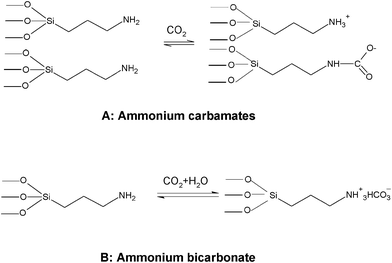 |
| | Scheme 1 Surface reaction of amine groups with CO2; (A): formation of surface ammonium carbamates under anhydrous conditions and (B) the formation of ammonium bicarbonate and carbonate species in the presence of water. | |
3.2.3 XPS analysis.
XPS measurements were performed to further elucidate the interaction between TEPA and SiO2 hollow spheres. As expected, the XPS survey spectra (Fig. 6a) indicate that the unmodified R40 sample contained Si, C and O elements, with sharp XPS peaks centered at binding energies of 102.5 (Si 2p), 152.7 (Si 2s), 285 (C 1s) and 532 eV (O 1s). After TEPA modification, a new XPS peak appears at 399 eV (see Fig. 6a), suggesting the presence of N in the samples. To further analyze the chemical nature of N, we examined the N 1s region in a high-resolution XPS spectrum (Fig. 6b). The asymmetrical and broad features of N 1s XPS peaks suggest the coexistence of distinguishable models. A Gaussian curve fitting was shown in Fig. 6b, suggesting two chemically variant N species in the composite sample, with their N 1s binding energies at about 399.5 and 398.5 eV, corresponding to primary amines (RNH2) and secondary amines (R2NH), respectively.
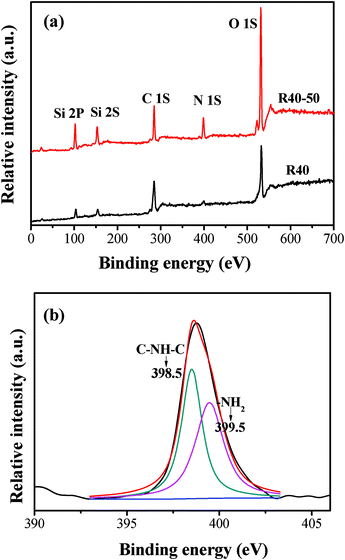 |
| | Fig. 6 XPS survey spectra (a) of R40 and R40-50 samples and high-resolution XPS spectra of N 1s (b) for the R40-50 sample. | |
3.3 CO2 adsorption properties
The adsorption behavior of CO2 on TEPA-modified BMSHS (R = 5, 20 and 40) surfaces was investigated by TPD of CO2. The typical CO2-TPD profiles for R40 and R40-50 are shown in Fig. 7, and the total amounts of chemisorbed CO2 derived from CO2-TPD profiles are in Table 2, 3 and 4. Each CO2-TPD profile possesses two obvious peaks around 82 and 91 °C for R5, R20 and R40 samples (not shown here). This is easy to understand because TEPA contains two kinds of amines (i.e., primary amines (RNH2) and secondary amines (R2NH)), and their adsorption energy for CO2 is slightly different.6Fig. 7 also indicates that the adsorbed CO2 can be completely desorbed from the sample surface on heating the samples to 115 °C.
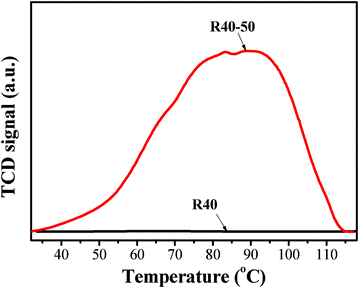 |
| | Fig. 7 CO2-TPD profiles for R40 and R40-50 samples. | |
Table 2 Effects of loaded TEPA on the CO2 adsorption capacity of the R40 sample
| Samples |
TEPA (wt%) |
Adsorption temperature (°C) |
Adsorption capacity (mmol g−1) |
| R40-0 |
0 |
75 |
0.009 |
| R40-10 |
10 |
75 |
1.11 |
| R40-20 |
20 |
75 |
1.49 |
| R40-50 |
50 |
75 |
3.86 |
| R40-70 |
70 |
75 |
2.80 |
Table 3 Effects of adsorption temperatures on the CO2 adsorption capacity of the R40-50 sample
| Samples |
TEPA (wt%) |
Adsorption temperature (°C) |
Adsorption capacity (mmol g−1) |
| R40-50 |
50 |
35 |
2.93 |
| R40-50 |
50 |
75 |
3.86 |
| R40-50 |
50 |
110 |
4.41 |
| R40-50 |
50 |
130 |
3.16 |
Table 4 Effects of R on the CO2 adsorption capacity of the samples
| Samples |
R
|
TEPA (wt%) |
Adsorption temperature (°C) |
Adsorption capacity (mmol g−1) |
| R5-50 |
5 |
50 |
110 |
2.70 |
| R20-50 |
20 |
50 |
110 |
3.15 |
| R40-50 |
40 |
50 |
110 |
4.41 |
Table 2 presents the influence of loaded TEPA on the CO2 adsorption capacity of the composites. R40 alone has a low CO2 adsorption capacity of 0.009 mmol g−1. After loading TEPA, the adsorption capacity of R40-10 and R40-20 increases substantially, reaching 1.11 and 1.49 mmol g−1, respectively. When the loading amount of TEPA reaches to 50 wt%, the R40-50 sample exhibits a CO2 adsorption capacity (3.86 mmol g−1) higher than that of pure TEPA (3.43 mmol g−1). This is due to the synergistic effect of TEPA and R40, similar to the behavior previously observed for PEI-modified MCM-41 and TEPA-modified SBA-15.8,28i The high surface area and bimodal mesoporous and macroporous structures of BMSHS lead to a good dispersion of TEPA, and thus more CO2 affinity sites are exposed to the adsorbate. The inherent affinity of TEPA for CO2 along with the good dispersion of TEPA in the R40 sample synergistically increases the adsorption capacity of the composite. Another possible explanation is the layering of CO2 molecules within the pores. Recent work by Ho et al.46 showed that enhanced CO2 solubility can be observed when physical solvents (N-methyl-2-pyrrolidone) are confined in mesoporous solids (MCM-41, alumina). They found that the presence of solvent molecules favors the layering of CO2 molecules within the pores; therefore, the CO2 solubility in the hybrid adsorbent markedly increases in comparison to that found in the raw adsorbent as well as in the bulk solvent. However, when TEPA loading increases to 70 wt% in the R40 sample, the adsorption capacity of R40-70 decreases to 2.80 mmol g−1. This is probably because the pores of R40-50 are filled with TEPA, and further TEPA loading only coats the external surface of the sample. This then inhibits the entry of CO2 to the pores, and thus the adsorption capacity of R40-70 decreases in comparison to R40-50.
Table 3 lists the influence of adsorption temperature on the CO2 adsorption capacity of the R40-50 sample. This composite adsorbs more CO2 (4.41 mmol g−1) at 110 °C than at 35 (2.93 mmol g−1) and 75 °C (3.86 mmol g−1). It should be noted that the adsorption of CO2 in the TEPA-modified R40 sample is an exothermic process, and thus the composite should exhibit a higher adsorption capacity at lower temperatures. This is because the adsorption of CO2 within the R40-50 sample proceeds more slowly at 35 and 75 °C due to the diffusion limitations reported by the other literature.28i This indicates that the adsorption of CO2 in TEPA-modified R40 is kinetically controlled, just like in TEPA-modified SBA-15, and the diffusion of CO2 is the key factor governing adsorption over short periods of time.28i At low temperatures, only the CO2 affinity sites on the surface of the TEPA particles can readily react with CO2 and diffusion limitations prevent CO2 from coming into contact with sites inside the TEPA particles or sites embedded in the mesopores and the interior of hollow core–shells. High temperatures enable CO2 molecules to possess a larger kinetic energy, so that they can easily penetrate into the TEPA particles and the mesopores and the interior of hollow particles, and are thus able to come into contact with more affinity sites.28i
Usually each mole of the amine reacts with 0.5 moles of CO2 to form the carbamate without water. However, in the presence of H2O, one mole of the amine reacts with one mole of CO2. The same TEPA loading should thus result in almost the same CO2 adsorption capacity. However, the loading amount of TEPA is not the only factor influencing the CO2 adsorption, other factors also influence the adsorption capacity of CO2. Table 4 lists the CO2 adsorption capacities of the R5, R20 and R40 samples modified with the same amount of TEPA. Interestingly, the three samples possess different CO2 capture abilities. With increasing R, the adsorption capacity of CO2 increases. This is easy to understand because the specific surface areas of the samples increase with increasing R. The high specific surface area favors the dispersion of TEPA in the samples.
4. Conclusions
In conclusion, bimodal meso-/macroporous SiO2 hollow spheres were successfully prepared by a hydrothermal method using CTAB and PFDOA as cotemplates, which were then functionalized with TEPA. All of the prepared samples contained small mesopores with peak pores at ca. 3–4 nm and larger mesopores or macropores with a peak pore diameter at ca. 103 to 117 nm. The mesopores and macropores are found in the shell and the cavity of hollow spheres, respectively. The CTAB/PFDOA weight ratio R exhibited a significant influence on specific surface areas; with increasing R, the specific surface areas increase. All of the TEPA-loaded samples exhibited good CO2 adsorption abilities. The results indicated that the CO2 adsorption capacity was dependent on the adsorption temperature and the specific surface areas of the samples. As the adsorption temperature increased from 35 to 110 °C, more CO2 was adsorbed. The CO2 adsorption amount increased proportionally with the specific surface areas. The loading amount of TEPA also influence the CO2 adsorption capacity of the composites and a optimal amount (about 50 wt%) was determined. The maximum CO2 adsorption amount (4.41 mmol g−1 adsorbent) was achieved on the R40-50 sample. The present study opens new avenues for the utilization of co-templates used for the fabrication of bimodal mesoporous and macroporous materials. Furthermore, it also sheds light on the design and synthesis of novel materials for capturing CO2.
Acknowledgements
This work was partially supported by the 863 Program (2012AA062701), NSFC (51072154 and 21177100), 973 Program (2009CB939704) and the Natural Science Foundation of Hubei Province (2010CDA078). Also, this work was financially supported by the Fundamental Research Funds for the Central Universities and Self-determined and Innovative Research Funds of SKLWUT
References
-
(a) D. M. D'Alessandro, B. Smit and J. R. Long, Angew. Chem., Int. Ed., 2010, 49, 6058 CrossRef CAS;
(b) R. V. Siriwardane and R. W. Stevens, Ind. Eng. Chem. Res., 2008, 48, 2135 CrossRef.
- S. Choi, J. H. Drese and C. W. Jones, ChemSusChem, 2009, 2, 796 CrossRef CAS.
- S. C. Lee, H. J. Chae, S. J. Lee, B. Y. Choi, C. K. Yi, J. B. Lee, C. K. Ryu and J. C. Kim, Environ. Sci. Technol., 2008, 42, 2736 CrossRef CAS.
- P. J. E. Harlick and A. Sayari, Ind. Eng. Chem. Res., 2006, 45, 3248 CrossRef CAS.
-
A. Kohl, and R. Nielsen, Gas Purification; Gulf Publishing Co.: Houston, TX, 1997 Search PubMed.
- C. Knofel, C. Martin, V. Hornebecq and P. L. Llewellyn, J. Phys. Chem. C, 2009, 113, 21726 CAS.
- T. L. Chew, A. L. Ahmad and S. Bhatia, Adv. Colloid Interface Sci., 2010, 153, 43 CrossRef CAS.
- X. C. Xu, C. S. Song, J. M. Andresen, B. G. Miller and A. W. Scaroni, Energy Fuels, 2002, 16, 1463 CrossRef CAS.
- X. Yan, L. Zhang, Y. Zhang, G. Yang and Z. Yan, Ind. Eng. Chem. Res., 2011, 50, 3220 CrossRef CAS.
- O. Leal, C. Bolıvar, C. Ovalles, J. JoseGarcıa and Y. Espidel, Inorg. Chim. Acta, 1995, 240, 183 CrossRef CAS.
- N. Hiyoshi, K. Yogo and T. Yashima, Microporous Mesoporous Mater., 2005, 84, 357 CrossRef CAS.
- A. C. C. Chang, S. S. C. Chuang, M. Gray and Y. Soong, Energy Fuels, 2003, 17, 468 CrossRef CAS.
- R. Srivastava, D. Srinivas and P. Ratnasamy, Microporous Mesoporous Mater., 2006, 90, 314 CrossRef CAS.
- R. Srivastava, D. Srinivas and P. Ratnasamy, J. Catal., 2005, 233, 1 CrossRef CAS.
- H. Y. Huang and R. T. Yang, Ind. Eng. Chem. Res., 2003, 42, 2427 CrossRef CAS.
- R. A. Khatri, S. S. C. Chuang, Y. Soong and M. Gray, Energy Fuels, 2006, 20, 1514 CrossRef CAS.
- J. Yu, L. Zhang, B. Cheng and Y. Su, J. Phys. Chem. C, 2007, 111, 10582 CAS.
- S. A. Davis, S. L. Burkett, N. H. Mendelson and S. Mann, Nature, 1997, 385, 420 CrossRef CAS.
-
(a) W. Wang, J. Yu, Q. Xiang and B. Cheng, Appl. Catal. B, 2012, 119–120, 109 CrossRef CAS;
(b) J. Zhou, Y. Cheng, J. Yu and G. Liu, J. Mater. Chem., 2011, 21, 19353 RSC;
(c) P. Madhusudan, J. Ran, J. Zhang, J. Yu and G. Liu, Appl. Catal., B, 2011, 110, 286 CrossRef CAS;
(d) B. Cheng, Y. Le, W. Cai and J. Yu, J. Hazard. Mater., 2011, 185, 889 CrossRef CAS;
(e) J. Zhou, S. Yang, J. Yu and Z. Shu, J. Hazard. Mater., 2011, 192, 1114 CrossRef CAS;
(f) W. Cai, J. Yu, S. Gu and M. Jaroniec, Cryst. Growth Des., 2010, 10, 3977 CrossRef CAS.
-
(a) W. Cai, J. Yu and M. Jaroniec, J. Mater. Chem., 2010, 20, 4587 RSC;
(b) J. Yu, W. Wang and B. Cheng, Chem.–Asian J., 2010, 5, 2499 CrossRef CAS;
(c) X. Yu, J. Yu, B. Cheng and M. Jaroniec, J. Phys. Chem. C, 2009, 113, 17527 CrossRef CAS;
(d) J. Yu and L. Qi, J. Hazard. Mater., 2009, 169, 221 CrossRef CAS;
(e) J. Yu, Y. Su and B. Cheng, Adv. Funct. Mater., 2007, 17, 1984 CrossRef CAS.
- B. Zhang, S. A. Davis and S. Mann, Chem. Mater., 2002, 14, 1369 CrossRef CAS.
- J. Yu, W. Liu and H. Yu, Cryst. Growth Des., 2008, 8, 930 CAS.
- J. Yu, Q. Li, J. Fan and B. Cheng, Chem. Commun., 2011, 47, 9161 RSC.
- Y. Belmabkhout, R. Serna-Guerrero and A. Sayari, Chem. Eng. Sci., 2009, 64, 3721 CrossRef CAS.
-
(a) S. Kim, J. Ida, V. V. Guliants and J. Y. S. Lin, J. Phys. Chem. B, 2005, 109, 6287 CrossRef CAS;
(b) H. T. Jang, Y. K. Park, Y. S. Ko and J. Y. Lee, Int. J. Greenhouse Gas Control, 2009, 3, 545 CrossRef CAS;
(c) M. Bhagiyalakshmi, L. J. Yun, R. Anuradha and H. T. Jang, J. Hazard. Mater., 2010, 175, 928 CrossRef CAS.
-
(a) R. S. Franchi, P. J. E. Harlick and A. Sayari, Ind. Eng. Chem. Res., 2005, 44, 8007 CrossRef CAS;
(b) R. Serna-Guerreroa, Y. Belmabkhoutb and A. Sayari, Chem. Eng. J., 2010, 158, 513 CrossRef.
- V. Zelenak, D. Halamova, L. Gaberova, E. Bloch and P. Llewellyn, Microporous Mesoporous Mater., 2008, 116, 358 CrossRef CAS.
-
(a) R. A. Khatri, S. S. C. Chuang, Y. Soong and M. M. Gray, Ind. Eng. Chem. Res., 2005, 44, 3702 CrossRef CAS;
(b) B. Fadhel, M. Hearn and A. Chaffee, Microporous Mesoporous Mater., 2009, 123, 140 CrossRef CAS;
(c) X. Liu, L. Zhou, X. Fu, Y. Sun, W. Su and Y. Zhou, Chem. Eng. Sci., 2007, 62, 1101 CrossRef CAS;
(d) F. Y. Chang, K. J. Chaoa, H. H. Cheng and C. S. Tan, Sep. Purif. Technol., 2009, 70, 87 CrossRef CAS;
(e) M. L. Gray, T. Y. Soong, K. J. Champagne, H. Pennline, J. P. Baltrus, R. W. Stevens, R. Khatri, S. S. C. Chuang and T. Filburn, Fuel Process. Technol., 2005, 86, 1449 CrossRef CAS;
(f) F. Zheng, D. N. Tran, B. J. Busche, G. E. R. Fryxell, S. Addleman, T. S. Zemanian and C. L. Aardahl, Ind. Eng. Chem. Res., 2005, 44, 3099 CrossRef CAS;
(g) Z. J. Liang, B. Fadhel, C. J. Schneider and A. L. Chaffee, Microporous Mesoporous Mater., 2008, 111, 536 CrossRef CAS;
(h) J. M. Rosenholm, A. Penninkangas and M. Linden, Chem. Commun., 2006, 3909 RSC;
(i) M. B. Yue, Y. Chun, Y. Cao, X. Dong and J. H. Zhu, Adv. Funct. Mater., 2006, 16, 1717 CrossRef CAS.
-
(a) J. W. Wei, J. J. Shi, H. Pan, W. Zhao, Q. Ye and Y. Shi, Microporous Mesoporous Mater., 2008, 116, 394 CrossRef CAS;
(b) C. Knofel, J. Descarpentries, A. Benzaouia, V. Zelenak, S. Mornet, P. L. Llewellyn and V. Hornebecq, Microporous Mesoporous Mater., 2007, 99, 79 CrossRef.
- G. P. Knowles, S. W. Delaney and A. L. Chaffee, Ind. Eng. Chem. Res., 2006, 45, 2626 CrossRef CAS.
- S. Araki, H. Doi, Y. Sano, S. Tanaka and Y. Miyake, J. Colloid Interface Sci., 2009, 339, 382 CrossRef CAS.
- S. H. Liu, C. H. Wu, H. K. Lee and S. B. Liu, Top. Catal., 2010, 53, 210 CrossRef CAS.
- S. Yang, X. Zhou, P. Yuan, M. Yu, S. Xie, J. Zou, G. Q. Lu and C. Yu, Angew. Chem., Int. Ed., 2007, 46, 8579 CrossRef CAS.
- W. Cai, J. Yu, C. Anand, A. Vinu and M. Jaroniec, Chem. Mater., 2011, 23, 1147 CrossRef CAS.
- W. Cai, J. Yu and M. Jaroniec, J. Mater. Chem., 2011, 21, 9066 RSC.
- K. S. W. Sing, D. H. Everett, R. A. W. Haul, L. Moscou, R. A. Pierotti, J. Rouquerol and T. Siemieniewska, Pure Appl. Chem., 1985, 57, 603 CrossRef CAS.
-
S. J. Gregg and K. S. W. Sing, Adsorption, Surface Area and Porosity, Academic Press, London, 1982 Search PubMed.
-
(a) J. Yu, J. C. Yu, M. K. P. Leung, W. Ho, B. Cheng, X. Zhao and J. Zhao, J. Catal., 2003, 217, 69 CAS;
(b) J. Yu, S. Liu and H. Yu, J. Catal., 2007, 249, 59 CrossRef CAS.
- F. Rashidi, A. N. Kharat, A. M. Rashidi, E. Lima, V. Lara and J. S. Valente, Eur. J. Inorg. Chem., 2010, 10, 1544 CrossRef.
- X. L. Ma, X. X. Wang and C. S. Song, J. Am. Chem. Soc., 2009, 131, 5777 CrossRef CAS.
- X. X. Wang, X. L. Ma, L. Sun and C. S. Song, Green Chem., 2007, 9, 695 RSC.
- X. X. Wang, V. Schwartz, J. C. Clark, X. L. Ma, S. H. Overbury, X. C. Xu and C. S. Song, J. Phys. Chem. C, 2009, 113, 7260 CAS.
- F. Su, C. Lu, S. C. Kuo and W. Zeng, Energy Fuels, 2010, 24, 1441 CrossRef CAS.
- G. P. Knowles, J. V. Graham, S. W. Delaney and A. L. Chaffee, Fuel Process. Technol., 2005, 86, 1435 CrossRef CAS.
- A. A. Olajire, Energy, 2010, 35, 2610 CrossRef CAS.
-
(a) N. L. Ho, J. Perez-Pellitero, F. Porcheron and R. J. M. Pellenq, J. Phys. Chem. C, 2012, 116, 3600 CrossRef CAS;
(b) L. N. Ho, J. P. Pellitero, F. Porcheron and R. J. M. Pellenq, Langmuir, 2011, 27, 8187 CrossRef CAS;
(c) N. L. Ho, F. Porcheron and R. J. M. Pellenq, Langmuir, 2010, 26, 13287 CrossRef CAS.
|
| This journal is © The Royal Society of Chemistry 2012 |
Click here to see how this site uses Cookies. View our privacy policy here.