Graphene sheets as anode materials for Li-ion batteries: preparation, structure, electrochemical properties and mechanism for lithium storage†
H. F.
Xiang
ab,
Z. D.
Li
a,
K.
Xie
a,
J. Z.
Jiang
a,
J. J.
Chen
b,
P. C.
Lian
b,
J. S.
Wu
*c,
Y.
Yu
d and
H. H.
Wang
*b
aSchool of Materials Science and Engineering, Hefei University of Technology, Hefei, Anhui 230009, PR China
bSchool of Chemistry & Chemical Engineering, South China University of Technology, Guangdong, Guangzhou, 510640, PR China. E-mail: hhwang@scut.edu.cn
cDepartment of Chemistry, National University of Singapore, 3 Science Drive 3, 117543, Singapore. E-mail: chmwuj@nus.edu.sg
dDepartment of Materials Science and Engineering, University of Science & Technology of China, Hefei, Anhui 230026, PR China
First published on 21st May 2012
Abstract
Varied graphene sheets were prepared from the graphite oxide (GO) with different degrees of oxidation and furthermore their structural characteristics and electrochemical properties as anode materials for Li-ion batteries were investigated. From the expandable graphite with a low oxidation level, the obtained graphene sheets had a thick and intact sheet structure with good crystallinity. Its specific surface area was quite low and no porous structure was detected. The graphene sheets prepared from the GO precursor with a high degree of oxidation were quite thin and disordered, along with high specific surface area and plenty of pores. These ultrathin graphene sheets demonstrated high reversible capacity mainly in the way of lithium absorption, where the specific surface area was the key structural parameter. The thick graphene sheets prepared from the expandable graphite had good crystallinity with few defects and pores, and had a similar lithium storage mechanism to graphite, whereby lithium storage is carried out by intercalation reactions.
1. Introduction
Graphene sheets have attracted much attention as promising electrode materials for electrochemical energy storage devices, such as Li-ion batteries, supercapacitors and so on, due to their high surface area and superior electronic conductivity.1–7 Preparation routes for graphene sheets strongly affect their electrochemical properties when they are used as anode materials for Li-ion batteries. Yoo et al.8 first investigated the lithium storage properties of graphene sheets as high capacity anode materials for Li-ion batteries. They prepared graphene sheets by hydrazine reduction of graphite oxide (GO), which delivered a reversible capacity of 540 mAh g−1 along with a fast capacity fading. Wang et al.9 prepared graphene sheets using a similar procedure, but after heat treatment at 500 °C the graphene sheets showed an improved reversible capacity of 650 mAh g−1 and good cycling stability. Pan et al.10 and Lian et al.11 reported that graphene sheets prepared by thermal reduction of GO exhibited a reversible capacity of over 1000 mAh g−1. However, Guo et al.12 and Wu et al.13 reported that thermally reduced graphene sheets only released a reversible capacity of 600–800 mAh g−1 at the same current rate, even though their preparation procedures have no visible differences from those used by Lian. In the Pan's report,10 Raman intensity ratio, ID/IG, provides a clue to the disordered and/or ordered crystal structure of graphene sheets and has been suggested to be one of the key structural parameters that affect the lithium storage capacity of graphene sheets. However, the ID/IG criterion is insufficient to explain the difference between the cell performances of graphene sheets in the Lian's and Wang's reports.9,11 This fact indicates that more structural parameters and preparation information should be investigated in order to clarify the mechanism for lithium storage of graphene sheets. Notably, graphene sheets prepared from GO with different degrees of oxidation should have significant differences on the porous structure, specific surface area, crystalline and surface functional groups. Therefore, the oxidation degree of GO should be closely related to the lithium storage behavior of the resulting graphene sheets.In this study, we prepared several kinds of graphene sheets from GO with different degrees of oxidation. The structural characteristics of the graphene sheets have been investigated and linked to their preparation procedures. After their electrochemical properties as anode materials for Li-ion batteries were compared, the key structural parameters related to their cell performances were evaluated and the lithium storage mechanism of the graphene sheets was explored.
2. Experimental
2.1 Preparation of the graphene sheets
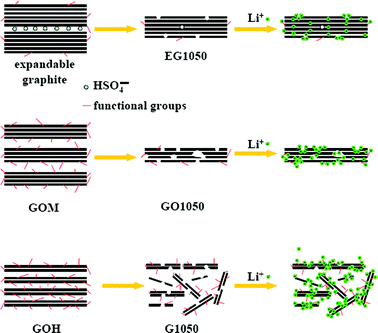
In this paper, five kinds of graphene sheets named EG1050, RGO, GO1050, GO500 and G1050 were prepared and the overall synthetic procedures are illustrated in Scheme 1.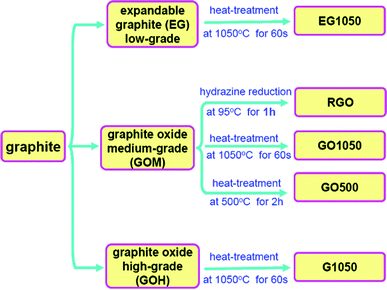 | ||
| Scheme 1 Preparation procedures for five kinds of graphene sheets. | ||
EG1050 was prepared by quickly thermal expansion of expandable graphite (Qingdao Yanxin Graphite Products Co., Ltd) at a high temperature of 1050 °C, just as described in our previous study.14 Here, the expandable graphite was prepared by oxidation of graphite with the help of sulfuric acid, which can be classified as a particular type of graphite oxide (GO). According to the degree of oxidation, the expandable graphite is specifically named low-grade GO. In order to prepare RGO, GO500 and GO1050, medium-grade GO (GOM) was prepared by a modified Hummers method.11,14,15 Graphite (5 g) and NaNO3 (2.5 g) were mixed with 120 mL of H2SO4 (95 wt%) in a 500 mL flask with an ice bath. While maintaining vigorous stirring and the ice bath, KMnO4 (15 g) was slowly added to the suspension. Then, the reaction proceeded overnight with stirring at room temperature. Thereafter, 150 mL deionized H2O was slowly added with vigorous agitation. The reaction was successively maintained at 98 °C with stirring for 24 h, before 50 mL H2O2 (30 wt%) was added to the mixture. For purification, the mixture was washed by rinsing and centrifugation with 5 wt% HCl solution and deionized H2O several times. After filtration and drying under vacuum, the GOM was obtained as gray powder. The graphene sheets (RGO, GO1050 and GO500) were then prepared as following procedures. (1) For the preparation of reduced graphene oxide (RGO), 0.1 g GOM was initially dispersed in 50 mL DI water under ultrasonication. 0.1 mL hydrazine monohydrate was then added and the mixture was heated at 95 °C for 1 h. After that, the RGO (black powder) was collected by filtration and drying in vacuum at 80 °C. (2) The preparation of GO1050 was similar to that of EG1050 with only changing expandable graphite to GOM. (3) GO500 was obtained by heating the GOM at 500 °C for 2 h under argon atmosphere.
The preparation procedure of high-grade GO (GOH) was the same as that for GOM except for the use of a higher concentration of oxidizers. The quantities of graphite, NaNO3, H2SO4 and KMnO4 were changed to 2 g, 2 g, 100 mL and 12 g, respectively. Then, G1050 was prepared by a thermal exfoliation method at 1050 °C, which was similar to EG1050 and GO1050.
2.2 Characterization and electrochemical measurements
GO and the graphene sheets were characterized by X-ray diffraction (Bruker-AXS D8 with Cu-Ka radiation (λ = 1.5406 Å)), Raman spectra (LabRAM Aramis with a laser of 632.8 nm), scanning electron microscope (SEM) (LEO 1530 VP) and high resolution transmission electron microscopy (HRTEM) (JEOL 2100F operated at 200 kV). The Brunauer–Emmet–Teller (BET) specific surface area was determined from N2 adsorption using a Micromeritics ASAP 2010 (USA) analyzer at liquid nitrogen temperature.The electrochemical performances of the graphene sheets were investigated using CR2032 coin-type cells assembled in an argon-filled glove box (Mikrouna, super 1220). Composite electrodes consisting of the graphene sheets (90 wt%) and poly(vinylidene fluoride) (PVDF) (10 wt%) were made by a tape-casting process on copper foils. Microporous polypropylene membranes (Celgard 2400) were used as separators. The electrolyte was 1 M LiPF6/ethylene carbonate (EC) + diethyl carbonate (DEC) (1![[thin space (1/6-em)]](https://www.rsc.org/images/entities/char_2009.gif) :1 w/w). Lithium foil was used as the counter electrode and reference electrode. The cells were galvanostatically cycled between 0.01 and 3 V on a multi-channel battery cycler (Neware BTS2300, Shenzhen). Cyclic voltammograms (CV) were performed over the potential range of 0–3 V at a scanning rate of 0.2 mV s−1 on a Zahner IM6ex electrochemical workstation. The AC impedance was also measured on the Zahner IM6ex electrochemical workstation, with the frequency range and voltage amplitude set at 100 kHz to 0.01 Hz and 10 mV, respectively.
:1 w/w). Lithium foil was used as the counter electrode and reference electrode. The cells were galvanostatically cycled between 0.01 and 3 V on a multi-channel battery cycler (Neware BTS2300, Shenzhen). Cyclic voltammograms (CV) were performed over the potential range of 0–3 V at a scanning rate of 0.2 mV s−1 on a Zahner IM6ex electrochemical workstation. The AC impedance was also measured on the Zahner IM6ex electrochemical workstation, with the frequency range and voltage amplitude set at 100 kHz to 0.01 Hz and 10 mV, respectively.
3. Results and discussion
3.1 Preparation and structure of the graphene sheets
The preparation procedures of the five kinds of graphene sheets are illustrated in Scheme 1. Generally, they involve two steps: (1) preparation of GO and (2) subsequently chemical or thermal reduction of GO to graphene sheets. Fig. 1 shows the appearance features of three kinds of GO. The expandable graphite (low-grade GO) appears to be black silver flakes with metallic luster (Fig. 1a) and it inherits most of the physical characteristics of graphite. Besides having an appearance similar to graphite, expandable graphite also cannot be dispersed in most inorganic and organic solvents. As shown in Fig. 1b, after strong oxidation by H2SO4 and KMnO4, the obtained GOM is a black powder without the metallic luster and the flake profile. GOM can be easily dispersed in water and many organic solvents, such as ethanol, n-methyl-2-pyrrolidone (NMP) and dimethylformamide (DMF), to form a homogeneous suspension due to the existence of a mass of functionalized oxygen-containing groups, i.e., epoxyl, hydroxyl and carbonyl. Treating graphite with a higher concentration of oxidizers, ultra-fine GOH powders with a light brown color are obtained (Fig. 1c). GOH can be dispersed in water more easily than GOM, which can be attributed to more oxygen-containing functional groups on GOH (proved by the TGA curves in Fig. S1 in supporting information (ESI†)). As displayed in Fig. 1d, the GOM suspension is brown, however, the GOH suspension with the same concentration is yellow. With an increasing degree of oxidation, the color of GO changes from dark to light, presumably due to the breakage of the sp2-conjugated carbon bonding.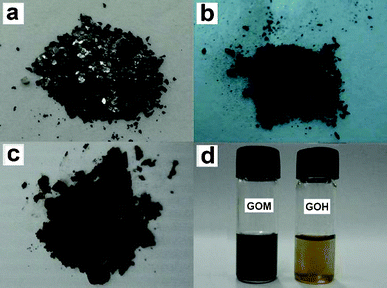 | ||
| Fig. 1 Digital photographs of the expandable graphite (a), GOM (b), GOH (c) and the suspensions of GOM and GOH in water (d). | ||
The crystalline structures of GO and the graphene sheets were evaluated by XRD (Fig. 2a–c). The expandable graphite has an inconspicuous peak at 13.0° (d = 6.8 Å) and a typically strong peak at 26° similar to graphite (Fig. 2a). In Fig. 2b, GOM has a broad peak at 12.0° (d = 7.3 Å), corresponding to the average interlayer distance of loosely packed GO sheets. Another broad and weak band at 20–30° for GOM corresponds to the interlayer distance of stacked graphene sheets, which suggests that few layer graphene still exists at relatively low oxidation levels. At a higher oxidation level e.g. in GOH, no diffraction can be detected at 20–30° (Fig. 2c), which means that almost all of the graphene sheets are oxidized and there are no stacked graphene sheets. The only peak at 11.3° in the XRD pattern of GOH is corresponding to the d value of 7.8 Å, which is higher than that of GOM. The higher d value is related to the higher number of oxygen-containing groups anchored on the graphene sheets.16
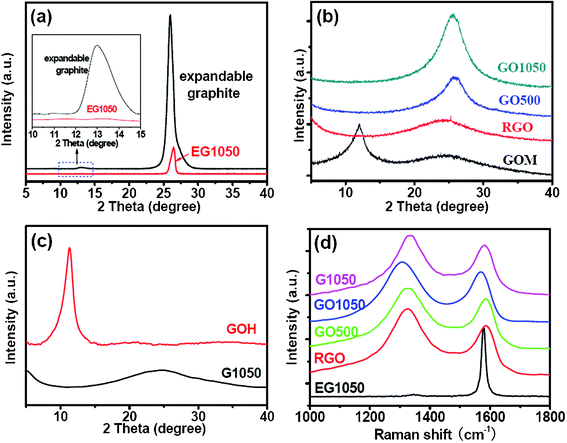 | ||
| Fig. 2 XRD patterns (a–c) and Raman spectra (d) of GO and graphene sheets, (a) the expandable graphite and EG1050, (b) GOM and GO1050, (c) GOH and G1050. | ||
Studying the Raman spectra of carbon materials is an effective method to detect the graphitic carbon (G-band) and disorder carbon (D-band). The G-band is the typical character of graphitic carbon corresponding to sp2-bonding, but the D-band is usually related to defects, edge sites and pores.10,17–19Fig. 2d shows the Raman spectra of the graphene sheets. EG1050 has a strong peak at 1580 cm−1 (G-band) along with a negligible peak at 1340 cm−1 (D-band), as previously reported.20 This result suggests that EG1050 has good crystallinity with few defects, edge sites and pores. However, those graphene sheets derived from GOM and GOH contain two distinct bands at 1200–1400 (D-band) and 1500–1700 cm−1 (G-band), as reported elsewhere.12,21–24 The ID/IG values of RGO, GO500, GO1050 and G1050 are 1.32, 1.20, 1.19 and 1.20, respectively. Herein, GO1050 and G1050 have comparable ID/IG values, even though they are derived from different GO precursors, i.e., GOM and GOH.
SEM images of GO and graphene sheets (Figs S2 and S3†) show that GOM and GOH have a typically wrinkled morphology, which has been basically inherited by their derivatives (RGO, GO500, GO1050 and G1050). But the graphene sheets (EG1050) from the expandable graphite have relatively flat and smooth surfaces (Fig. S2†). TEM characterization (Fig. 3) gives further evidence for the structure of the graphene sheets. EG1050 has no surface crumpling and the edges are quite unbent, but GO1050 and G1050 have the wrinkled morphology and complicated edges. From the electron diffraction pattern (insets of Fig. 3b, d and f), it can be concluded that EG1050 is crystalline, but GO1050 and G1050 are disordered. Furthermore, the thickness of EG1050 is estimated to be about 8.5 nm, i.e., every sheet is formed from more than 20 graphene layers stacking along the thickness direction. The thickness of GO1050 and G1050 is approximately 3.8 nm and 2.8 nm, respectively. These observations show that the degree of oxidation of the GO precursor is the key parameter that affects crystallinity and thickness of the graphene sheets.
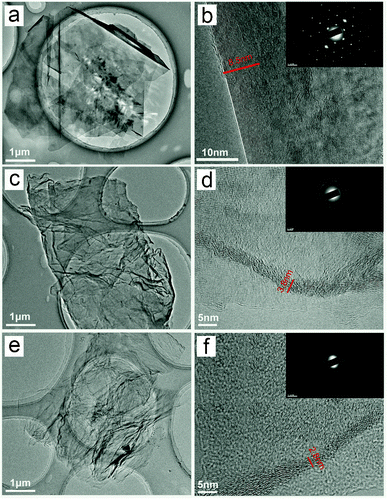 | ||
| Fig. 3 HRTEM images of the graphene sheets prepared at 1050 °C, EG1050 (a and b), GO1050 (c and d) and G1050 (e and f); the insets show the corresponding electron diffraction patterns. | ||
The porous structure and the specific surface area of three kinds of graphene sheets prepared by thermal expansion at 1050 °C were investigated by nitrogen isothermal adsorption (Fig. 4). The adsorption–desorption isotherms of GO1050 and G1050 exhibit a type IV nitrogen adsorption branch associated with a well-defined capillary condensation step, as well as a typical hysteresis between the adsorption and desorption branches, which is characteristic of uniform mesopores.25,26 But EG1050 has significantly different isotherm curves from GO1050 and G1050, due to the absence of the mesopores. In the region of especially low pressure, the line reflects on the adsorption–desorption of the micropores. It is distinct that the descending order of the amount of micropores is as follows: G1050 > GO1050 > EG1050 (negligible). The BET specific surface areas of EG1050, GO1050 and G1050 are 18.2, 121.2 and 492.5 m2 g−1, respectively. That is, GO with a higher oxidation level will generate graphene sheets with more pores and higher specific surface area. The pore size distributions of GO1050 and G1050, calculated by the Barrett–Joyner–Halenda (BJH) method, are shown in the inserted graph of Fig. 4. Although GO1050 has a similar pore size distribution to G1050, the latter has many more pores, including both mesopores (2–50 nm) and macropores (>50 nm). Therefore, G1050 has a higher pore volume of 2.258 cm3 g−1 than GO1050 (0.507 cm3 g−1). The average pore diameter of the mesopores in G1050 is bigger than that in GO1050. One of the possible reasons is that bigger pores are formed after more oxygen-containing functional groups are removed from GO under a higher oxidation level. The other reason for the more numerous and bigger pores in G1050 can be attributed to its bigger interlayer space compared to that of GO1050. Furthermore, the maximum pore volumes of the micropores in the GO1050 and G1050 are 0.026 and 0.100 cm3 g−1, respectively, based on the Horvath–Kawazoe method. G1050 has many more pores of bigger size than GO1050, so it has a higher specific surface area than GO1050, although they have comparable ID/IG values (Fig. 2d). Since the ID/IG value describes the disordered carbon, including both surface and inner defects, GO1050 could have quite a few defects in the inner owing to the stacked graphene structure. However, the defects in ultrathin G1050 should be in the form of surface defects.
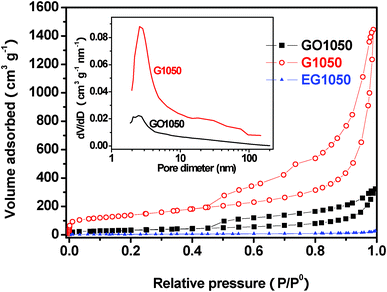 | ||
| Fig. 4 Adsorption–desorption isotherms and pore size distributions (insert) of GO1050, G1050 and EG1050. | ||
3.2 Electrochemical properties
The cell performances of the graphene sheets in the graphene/Li cells are shown in Fig. 5. The initial voltage profiles of the cells in Fig. 5a indicate that all the graphene sheets derived from GOM show similar charge–discharge profiles with a large voltage hysteresis and without distinct plateaus. For RGO, the first discharge (lithiation) and charge (delithiation) capacities are 875 and 385 mAh g−1, respectively. The graphene sheets prepared by thermal reduction have slightly improved reversible capacities (charge capacities) of 434 mAh g−1 for GO500 and 438 mAh g−1 for GO1050. The first coulombic efficiencies (the ratio between the charge capacity and the discharge capacity) for the cells using RGO, GO500 and GO1050 are 44%, 51% and 55%, respectively. This is consistent with the approved viewpoint that the heat treatment is helpful to suppress the side reactions by removing some active groups in the graphene sheets.9 There is no significantly different effect between the high-temperature expansion at 1050 °C in a short time (60 s) and the low-temperature reduction (500 °C) for a relatively long time (2 h) on the initial cell performances of the obtained graphene sheets from the same GO precursor. However, from the cycling performance point of view, GO1050 has a visible advantage over GO500 and RGO (Fig. 5b). Fig. 5c shows the initial charge–discharge curves of G1050 and EG1050. G1050 exhibits quite a high reversible capacity of 835 mAh g−1. Just like the graphene sheets prepared from GOM, G1050 has also the similar charge–discharge character to the hard carbon.27–29 The initial coulombic efficiency of the cell using G1050 in particular is as low as 35%. However, EG1050 has a low reversible capacity of 221 mAh g−1 with a coulombic efficiency of 63% and the plateau character is quite different from the common graphene sheets. EG1050 has clear voltage plateaus below 1 V, which are very similar to those for graphite. Although EG1050 has lower capacity between 0–3 V, its capacity in the range of 0–1 V is comparable to that of G1050. From Fig. 5d, both EG1050 and G1050 have excellent cycling performance. CV results (Fig. S4 in ESI†) are quite consistent with the charge–discharge curves. The order of reversible capacity is G1050 > GO1050 > RG1050. For GO1050 and G1050, no distinct anodic peak can be found, which is a typical capacitive character. EG1050 exhibits more reversibility than GO1050 and G1050, and has a distinct anodic peak between 0–1 V, which is ascribed to lithium deintercalation from the graphene interlayers.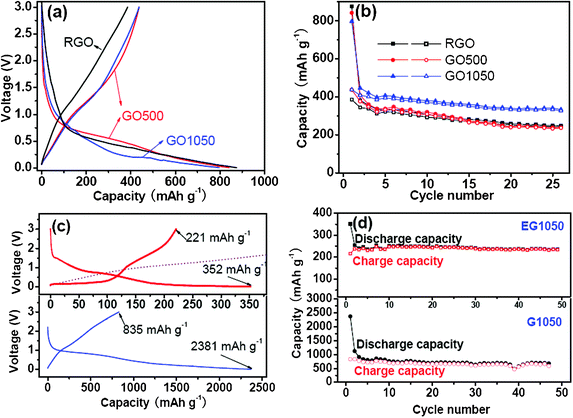 | ||
| Fig. 5 Initial voltage profiles and cycling performances of the cells with the electrodes using the graphene sheets generated from GOM (a, b), EG1050 and G1050 (c,d). The cutoff is set at 3.0–0 V and the current density is 50 mA g−1. | ||
Fig. 6 shows the AC impedance spectra of the cells using GO1050, G1050 and EG1050 at a discharge potential of 0.1 V after two cycles. The impedance curves show two compressed semicircles in the high and medium frequency region and an inclined line in the low frequency region. Usually, the semicircle in the high-frequency region is attributed to the impedance of the SEI (Solid Electrolyte Interface) layer and the semicircle in the medium-frequency region reflects the impedance of the charge transfer.30 Here, both GO1050 and G1050 exhibit a high impedance of about 200–300 Ω for the SEI layer. The impedance related to the charge transfer for GO1050 and G1050 is in the range of 100–200 Ω. A linear line at the low frequency range approaches an angle of 90° to the Z'-axis, indicating a capacitor behavior.31 However, EG1050 exhibits negligible impedance for the SEI layer, but large impedance for the charge transfer and a 45° inclined line at low frequency range, which is typical character for the Warburg impedance related to the lithium ion diffusion in the solid phase.32,33 The much higher Warburg impedance in EG1050 than in GO1050 and G1050 is mainly because of the absence of pores in the panels of graphene sheets.
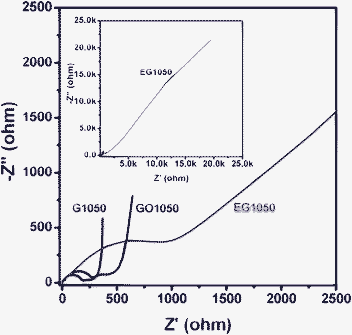 | ||
| Fig. 6 AC impedance spectra of the cells with the electrodes using GO1050, G1050 and EG1050. Before the AC impedance measurements, all of the cells were cycled twice and subsequently discharged to 0.1 V. | ||
3.3 Relationship between structural characteristics and lithium storage mechanisms of the graphene sheets
Based on the above results, the effects of structural characteristics of the graphene sheets on their electrochemical properties were clarified. In Fig. 5a and c, the voltage profiles of the graphene sheets derived from GOM and GOH are quite similar to those of conventional hard carbon. We propose that the main reasons for this similarity are their similar disordered structures, porosity and especially the existence of hetero-atoms (H and O) or dangling bonds. As Oh reported on non-graphitizable carbons, lithium storage at the sites of hetero-atoms (H and O) or dangling bonds took place mainly near 0 V, but lithium was removed from those sites in a broad voltage range of above 0.8 V.34 Similarly, large voltage hysteresis was observed during lithium storage and removal in the graphene sheets with a large amount of hetero-atoms and dangling bonds. As for the reversible storage capacity, the differences between RGO, GO500 and GO1050 are somewhat smaller than those between EG1050, GO1050 and G1050. When the graphene sheets derived from the same GO precursor were applied in the Li-ion batteries, their electrochemical differences were indistinct. That is, the oxidation level of the GO precursor is the key issue for the electrochemical behavior of graphene sheets rather than the reduction method. The expandable graphite (low-grade GO) is able to produce thick and crystal graphene sheets (EG1050) with few defects and low specific surface area. Prepared from GO at a high oxidation level, GO1050 and G1050 have few graphene layers and high specific surface areas. Furthermore, G1050 has a much thinner thickness and higher specific surface area than GO1050, but they have the comparable ID/IG values. Therefore, we conclude that G1050 has more surface defects (also including edge sites and pores), but GO1050 has more inner defects.In Fig. 7, the voltage profiles of EG1050, GO1050 and G1050 have been compared carefully. The voltage plateaus in Region A during the 1st discharge process (Fig. 7a) were significantly reduced during the 2nd discharge process (Fig. 7b), which is a typical characteristic of the side reactions between electrode and electrolyte. The voltage plateau at ∼0.9 V of G1050 is derived from the reactions between the surface defects and the electrolyte, and results in a large irreversible capacity. Nevertheless, the inner defects in GO1050 have no visible contribution to the irreversible capacity, since they cannot make contact with the electrolyte. In Region B, mainly lithium storage occurs in the graphene sheets. As for EG1050, the distinct voltage plateau below 0.5 V (Fig. 7a and c) indicates that lithium storage is mainly by the way of lithium intercalation in the graphene interlayer, just like in graphite. In Fig. 7c, charge curves are roughly divided into two sections. At low potential (Region C, ≤ 0.9 V), lithium is extracted from the graphene interlayer, but at high potential (Region D, > 0.9 V), lithium is desorbed from the surface of the graphene sheets. For disordered GO1050 and G1050 with big d-spacing, lithium insertion/extraction in the graphene interlayer is completely different from that in EG1050 (Region C). Considering the voltage profiles in Region D, we propose that the major lithium storage mode in GO1050 and G1050 is electrochemical absorption. Definitely, the specific surface area is the key parameter for lithium absorption on the graphene sheets. The relationship between the absorbed capacity (Region D) and the BET specific surface area is illustrated in Fig. 7d. Basically, the absorbed capacity (capacitive contribution) increases linearly with the BET specific surface area. Moreover, the main sites for lithium storage in G1050 and GO1050 are on the surface rather than the inner defects. Therefore, G1050 has a much higher reversible capacity and irreversible capacity than GO1050, as illustrated in Scheme 2. In brief, the GO precursor with the higher oxidation level will result in the graphene sheets with higher specific surface area, which contributes to a higher lithium storage capacity. This criterion is also shown in previous literatures.7–12 However, in Pan's report,10 high capacity (>1000 mAh g−1) graphene sheets resulted from the GO precursor prepared by carrying out oxidation twice, but the specific area was just 184 m2 g−1 (much less than that of G1050). The possible reason for the low specific surface area was attributed to the serious aggregation of small graphene segments,35 which could be induced by too high a degree of oxidation.
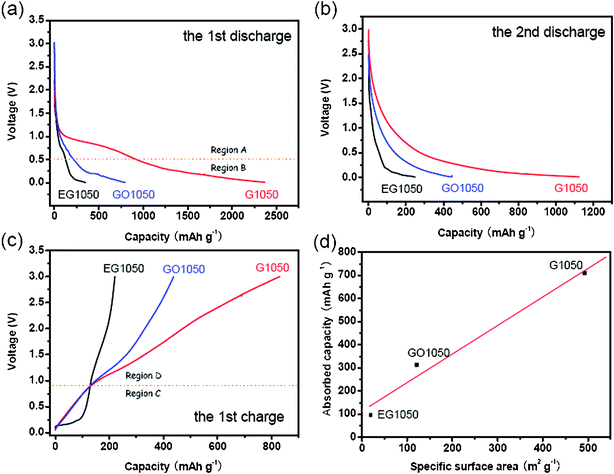 | ||
| Fig. 7 Capacity–voltage curves (a–c) of the cells with the electrodes using the graphene sheets (EG1050, GO1050 and EG1050); (a) during the 1st discharge, (b) during the 2nd discharge and (c) during the 1st charge. (d) The relationship between the BET specific surface area of the graphene sheets and the absorbed capacity (derived from Region D) of the cells with the electrodes using the graphene sheets. | ||
 | ||
| Scheme 2 An illustration of the lithium storage mechanisms of various graphene sheets. | ||
4. Conclusions
Several kinds of graphene sheets were prepared from the GO with different degrees of oxidation. Their morphology and structure were fully characterized by SEM, HRTEM, XRD, Raman and BET measurements. These results indicate that the structure of the graphene sheets are strongly dependent on the degree of oxidation applied in the preparation of GO. A higher degree of oxidation led to the thinner graphene sheets with higher specific surface area. EG1050 prepared from expandable graphite (low-grade GO) had good crystallinity with few defects and pores, and had a similar lithium storage mechanism to graphite, whereby lithium storage is carried out by intercalation reactions. However, derived from a GO precursor with the high oxidation level, the disordered graphene sheets (GO1050 and G1050) exhibit significantly different electrochemical properties from highly crystalline EG1050. Lithium storage in GO1050 and G1050 is by the way of electrochemical absorption, which is strongly dependent on the specific surface area. G1050 with the specific surface area of 492.5 m2 g−1 delivers a much higher reversible capacity than GO1050 (121.2 m2 g−1). Based on our results, the performance of graphene sheets for lithium storage in Li-ion batteries could be designed by tuning the oxidation degree of the GO precursor.Acknowledgements
This study was supported by National Science Foundation of China (grant No. 21006033) and the Fundamental Research Funds for the Central Universities, SCUT (2009220038). We are also grateful to financial support from the Singapore A*Star SERC Thematic Strategic Research Programme – Sustainable Materials: Composites Lightweights (R-143-000-401-305).References
- Y. Q. Sun, Q. O. Wu and G. Q. Shi, Energy Environ. Sci., 2011, 4, 1113–1132 CAS.
- H. Gwon, H. S. Kim, K. U. Lee, D. H. Seo, Y. C. Park, Y. S. Lee, B. T. Ahn and K. Kang, Energy Environ. Sci., 2011, 4, 1277–1283 CAS.
- C. E. Banks, D. B. Brownson, D. A. C. Brownson and D. K. Kampouris, J. Power Sources, 2011, 196, 4873–4885 CrossRef.
- L. J. Zhi, Y. Fang and F. Y. Kang, New Carbon Mater., 2011, 26, 5–8 CAS.
- M. Pumera, Energy Environ. Sci., 2011, 4, 668–674 CAS.
- C. X. Guo and C. M. Li, Energy Environ. Sci., 2011, 4, 4504–4507 CAS.
- C. X. Guo, M. Wang, T. Chen, X. W. Lou and C. M. Li, Adv. Energy Mater., 2011, 1, 736–741 CrossRef CAS.
- E. Yoo, J. Kim, E. Hosono, H. Zhou, T. Kudo and I. Honma, Nano Lett., 2008, 8, 2277 CrossRef CAS.
- G. Wang, X. Shen, J. Yao and J. Park, Carbon, 2009, 47, 2049 CrossRef CAS.
- D. Pan, S. Wang, B. Zhao, M. Wu, H. Zhang, Y. Wang and Z. Jiao, Chem. Mater., 2009, 21, 3136–3142 CrossRef CAS.
- P. C. Lian, X. F. Zhu, S. Z. Liang, Z. Li, W. S. Yang and H. H. Wang, Electrochim. Acta, 2010, 55, 3909–3914 CrossRef CAS.
- P. Guo, H. Song and X. Chen, Electrochem. Commun., 2009, 11, 1320–1324 CrossRef CAS.
- Z. S. Wu, W. Ren, L. Xu, F. Li and H. M. Cheng, ACS Nano, 2011, 5, 5463–5471 CrossRef CAS.
- H. F. Xiang, K. Zhang, G. Ji, J. Y. Lee, C. J. Zou, X. D. Chen and J. S. Wu, Carbon, 2011, 49, 1787–1796 CrossRef CAS.
- K. Zhang, L. L. Zhang, X. S. Zhao and J. S. Wu, Chem. Mater., 2010, 22, 1392 CrossRef CAS.
- C. Wang, D. Li, C. O. Too and G. G. Wallace, Chem. Mater., 2009, 21, 2604 CrossRef CAS.
- K. N. Kudin, B. Ozbas, H. C. Schniepp, R. K. Prud'homme, I. A. Aksay and R. Car, Nano Lett., 2008, 8, 36 CrossRef CAS.
- X. H. Rui, J. X. Zhu, D. Sim, C. Xu, Y. Zeng, H. H. Hng, T. M. Lim and Q. Y. Yan, Nanoscale, 2011, 3, 4752 RSC.
- L. Q. Tao, J. T. Zai, K. X. Wang, Y. H. Wan, H. J. Zhang, C. Yu, Y. L. Xiao and X. F. Qian, RSC Adv., 2012, 2, 3410–3415 RSC.
- W. T. Gu, W. Zhang, X. M. Li, H. W. Zhu, J. Q. Wei, Z. Li, Q. K. Shu, C. Wang, K. L. Wang, W. C. Shen, F. Y. Kang and D. H. Wu, J. Mater. Chem., 2009, 19, 3367 RSC.
- A. Abouimrane, O. C. Compton, K. Amine and S. T. Nguyen, J. Phys. Chem. C, 2010, 114, 12800 CAS.
- Z. J. Fan, J. Yan, T. Wei, G. Q. Ning, L. J. Zhi, J. C. Liu, D. X. Cao, G. L. Wang and F. Wei, ACS Nano, 2011, 5, 2787 CrossRef CAS.
- G. D. Du, K. H. Seng, Z. P. Guo, J. Liu, W. X. Li, D. Z. Jia, C. Cook, Z. W. Liu and H. K. Liu, RSC Adv., 2011, 1, 690–697 RSC.
- Z. S. Wu, W. C. Ren, L. B. Gao, J. P. Zhao, Z. P. Chen, B. L. Liu, D. M. Tang, B. Yu, C. B. Jiang and H. M. Cheng, ACS Nano, 2009, 3, 411 CrossRef CAS.
- S. B. Yang, X. L. Feng, L. Wang, K. Tang, J. Maier and K. Mullen, Angew. Chem., Int. Ed., 2010, 49, 4795 CrossRef CAS.
- J. T. Zai, C. Yu, Q. Zou, L. Q. Tao, K. X. Wang, Q. Y. Han, B. Li, Y. L. Xiao, X. F. Qian and R. R. Qi, RSC Adv., 2012, 2, 4397–4403 RSC.
- J. R. Dahn, T. Zheng, Y. Liu and J. S. Xue, Science, 1995, 270, 590 CAS.
- A. Concheso, R. Santamaría, R. Menéndez, R. Alcántara, P. Lavela and J. L. Tirado, J. Power Sources, 2006, 161, 1324 CrossRef CAS.
- T. Liu, R. Luo, S. H. Yoon and I. Mochida, Mater. Lett., 2010, 64, 74 CrossRef CAS.
- S. Yang, H. Song and X. Chen, Electrochem. Commun., 2006, 8, 137 CrossRef CAS.
- Q. L. Du, M. B. Zheng, L. F. Zhang, Y. W. Wang, J. H. Chen, L. P. Xue, W. J. Dai, G. B. Ji and J. M. Cao, Electrochim. Acta, 2010, 55, 3897 CrossRef CAS.
- C. H. Chen, J. Liu and K. Amine, J. Power Sources, 2001, 96, 321 CrossRef CAS.
- S. S. Zhang, K. Xu and T. R. Jow, J. Power Sources, 2003, 113, 166 CrossRef CAS.
- C. W. Park, S. -H. Yoon, S. I. Lee and S. M. Oh, Carbon, 2000, 38, 995 CrossRef CAS.
- M. J. McAllister, J. Li, D. H. Adamson, H. C. Schniepp, A. A. Abdala, J. Liu, M. Herrera-Alonso, D. L. Milius, R. Car and R. K. Prud'homme, Chem. Mater., 2007, 19, 4396 CrossRef CAS.
Footnote |
| † Electronic Supplementary Information (ESI) available. See DOI: 10.1039/c2ra20549a/ |
| This journal is © The Royal Society of Chemistry 2012 |