Novel freeze-dried foams from glutenin- and gliadin-rich fractions
Thomas O. J.
Blomfeldt
a,
Ramune
Kuktaite
b,
Tomás S.
Plivelic
c,
Faiza
Rasheed
b,
Eva
Johansson
b and
Mikael S.
Hedenqvist
*a
aFibre and Polymer Technology, KTH Royal Institute of Technology, SE-100 44 Stockholm, Sweden
bFaculty of Landscape Planning, Horticulture and Agricultural Sciences, Swedish University of Agricultural Sciences, Box 104, SE-230 53 Alnarp, Sweden
cMAX IV Laboratory, Lund University, SE-221 00 Lund, Sweden. E-mail: mikaelhe@kth.se; Fax: +46-8-208856 Tel. +46-8-7907645
First published on 13th June 2012
Abstract
This is the first study on freeze-dried foams prepared from glutenin- and gliadin-rich fractions of wheat gluten and blends thereof. It was found that the foam density and stiffness could be controlled by a suitable choice of the glutenin/gliadin ratio. The glutenin-rich samples had the highest foam densities and the density decreased with increasing gliadin content. The compression modulus also decreased with increasing gliadin content, which was explained by the decrease in foam density, a more open porosity and the more aggregated/polymerized structure in the presence of glutenin. IR and SE-HPLC revealed that the least aggregated foams were those consisting only of the gliadin-rich fraction. Confocal laser scanning microscopy revealed the presence of both HMW-glutenin and gliadin (to a certain extent probably resisting the ethanol extraction process) in the glutenin-rich foams. SAXS indicated that the gliadin-rich fraction contributed with weakly correlated protein aggregates with a characteristic distance of 40–43 Å.
Introduction
The wheat gluten (WG) protein is known for its great foam-stabilizing properties (cf. bread)1,2 and offers a great potential as a renewable alternative to petroleum-based polymer foams.3 Since it is a byproduct from the Swedish bioethanol industry,4 it is readily available at a reasonably low price.5,6WG consists mainly of two protein types referred to as gliadin and glutenin. Gliadins are extractable in aqueous alcohol solutions while glutenins are partly soluble only in alkaline or acidic solutions.7 Gliadins can be further divided into α-/β-, γ- and ω-gliadins. The α-/β- and γ-gliadins have a similar primary structure, consisting of polypeptides with cysteine residues that, in the native state, connect by intra-chain disulfide bonds, while the ω-gliadins are devoid of cysteine.8 Glutenins form polymers through an extensive linking of separate polypeptides (subunits) via inter-chain disulfide bonds.9 These glutenin subunits (GS) are classified, based on their size, into high molecular weight (HMW-GS) and low molecular weight (LMW-GS) components.10 Even though glutenin and gliadin types of proteins show different solubilities in alcohol solutions, a certain overlap in extractability is normally observed, especially between the gliadin and the LMW-GS components.11 Hence, the separation of gluten into gliadins and glutenins is therefore here referred to as gliadin-rich and glutenin-rich fractions.
WG undergoes polymerization/crosslinking at elevated temperatures, involving a redistribution of disulfide (S–S) bonds leading to an aggregated protein network.12 The aggregation takes place in particular between glutenin subunits,13 but α- and γ-gliadins are also known to polymerize through a redistribution of the intra-chain disulfide bonds under certain conditions.14 The gliadins require a higher temperature than the glutenins to crosslink (above 90 °C). Extensive crosslinking of the gliadins may require special additives, e.g. ammonium hydroxide.15,16
The mechanical properties and protein structure of freeze-dried wheat gluten foams was recently reported.17 The properties varied with gluten concentration and in the presence of glycerol as plasticizer and bacterial cellulose as reinforcing agent. The specific contributions of the different protein components were not however explored. This work inspired us to go further and to investigate how different proteins (glutenins and gliadins) contribute to the structure and properties of these types of foams. WG foams may be of general interest for the foam industry due to their promising flame retardant and thermal insulation properties.18
This paper investigates how glutenin- and gliadin-rich fractions affect the structure and properties of freeze-dried gluten foams. Foams were prepared from these fractions alone, obtained from a commercial WG, or from a combination of these. The foams were evaluated with respect to their foamability and density. The protein structure and degree of polymerization in the fractions and in the foams were determined and the mechanical properties of the foams were assessed with compression tests.
Experimental
Materials
The commercial wheat gluten powder was kindly supplied by Lantmännen Reppe AB, Sweden. According to the supplier, the gluten protein content was 77.7% of the dry weight (modified NMKL Nr 6 method, Kjeltec, Nx5.7, www.NMKL.org). For the production of the gluten foams, two different gluten powders were used; a “fresh” powder (after arrival stored at −25 °C in a freezer before use) and an “aged” powder, that had been stored under ambient conditions for at least a year. Both were obtained from the same batch and manufacturer. As described below, the aged powder yielded a highly aggregated glutenin-rich foam.Extraction of glutenin- and gliadin-rich fractions
16 g of gluten powder was mixed with 200 ml of 70% ethanol. In order to avoid the formation of agglomerates and to achieve a homogeneous mixture of the gluten powder, the powder was slowly added by shaking it through a sieve (metal net with 2 × 2 mm2 holes) into the ethanol solution during magnetic stirring. It is important to note that all powder went through the sieve. Thereafter the mixture was shaken for 30 min at 300 rpm under ambient conditions using a mechanical shaker (Hunkel Ika, Werk KS 500). After the shaking, the mixture was centrifuged for 10 min at 12 000 rpm using a Beckman J2.21 centrifuge. The supernatant containing the gliadins was transferred to a new tube, while the pellet containing the glutenins was kept in the centrifuge tubes. The pellets were washed three times in Millipore water and were cut into small pieces immediately after centrifugation. The gliadin-rich fraction was obtained by removing the ethanol in a rotary evaporator (Bushi). The gliadin- and glutenin-rich fractions were frozen at −80 °C for 2 h before being freeze-dried for 72 h using a Modulyo freeze-drier. The glutenin-rich fraction is hereafter referred to as the G fraction. In order to evaluate how highly aggregated glutenins affect the foaming properties of the gluten, an aged glutenin-rich fraction (hereinafter referred to as the AG fraction) was prepared from unsieved aged gluten powder, stored for at least a year under ambient conditions. The preparation of the AG fraction was the same as for the G fraction, except that no sieve was used. All the protein fractions were finally ground into powder using an IKA Yellow Line A10 laboratory mill.Preparation of foams
Freeze-dried wheat gluten foams were prepared according to Blomfeldt et al.,17 with a few modifications. A Philips Chopper mixer (model HR 1392) was used to disperse the gliadin- and/or glutenin-rich fractions in distilled water as shown in Table 1. The pH was adjusted to pH 11 with sodium hydroxide. When the mixture appeared visually uniform, it was heated to 75 °C while undergoing further dispersion in a Yellow Line Di 25 basic homogenizer from IKA (model 31 300 00) with dispersion tool S25N-18G, IKA (model 05 934 00). The dispersion tool was placed with the bottom side just beneath the surface of the mixture. This forced air into the mixture during the stirring and allowed a significant expansion of the mixture. The mixture was then placed in either a cylinder-shaped silicone mold (diameter: 25 mm, height: 12 mm) or in a parallelepiped-shaped silicone mold (10 × 10 × 14 mm3). Thereafter, the samples were frozen at −25 °C for at least 6 h. The frozen blocks were then freeze-dried for 24 h in a 20 × 20 × 4 cm3 poly(methyl methacrylate) form connected to a Lyovac GT 2 freeze-dryer (GEA Process Engineering). A solids content of 14 wt.% in the mixture was chosen in order to be able to compare the results with previously reported work on freeze-dried gluten foams.3,17 The foams were stored under ambient conditions in desiccators containing silica gel until further measurement or equilibration in different climates.| Foam sample | Glutenina | Gliadinb | Water | ||
|---|---|---|---|---|---|
| g | wt.% | g | wt.% | mL | |
| a Glutenin (G fraction) content in the water/gluten mixture. b Gliadin (gliadin-rich fraction) content in the water/gluten mixture. c Based on the AG-fraction. | |||||
| AGc | 10 | 14 | 0 | 0 | 60 |
| G | 10 | 14 | 0 | 0 | 60 |
| Gliadin | 0 | 0 | 10 | 14 | 60 |
| 50/50 | 5 | 7 | 5 | 7 | 60 |
| 25/75 | 2.5 | 3.5 | 7.5 | 10.5 | 60 |
Field-emission scanning electron microscopy (FE-SEM)
Foam samples were prepared for FE-SEM by freezing them in liquid nitrogen and then fracturing them in a bending mode. They were then stored in a desiccator over silica gel for at least 48 h before being examined in a Hitachi S-4800 FE-SEM. Before inserting the sample into the microscope, the foam sample surfaces were coated with gold to a thickness of 6 nm (to avoid charging of the sample in the SEM) using an Agar High Resolution Sputter Coater (model 208RH), equipped with a gold target/Agar thickness controller.Moisture sorption
Samples were taken from a desiccator containing silica gel and immediately weighed (Mettler AE 100 balance, accuracy: 10−4 g) in a climate room (23 ± 1 °C and 50 ± 2% RH). The samples were again weighed after 120 h and the moisture content under these conditions was then calculated. Five replicates of each sample were used. By weighing wheat gluten foams as a function of time it has been shown that 120 h is sufficient for the foam to equilibrate to 50% RH (data not shown).Compression testing
The compression test was performed in accordance with ISO 844![[thin space (1/6-em)]](https://www.rsc.org/images/entities/char_2009.gif) :
:![[thin space (1/6-em)]](https://www.rsc.org/images/entities/char_2009.gif) 2007 for rigid foams on cylindrical specimens (diameter: 25 mm, height: 12 mm) with an Instron 5566 Universal Testing machine using Instron compression plates (T1223-1021) with a diameter of 50 mm. The testing was carried out at 23 ± 1 °C and 50 ± 2% RH. A 500 N load cell was used with a compression rate of 10% of the original sample thickness per min. The final strain was set at 80% of the original specimen height (not 15% as suggested in the ISO-standard) in order to evaluate the material behaviour over a larger deformation interval. All the samples were conditioned at 23 ± 1 °C and 50 ± 2% RH for 120 h before being tested. After the compression test, the samples were stored at 23 ± 1 °C and 50 ± 2% RH and the residual height of the specimens was measured after 72 h and the strain recovery calculated. 4–5 replicates were used.
2007 for rigid foams on cylindrical specimens (diameter: 25 mm, height: 12 mm) with an Instron 5566 Universal Testing machine using Instron compression plates (T1223-1021) with a diameter of 50 mm. The testing was carried out at 23 ± 1 °C and 50 ± 2% RH. A 500 N load cell was used with a compression rate of 10% of the original sample thickness per min. The final strain was set at 80% of the original specimen height (not 15% as suggested in the ISO-standard) in order to evaluate the material behaviour over a larger deformation interval. All the samples were conditioned at 23 ± 1 °C and 50 ± 2% RH for 120 h before being tested. After the compression test, the samples were stored at 23 ± 1 °C and 50 ± 2% RH and the residual height of the specimens was measured after 72 h and the strain recovery calculated. 4–5 replicates were used.
Infrared spectroscopy (IR)
Fourier transform infrared spectra (32 scans) were recorded on the parallelepiped-shaped specimens and the different powder fractions using a Spectrum 2000 FTIR spectrometer, Perkin-Elmer inc., USA, equipped with a single reflection ATR accessory, Golden Gate from Specac Ltd. Centerpieces of the parallelepiped specimens were cut into smaller shapes of ca. 10 × 10 × 4 mm3 and the spectra were recorded by compressing the foams tightly between a sapphire anvil and the ATR crystal. All specimens were dried in a desiccator cabinet over silica gel for at least 72 h before being tested.Size-exclusion high-performance liquid chromatography (SE-HPLC).
The amount of soluble protein in the fractions and foams was determined using the three-step extraction procedure developed by Gällstedt et al.19; this method extracts proteins soluble in dilute (0.5%) sodium dodecyl sulphate (SDS) in the first step, proteins soluble in SDS together with a short (30 s) sonication in the second step, and proteins soluble in SDS with repeated sonication (30+60 s) in the third step. Whole parallelepiped-shaped foam specimens were cut into smaller pieces to facilitate protein extraction.17 Sonication was carried out using an ultrasonic disintegrator, with an amplitude of 5 and a 3 mm exponential microtip (soniprep 150, Tamro). To measure the amounts of polymeric and monomeric proteins extracted in each step, the proteins were separated by SE-HPLC, using a Waters HPLC system and a BIOSEP SEC-4000 Phenomenex column.20 As in previous investigations, the chromatograms were divided into monomeric and polymeric proteins based on the elution times and the area under the chromatogram was used to determine the amount of extractable proteins.19,21 Three replicates were analyzed of each sample.Confocal laser scanning microscopy (CLSM)
Foams were examined with confocal laser scanning microscopy (CLSM) according to the method of Blomfeldt et al.,17 with some modifications. Immunostaining. ≤ 0.5 mm thick and ca. 1.5 × 1.5 mm2 wide specimens were cut with a scalpel from the middle part of the AG foam and from the top layer of the other foams. The selected foam specimens were blocked for 3 h under ambient conditions in 10% (w/v) bovine serum albumin (BSA) in Tris-buffered-saline Tween (TBS-T) at pH 7.5 in Eppendorf tubes without any shaking. After 3 h the blocking solution was removed and the specimens were incubated overnight under ambient conditions with a mixture of two primary antibodies, a monoclonal antibody for the high-molecular-weight glutenin subunits (HMW-GS) 2, 5, 10, 12, and a polyclonal antibody, derived from rabbit (IgG antiserum, dilution 1![[thin space (1/6-em)]](https://www.rsc.org/images/entities/char_2009.gif) :
:![[thin space (1/6-em)]](https://www.rsc.org/images/entities/char_2009.gif) 500; Sigma), for the gliadins. After overnight incubation, the foam samples were washed with TBS-T (6 × 15 min) and incubated with two secondary antibodies, Alexa 488 and Alexa 546, for 4 h under ambient conditions. The specimens were then washed with TBS-T (3 × 15 min) followed by millipore water (3 × 15 min). The washing in TBS-T after incubation of the two secondary antibodies was not performed in the previous work, in order to preserve the foam structures.17 In this study, however, the samples (except for the gliadin-rich foam) were found to tolerate the washing. All the incubations and washings were made without agitation in order to preserve the structure of the foams.
500; Sigma), for the gliadins. After overnight incubation, the foam samples were washed with TBS-T (6 × 15 min) and incubated with two secondary antibodies, Alexa 488 and Alexa 546, for 4 h under ambient conditions. The specimens were then washed with TBS-T (3 × 15 min) followed by millipore water (3 × 15 min). The washing in TBS-T after incubation of the two secondary antibodies was not performed in the previous work, in order to preserve the foam structures.17 In this study, however, the samples (except for the gliadin-rich foam) were found to tolerate the washing. All the incubations and washings were made without agitation in order to preserve the structure of the foams.
Small-angle X-ray scattering (SAXS)
The small-angle X-ray scattering experiments were carried out using the beamlines I71122 and I911–423 at the MAX-lab Synchrotron, Lund University. Monochromatic beams with a wavelength of λ = 1.2 Å (beamline I711) and λ = 0.91 Å (beamline I911–4) were used. The range in the scattering vector: q = 4π/λ sin(θ) (2θ is the scattering angle) was approximately 0.008 < q < 0.35 Å−1 in both cases. Two-dimensional images were obtained using an area-CCD detector (active area having a diameter of 165 mm) from Marresearch GmbH, using an exposure time of either 5 or 1 min. The X-ray beam penetrated the foams in the height direction. In addition, the G, 50/50, 25/75 and the gliadin-rich foams were scanned horizontally at different positions along the height of the whole foams. The X-ray scattering data were processed using the graphical user interface bli911–4.22,23 In order to be able to compare the scattering intensities from different samples, the data were normalized with respect to the integrated intensity incident on the specimen during the exposure, and corrected for sample absorption, parasitic scattering and detector background.Wide-angle X-ray scattering (WAXS)
The wide-angle X-ray scattering measurements were performed at the 911–2 beamline at the MAX-lab Synchrotron, Lund University.24 The samples were irradiated with the X-ray beam in the height direction. The wavelength was 1.04 Å, and the sample-to-detector distance was 149.8 mm. Silicon powder was used as a calibration standard for peak positions. Two-dimensional images were registered using an area-CCD detector (active area diameter: 165 mm, Marresearch GmbH) with 5 min of data acquisition. Parasitic scattering was subtracted from all the diffractograms.Results and Discussion
The extraction of glutenin- and gliadin-rich fractions
Fig. 1 shows powder particles from the glutenin-rich fractions. The glutenin fraction from the aged gluten powder (AG fraction) contained, in contrast to the G fraction, a considerable amount of large protein particles. These particles, probably consisting of highly aggregated glutenin molecules, were difficult to disperse and clearly influenced the properties of the final foam.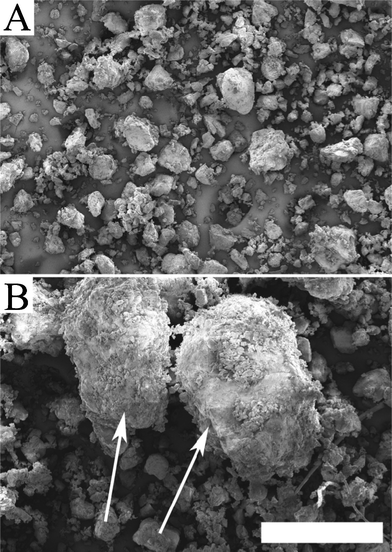 | ||
| Fig. 1 FE-SEM images of the powder of (A) the G fraction and (B) the AG fraction. The large particles in the AG powder are indicated by arrows. The scale bar is 500 μm. | ||
Density
The dispersions had different viscosities and had consequently experienced different degrees of expansion during the mixing stage. The low viscosity gliadin–water mixture expanded more than its glutenin counterpart (G foam) and its foam density was consequently lower (cf. the 0% and 100% values in Fig. 2). It should be pointed out that the foam structure obtained and the foamability also depend upon the surface tension of the liquid at the liquid–air interface.25 The gliadins show a higher surface activity than the glutenins, resulting in a lower surface tension because of their ability to absorb air at the air–liquid interface.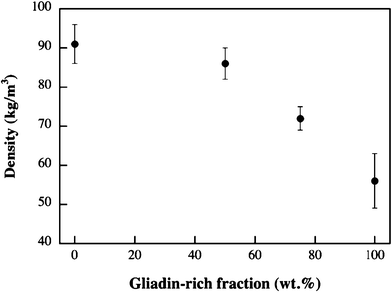 | ||
| Fig. 2 The foam density of the single components and the blends of the G fraction and the gliadin-rich fraction. | ||
The AG fraction was difficult to mix with water because of the high viscosity. The subsequent expansion was small and its density was consequently high (159 ± 11 kg m−3). The aqueous G fraction was, however, of lower viscosity and its greater expansion led to a density lower than that of the AG fraction (0% value in Fig. 2). Fig. 2 shows that the density of the foams made from the mixtures of the G fraction and the gliadin-rich fraction decreased non-linearly with increasing gliadin content. Within the 50–100% gliadin region, however, the decrease seemed to be a linear function of the gliadin content.
FE-SEM
The FE-SEM analysis of the foam cross-sections revealed a great difference in cellular structure among the samples. Fig. 3 shows the cellular structure of the foams made from the two glutenin fractions. In general these foams had a more compact and closed cell structure than the gliadin-containing foams, although there were also large differences between them. The AG foam structure was quite heterogeneous, containing both foamed regions and more solid-like unfoamed regions, indicated with arrows in Fig. 3A. The latter regions may have originated from the larger aggregates observed in Fig. 1B. The G foam, in contrast to the AG foam, had a more uniform cell structure without these solid regions.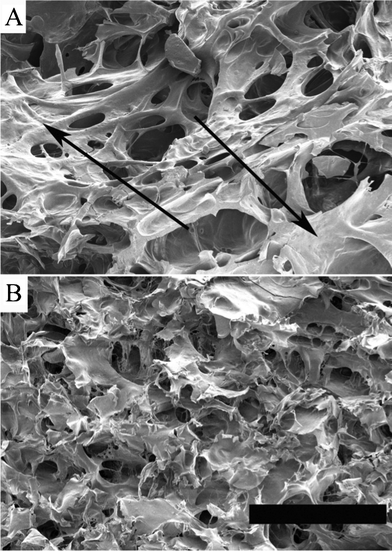 | ||
| Fig. 3 FE-SEM images of the cellular structure of a) the AG foam (arrows indicate unfoamed areas) and b) the G foam. The scale bar is 300 μm. | ||
When the concentration of gliadin was increased, both the cell size and the open porosity increased, as can be seen by comparing the cellular structure in the 50/50 (Fig. 4B) and the 25/75 (Fig. 4B) foams. The foam made of 100% of the gliadin-rich fraction (Fig. 4C) had the largest and most continuous open cells. The presence of large continuous cells explained why it was possible to “see” into parts of these foams.
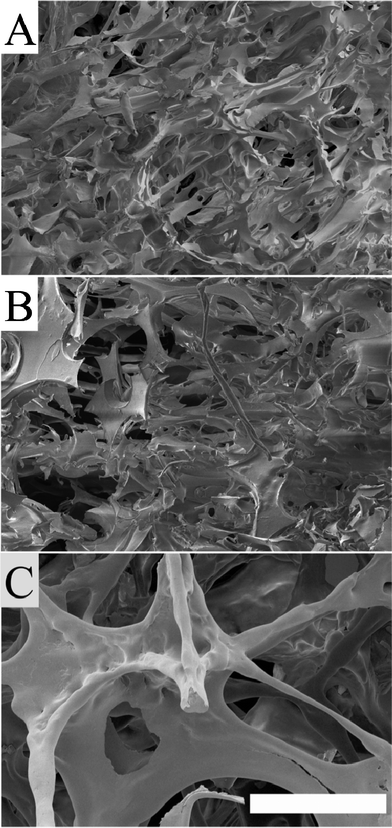 | ||
| Fig. 4 FE-SEM images showing the cellular structure of: a) the 50/50 foam, b) the 25/75 foam and c) the gliadin-rich foam. The scale bar is 300 μm. | ||
Compression testing
The stress–strain curves were divided into three sections (Fig. 5: I, II, III): I – a linear elastic deformation at low stresses, II – cell collapse indicated by a small slope and III – densification at large strains.17 A considerable difference in the compressive behaviour at large strains was observed for the foams. The glutenin-rich foams were stiffer than the foams containing the gliadin-rich fraction. In fact, for the AG foam, it was impossible with the 500 N load cell to compress the foam to 80%, and the experiment had to be halted at a load of 495 N (ca. 75% compression) in order to avoid exceeding the maximum load of the load cell. The elastic moduli of the different foams were calculated as the maximum “linear” slope of the compressive stress–strain curves in the linear-elastic region.17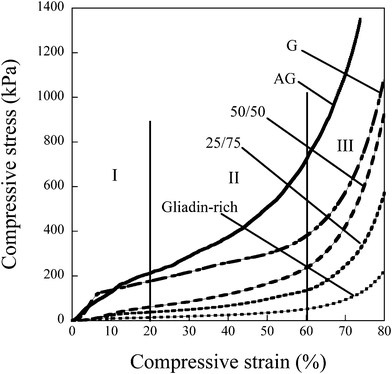 | ||
| Fig. 5 Compressive stress–strain curves divided into three regions17: (I) The primary linear region at low stresses, (II) the cell-collapse region, and (III) the densification region. Curves are examples from multiple tests. | ||
Remarkably, the glutenin foams (regardless of fraction) had a modulus that was on average 12 times greater than that of the gliadin-rich foam. The effect of the foam density on the foam modulus has been predicted on both open and closed cell foams (see e.g.refs 26–33). The foam modulus as a function of the foam density can be described by eqn 1.27
| ES/EM = φ2 (ρS/ρM)2 + (1 − φ) (ρS/ρM) | (1) |
where E is the modulus and ρ is the density. Indices S and M refer to, respectively, the specimen and the matrix/solid material. The fitting parameter φ corresponds to the fraction of the matrix material acting as struts. It takes a value of 1 for an open cell foam whereas for a closed cell foam a value of 0.85–0.9 has given good agreement between experimental and modelled data of polystyrene, polypropylene and polyurethane foams.27,28 The latter values indicate that 85–90% of the material exists as struts and 10–15% of the material as lamellae.
Although the change in density was relatively small between 100% and 50% glutenin (Fig. 2), the decrease in modulus was substantial (Table 2) and could not be described by eqn 1. The reasons were most probably that the content of closed cells increased with increasing density and that the glutenin foams were more aggregated/polymerized leading to stiffer cell walls.
| Foams | Elastic modulus | Moisture content | Strain Recovery |
|---|---|---|---|
| kPa | % | % | |
| a ±-values are standard deviations. b Note that this strain recovery was calculated after 75% compression, and the others after 80% compression. | |||
| AG | 3 500 ± 1 200 | 4.6 ± 0.1 | 22.2 ± 4.8b |
| G | 3 400 ± 550 | 3.2 ± 0.2 | 21.5 ± 5.3 |
| 50/50 | 600 ± 80 | 3.0 ± 0.4 | 20.1 ± 3.3 |
| 25/75 | 390 + 50 | 3.1 ± 0.2 | 20.5 ± 4.0 |
| Gliadin-rich | 270 ± 80 | 4.2 ± 0.1 | 20.1 ± 3.3 |
The very large variation in modulus of the AG foams was in agreement with their uneven cellular structure (Fig. 3A).
In the II-region (Fig. 5), where cell collapse occurs, it was possible to note further differences. The gliadin-rich foam with its large open cellular structure and thin cell walls (Fig. 4C) was easiest to deform plastically and the stress–strain curve in this region was almost horizontal.
The foam samples were also evaluated with respect to their ability to recover after being subjected to a large strain (Table 2). There were no significant differences between the samples as they all showed, in general, a recovery of ca. 20%. This was similar to what was reported for the wheat gluten foams in the previous study17 and the relatively low value was expected since none of the foams were plasticized. It could thus be concluded that the type of protein fraction present in the foam had no significant effect on the ability of the foam to recover from a large strain.
Table 2 also shows the moisture content of the foams prior to compression testing. It was observed that there was no correlation between the moisture content and the modulus or strain recovery data.
Infrared spectroscopy
The amide I region (1600–1700 cm−1) was studied because of its documented sensitivity to changes in the protein secondary structure.17,34–41Fig. 6A shows the spectra of the three fractions and they all showed different features. The AG fraction showed numerous peaks/shoulders in the vicinity of 1688, 1657, 1652, 1638, 1625 and 1610 cm−1. The proposed assignments of these peaks were as follows: 1688 (β-turns38), 1658 (α-helices39), 1652 (α-helices/random coil40), 1638 and 1625 (β-sheets35) and 1610 cm−1 possibly also due to β-sheets.39 The G fraction was more featureless, having a peak at 1652 cm−1 (α-helices/random coil34) and a broad shoulder between ∼1618 and ∼1650, the latter indicative of the presence of mainly β-sheets although random coil structures contribute to the intensity in this region. The gliadin-rich fraction showed a spectrum skewed towards a maximum at 1652 cm−1, again due to α-helices with a possible contribution from random coil structures.34 The differences between the spectra of the gliadin-rich and the G fractions indicated that the G fraction was more aggregated (more β-sheets) than the former. The foam process changed the spectrum of the AG material substantially, with several peaks disappearing (cf.Fig. 6A and B). On the other hand, the G foam spectrum (Fig. 6B) and the gliadin-rich foam spectrum (Fig. 6C) were similar to those of the corresponding fractions, indicating, in agreement with previous work, that the mild heat treatment during the foam preparation led to no extensive aggregation of the proteins.17 The exception seemed to be the AG fraction, which underwent substantial changes as shown in the IR spectrum as well as in the protein solubility (see below). The 25/75 and 50/50 blends showed features of both the gliadin-rich and the G foams (Fig. 6B,C).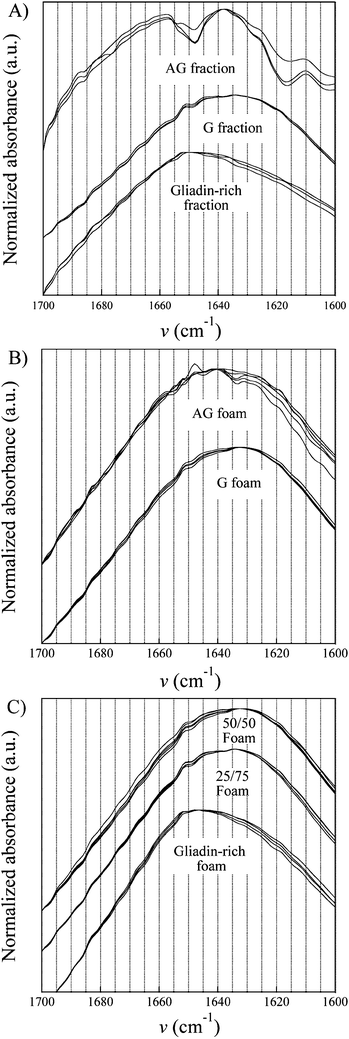 | ||
| Fig. 6 Infrared spectra of the different samples. | ||
Size-exclusion high-performance liquid chromatography
Fig. 7 shows the protein solubility. The highest solubility was observed for the gliadin-rich fraction. The extraction behaviors of the AG and the G fractions were quite different. In the case of G, a significant amount of proteins were dissolved in the first SDS treatment, whereas in the case of AG, most proteins, being mainly polymeric, were dissolved in the last SDS/sonication treatment. This, together with the higher total solubility of the G fraction, indicated that the AG fraction was more polymerized. It is noteworthy that the difference in solubility behaviour between the three extraction steps of the G and AG fractions was similar to that observed between the two gluten powders. The highest solubility after the first and third extraction steps was observed for, respectively, the gluten and “aged” gluten powders. Not surprisingly, the lowest total protein solubility was observed for the readily aggregated AG foam.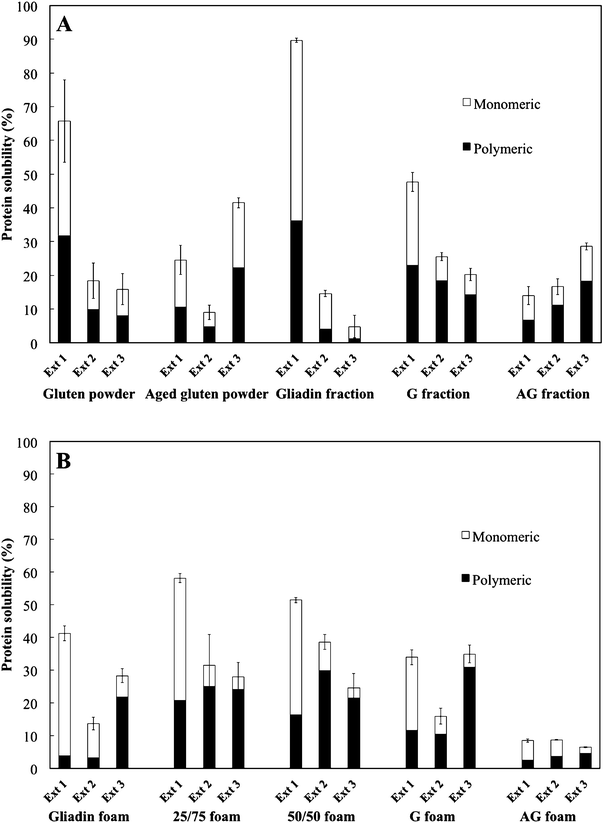 | ||
| Fig. 7 The protein solubility of (A) the powders and fractions and (B) of the foams. All values are relative to the total solubility of the unaged wheat gluten powder in Fig. A (Ext1+Ext2+Ext3). Ext 1 refers to the first extraction with SDS, Ext 2 to the extraction in SDS with a 30 s sonication, and Ext 3 to the SDS extraction with repeated sonication (30+60 s). | ||
The gliadin-rich and the 25/75 and the 50/50 foams all had a higher solubility of monomeric proteins, especially after the first extraction step, than the G foam, indicating that the gliadins were not intermolecularly bonded to the glutenins during the foaming process. One reason for the low aggregation of the gliadins with the glutenins might be the mild heat treatment.14 The lower total extractability of the gliadin-rich foam than of the gliadin-rich fraction indicated, however, that some aggregation/crosslinking had occurred during the foaming operation.
CLSM
Relatively small or no differences in protein structure were found between the foams containing the G fraction, i.e. the G, 25/75 and 50/50 foams (Fig. 8 and 9). However, differences were found between the AG foam (Fig. 8D) and all the other foams (Fig. 8A–C and 9), due to the aggregates present in the AG foam. It should be pointed out that the gliadin-rich foam collapsed in the aqueous blocking solution and was not therefore analyzed. In the 25/75 foam, glutenins dominated with almost no gliadins present (Fig. 9B). An explanation could be that most of the gliadins were “washed” away during the immunological treatment, although this was not always the case (arrow 2, Fig. 9D).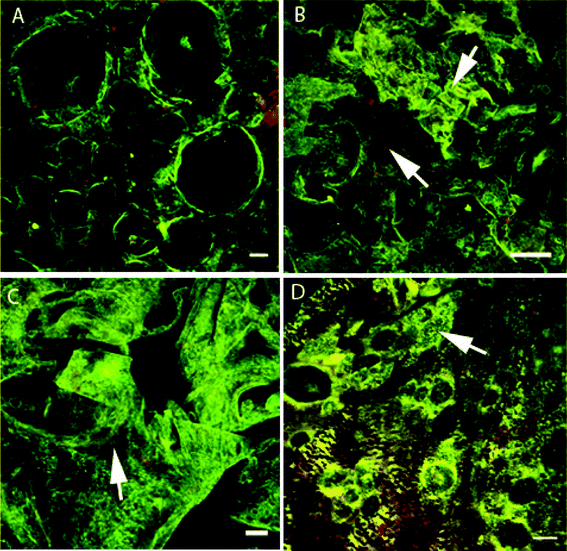 | ||
| Fig. 8 CLSM images of (A–C) the G foam selected from the “top” layer and (D) a cross-section of the AG foam. Arrows in B indicate gliadin (red) and glutenin (green) areas and the arrow in C indicates glutenin-rich areas with some gliadins present. The structure containing glutenin-rich islands, which are probably residual aggregates, is also indicated in D. The scale bars are 50 μm (A,C), 100 μm (B) and 20 μm (D). | ||
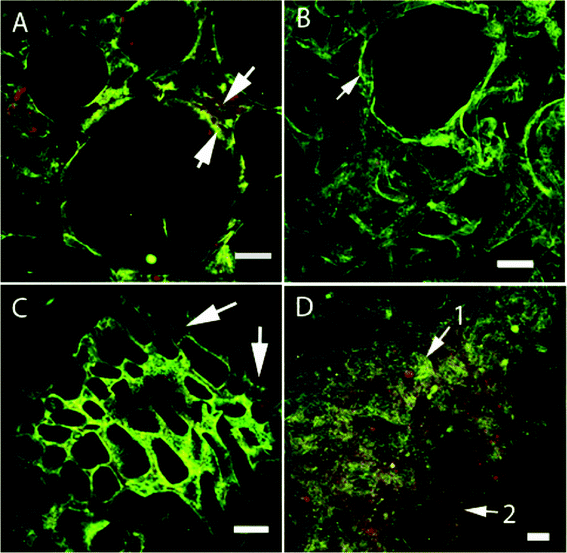 | ||
| Fig. 9 CLSM images of (A,C) the 25/75 and (B,D) the 50/50 foams. In A, the lower and upper arrows point, respectively, at glutenins (green) and gliadins (red), situated around the pore. The arrow in B points to a glutenin-rich region (green) and the arrows in C point to gliadin-rich (red) regions. In D, a glutenin-rich region (green) is indicated by arrow 1 and a gliadin-rich region (red) by arrow 2. The lengths of the scale bars are 100 μm (A) and 50 μm (B–D). | ||
In the glutenin foams, HMW-GS (green) was clearly present, but gliadins (red) were also present (Fig. 8). The presence of gliadins suggested that a certain amount of gliadins were bonded to the glutenins and were not dissolved during the protein fractionation with the aqueous ethanol. This was also indicated by the results of the extraction in SDS, where both glutenin fractions and foams contained extractable monomeric proteins (AG and G, Fig. 7). In the AG foam (Fig. 8D) it was possible to see large glutenin-rich “islands” which were probably residuals of the initial aggregates observed in the FE-SEM (Fig. 3A).
The 25/75 and 50/50 foams showed similarities to the glutenin-rich foams with a protein structure consisting of both HMW-GS (arrow 1, Fig. 9D) and gliadin (arrow 2).
SAXS and WAXS
Previous SAXS data for wheat gluten films indicated the presence of “protein assemblies” arranged in periodic nanostructures.16 These structures, characterized by multiple SAXS peaks, inspired us to see whether similar structures also developed in the foams. However, only one clear correlation peak was observed for all the foams (Fig. 10A). Note that, for clarity, the SAXS intensity I is plotted as I·q2. The peak was undeveloped (low intensity and large peak width) at high glutenin contents (G and 50/50 foams), but for the 25/75 and the gliadin-rich foams it was more developed (high intensity and smaller peak width). The correlation peak was not detected for the highly aggregated AG foam. The correlation distance was d = 41.5 Å for both the G and the 50/50 foams, and d = 43 Å for the 25/75 and gliadin-rich foams (d = 2π/qmax, where qmax is the peak position). Fig. 10B shows that the peak position varied only slightly from the top (z = 10 mm) to the bottom (z = 0 mm) of the gliadin-rich foam. The corresponding change in peak position was also small in the G foam (not shown). However, in the lower-most 1–2 mm of the 25/75 and 50/50 foams, the SAXS curves were broad with a shoulder or peak at low q-values (d ≤ 85 Å) (not shown). The reason for this peculiar X-ray scattering is not known, but since it appeared only for the blends it is probable that a “segregated” structure developed in the lower-most regions of these foams. It is important to note that it was not probable that the cell structure itself gave correlation peaks in these SAXS detection regions, since the cells were significantly larger in size (Figs 3 and 4) than the correlation distances reported here.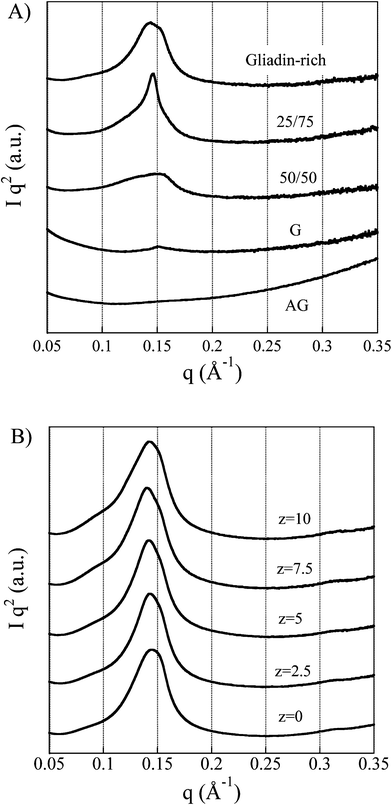 | ||
| Fig. 10 A) SAXS profiles with the beam penetrating the foam in the thickness direction. B) SAXS profiles of the gliadin-rich specimen sampled from top to bottom (z is the distance from the bottom to the top). | ||
It is of interest here to compare the correlation distances obtained in the present study with those obtained for other wheat gluten systems. Extruded films aggregated with the help of NaOH showed a tetragonal structure with correlation distances (unit cell parameters) of 51.9 and 40.7 Å.16 Extruded films aggregated with NH4OH and also containing salicylic acid showed a bidimensional hexagonal close-packed structure with the lattice parameter a = 70 Å and also a broad shoulder with a peak at ca. 80 Å.16 A gliadin-rich foam obtained from the aged gluten powder showed two peaks at 40.4 and 50.1 Å and a gliadin-rich film showed a peak at 40.4 Å (unpublished results). Hence it seems that the peak occurring at 40–43 Å in the present foams originated from the same scattering objects. Since this peak occurred in both foams and films it was not related to the cell structure itself but must have been associated with the protein matrix. The fact that the correlation peak was small, or absent, in the glutenin foams, seems to indicate that the peak originated from the protein structure associated with gliadin and was probably connected to the fibrillated/aggregated ordered structures of gliadins reported by Kasarda et al.42 and by Bernardin et al.43
WAXS profiles of all the foams are presented in Fig. 11. Two strong diffuse peaks, with an average d-spacing of 9.4 (peak 1) and 4.5 Å (peak 2), were observed. These characteristic distances have been reported to originate from the α-helix structures of the wheat gluten proteins.44 The larger d-spacing is related to the average distance of neighboring helices (inter-helix distance) whereas the shorter one is associated with the average backbone distance within the helix.44 No significant differences were found between the peak positions of the different diffraction curves, which indicated that all the foams contained the same type of inter-helix arrangement. However, the width of the first peak as well as the intensity ratio of the two peaks for the AG and G foams were evidently different from those of the gliadin-rich foam (Fig. 11). The wider 9.4 Å peak for the glutenins (AG and G) suggested that they contained more disordered arrays of α-helices than the gliadin-rich material. The smaller ratio between the 9.4 and 4.5 Å peaks also indicated that the glutenins contained less α-helices, as indicated by the IR data. We here assume that the 4.5 Å peak also originated from the backbone distance of structures other than the α-helix. Finally it should be noted that the WAXS peaks were too broad to originate from a crystalline structure, suggesting that the protein foams were amorphous.
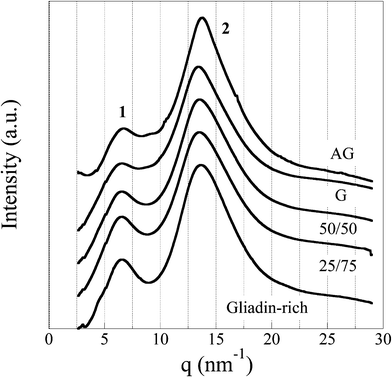 | ||
| Fig. 11 WAXS profiles of all the foam samples. | ||
Conclusion
For the greater polymer foam community it is of interest here to note that the properties of protein foams like those prepared from wheat gluten can be tailored, apart from varying the foaming process and choice of additives, by elaborating with the protein chemistry and protein components. The present work has shown that it is possible to aim for a specific/different density, and hence specific mechanical properties, of freeze-dried foams by adjusting the glutenin and gliadin contents. Glutenins contribute with a stiffer material that is more difficult to expand and consequently leads to a higher density. The gliadins contribute with a lower modulus and a lower density. The very large difference in modulus between the 50/50 and the glutenin-rich sample was not accompanied by the same large difference in density. This indicates that, besides the actual density, the stiffness of the material in the cell walls, which was improved by greater protein polymerization, also plays a key role. Possibly also the higher content of closed cells in the glutenin-rich foams played an important role.The mild heat treatment during the foam production seemed mainly to affect the degree of aggregation of the AG fraction. The low degree of gliadin aggregation led to a high expansion during foaming but at the same time a more brittle structure that dissolved on treatment with the aqueous blocking solution.
The SAXS results showed one correlation peak with a characteristic distance of 40–43 Å originating from the gliadin material. WAXS revealed that the correlation peak was due to an amorphous protein structure. In addition, WAXS indicated a more regular inter-helix molecular packing in the gliadin-rich material as compared to the glutenin-rich material.
Acknowledgements
María Luisa Prieto-Linde at SLU, Alnarp, Sweden, is thanked for her valuable technical assistance with the glutenin and gliadin extractions and with the SE-HPLC measurements.References
- E. Johansson, M. L. Prieto-Linde and J. Jönsson, Cereal Chem., 2001, 78, 19–25 CrossRef CAS.
- P. L. Weegels, R. J. Hamer and J. D. Schofield, J. Cereal Sci., 1996, 23, 1–18 CrossRef CAS.
- T. O. J. Blomfeldt, R. T. Olsson, M. Menon, D. Plackett, E. Johansson and M. S. Hedenqvist, Macromol. Mater. Eng., 2010, 295, 796–801 CrossRef CAS.
- B. Ahlbacka, GAIN Report, Number:SW9008, USDA Foreign Agricultural Service, June, 2009, 24. Search PubMed.
- S. Domenek, L. Brendel, M.-H. Morel and S. Guilbert, Biomacromolecules, 2004, 5, 1002–1008 CrossRef CAS.
- N. Reddy and Y. Yang, Biomacromolecules, 2007, 8, 638–643 CrossRef CAS.
- T. Abonyi, I. Kirván, S. Tömösközi, O. Baticz, A. Guóth, S. Gergely, É. Sholz, D. Lásztity and R. Lásztity, J. Agric. Food Chem., 2007, 55, 3655–3660 CrossRef CAS.
- B. Lagrain, B. Goderis, K. Brijs and J. A. Delcour, Biomacromolecules, 2010, 11, 533–541 CrossRef CAS.
- R. Auvergne, M.-H. Morel, P. Menut, O. Giani, S. Guilbert and J.-J. Robin, Biomacromolecules, 2008, 9, 664–671 CrossRef CAS.
- B. Lagrain, K. Brijs and J. A. Delcour, J. Agric. Food Chem., 2008, 56, 10660–10666 CrossRef CAS.
- P. Hernández-Muñoz, A. Kanavouras, P. K. W. Ng and R. Gavara, J. Agric. Food Chem., 2003, 51, 7647–7654 CrossRef.
- M. Pommet, M.-H. Morel, A. Redl and S. Guilbert, Polymer, 2004, 45, 6853–6860 CrossRef CAS.
- M.-H. Morel, A. Redl and S. Guilbert, Biomacromolecules, 2002, 3, 488–497 CrossRef CAS.
- B. Lagrain, I. Rombouts, K. Brijs and J. A. Delcour, J. Agric. Food Chem., 2011, 59, 2034–2039 CrossRef CAS.
- H.N. Ullsten, M. Gällstedt, G. M. Spencer, E. Johansson, S. Marttila, R. Ignell and M.S. Hedenqvist, Polym. Renewable Resour., 2010, 1, 173–186 Search PubMed.
- R. Kuktaite, T. S. Plivelic, Y. Cerenius, M. S. Hedenqvist, M. Gällstedt, S. Marttila, R. Ignell, Y. Popineau, O. Tranquet, P.R. Shewry and E. Johansson, Biomacromolecules, 2011, 12, 1438–1448 CrossRef CAS.
- T. O. J. Blomfeldt, R. Kuktaite, E. Johansson and M. S. Hedenqvist, Biomacromolecules, 2011, 12, 1707–1715 CrossRef CAS.
- T. O. J. Blomfeldt, F. Nilsson, T. Holgate, J. Xu, E. Johansson and M. S. Hedenqvist, ACS Appl. Mater. Interfaces, 2012, 4, 1629–1635 CAS.
- M. Gällstedt, A. Mattozzi, E. Johansson and M. S. Hedenqvist, Biomacromolecules, 2004, 5, 2020–2028 CrossRef.
- I. Olabarrieta, S.-W. Cho, M. Gällstedt, J. R. Sarasu, E. Johansson and M. S. Hedenqvist, Biomacromolecules, 2006, 7, 1657–1664 CrossRef CAS.
- H. N. Ullsten, M. Gällstedt, E. Johansson, A. Gräslund and M. S. Hedenqvist, Biomacromolecules, 2006, 7, 771–776 CrossRef.
- M. Knappila, C. Svensson, J. Barauskas, M. Zackrisson, S. S. Nielsen, K. N. Toft, D. Vestergaard, L. Arleth, U. Olsson, J. S. Pedersen and Y. J. Cerenius, J. Synchrotron Radiat., 2009, 16, 498–504 CrossRef.
- T. S. Plivelic, A. L. Labrador, K. Theodor, Y. Gapnonov, C. Svensson, J. Nygaard, Y. Cerenius, Proceedings of the 8th Nordic Workshop on Scattering from Soft Matter, 2011, Kjeller-Norway. Search PubMed.
- C. B. Mammen, T. Ursby, Y. Cerenius, M. Thunnissen, J. Als-Nielsen, S. Larsen and A. Liljas, Acta Phys. Pol., A, 2002, 101, 595 CAS.
- B. G. Thewissen, I. Celus, K. Brijs and J. A. Delcour, J. Agric. Food Chem., 2011, 59, 1370–1375 CrossRef CAS.
- L. J. Gibson, M. F. Ashby, Cellular Solids, Cambridge University Press, Cambridge, 1997 Search PubMed.
- F. Ramsteiner, N. Fell and S. Forster, Polym. Test., 2001, 20, 661–670 CrossRef CAS.
- S. H. Goods, C. L. Neuschwanger, L. L. Whinnery and W. D. Nix, J. Appl. Polym. Sci., 1999, 74, 2724–2736 CrossRef CAS.
- Y. Zhang, D. Rodrigue and A. Ait-Kadi, J. Appl. Polym. Sci., 2003, 90, 2120–2129 CrossRef CAS.
- F. Saint-Michel, L. Chazeau, J.-Y. Cavaillé and E. Chabert, Compos. Sci. Technol., 2006, 66, 2700–2708 CrossRef CAS.
- W.-Y. Jang, A. M. Kraynik and S. Kyriakides, Int. J. Solids Struct., 2008, 45, 1845–1875 CrossRef.
- L. Gong, S. Kyriakides and W.-Y. Jang, Int. J. Solids Struct., 2005, 42, 1355–1379 CrossRef.
- A. P. Roberts and E. J. Garboczi, J. Mech. Phys. Solids, 2002, 50, 33–55 CrossRef.
- S.-W. Cho, M. Gällstedt, E. Johansson and M. S. Hedenqvist, Int. J. Biol. Macromol., 2010, 48, 146–152 CrossRef.
- P. I. Haris and F. J. Severcan, J. Mol. Catal. B: Enzym., 1999, 207–221 CrossRef CAS.
- C. Mangavel, J. Barbot, Y. Popineau and J. Guéguen, J. Agric. Food Chem., 2001, 49, 867–872 CrossRef CAS.
- D. M. R. Georget and P. S. Belton, Biomacromolecules, 2006, 7, 469–475 CrossRef CAS.
- S. P. Makarenko, V. A. Trufanow and T. E. Putilina, Russ. J. Plant Physiol., 2002, 49, 365–370 CrossRef.
- N. Wellner, E. N. C. Mills, G. Brownsey, R. H. Wilson, N. Brown, J. Freeman, N. G. Halfrod, P. R. Shewry and P. S. Belton, Biomacromolecules, 2005, 5, 255–261 CrossRef.
- J. T. Pelton and L. R. McLean, Anal. Biochem., 2000, 277, 167–176 CrossRef CAS.
- H. N. Ullsten, S.-W. Cho, G. Spencer, M. Gällstedt, E. Johansson and M. S. Hedenqvist, Biomacromolecules, 2009, 10, 479–488 CrossRef.
- D. D. Kasarda, J. E. Bernardin and R. S. Thomas, Science, 1967, 155, 203–205 CAS.
- J. E. Bernardin, D. D. Kasarda and D. K. Mecham, J. Biol Chem., 1967, 10, 445–450 Search PubMed.
- N. H. Thomson, M. J. Miles, Y. Popineau, J. Harries, P. R. Shewry and A. S. Tatham, Biochim. Biophys. Acta, Protein Struct. Mol. Enzymol., 1999, 1430, 359–366 CrossRef CAS.
| This journal is © The Royal Society of Chemistry 2012 |
