RNA templated water soluble Mg2+/PbSe porous nanostructures with dual fluorescence†
Anil
Kumar
* and
Bhupender
Singh
Department of Chemistry, Indian Institute of Technology Roorkee, Roorkee - 247667, India. E-mail: anilkfcy@iitr.ernet.in; Fax: +91-1332-273560; Tel: +91-1332-285799
First published on 24th August 2012
Abstract
This paper reports the synthesis and photophysics of quantized porous RNA mediated Mg2+/PbSe nanohybrids. These particles display an onset of absorption at 1.03 eV and dual fluorescence in both the red region and NIR range (700–1150 nm). The quantum efficiencies of fluorescence in the red and NIR regions are observed to be 0.02 and 0.38, respectively. The presence of Mg2+ induces new supramolecular interactions among the RNA matrix, Pb2+ and PbSe bringing a change in the morphology from spherical to porous. Interactions among different components have been analyzed by using electronic, IR and NMR spectroscopy and morphological changes have been investigated by performing AFM, FE-SEM and TEM analysis. Based on these investigations a scheme for the generation of porosity in these nanohybrids has been proposed. The presence of Mg2+ results in increased oscillator strength in PbSe enhancing the absorption coefficient in both the visible and NIR ranges, which makes them suitable for solar energy conversion devices. The confinement of PbSe in the porous nanostructures induces the non-radiative relaxation populating shallow traps resulting in the blue shifted fluorescence associated with a reduction in the intensity and fluorescence lifetime. The dual fluorescence observed in the red and NIR ranges, having fairly long lifetimes of 204 and 24 ns, respectively, makes them suitable for biomedical and clinical applications, specifically for the bioimaging of tissues.
1. Introduction
Biopolymers having long range nanoscale orders and large functionalities have been considered to be an attractive matrix for synthesizing inorganic nanomaterials with varied morphologies, dimensionalities and enhanced physicochemical properties.1,2 Over the last decade a large number of investigations have focused on biotemplated inorganic materials due to their increased functionality, solubility and biocompatibility with enhanced properties. In recent years synthesis of Q–PbSe nanostructures have attracted wide attention because of their potential technological applications3–5 in the area of the fabrication of solar energy devices,6–8 field effect transistors9 and fluorescence imaging.10,11 Most of the previous studies on the synthesis of PbSe nanoparticles have been carried out in non-aqueous medium at high temperature12–15 following the method developed from the laboratory of Murray et al.15 PbSe nanoparticles in non-aqueous medium were found to grow with a regular change in their optical absorption and fluorescence behavior over a period of a few hours.12In previous investigations on this system,10,12–15 a number of capping agent(s)/solvent(s) have been employed, viz. oleic acid/toluene, chloroform;10 oleic acid/tetrachloroethylene;12 oleic acid/toluene, chloroform, hexane;13 oleic acid/hexane14 and oleic acid/diphenyl ether.15 We have come across only a very few reports on the synthesis of water soluble PbSe nanostructures.10–12 In these studies also, initially PbSe was capped by oleic acid in the organic medium, thereafter, the oleic acid was replaced by another ligand(s), viz. 11-mercaptoundecanoic acid/amino ethanethiol–HCl;10 (1-mercaptoundec-11-yl)tetra(ethylene glycol)12 and 11-mercaptoundecanoic acid,13 which then could be redispersed into water. But, these particles also demonstrated absorption and fluorescence extending into the NIR range. In a previous communication, we reported colloidal RNA mediated PbSe nanostructures in water having fluorescence in the red region of the visible spectrum.11
Divalent metal cations, viz. Mn2+, Ba2+, Ca2+, Co2+, Mg2+ and Zn2+ are reported to play a key role in the folding of RNA strands by stabilizing their secondary and tertiary structures in living organisms.16 Specifically, Mg2+ is known to have intimate interactions with RNA and has been suggested to bind the Hoogsteen sites of guanine in RNA and is involved in its folding.16–18 This aspect can be explored for bringing a change in the morphology and functionalization characteristics of RNA, which in turn may mediate the morphology of RNA bound PbSe nanostructures and their optical properties. The addition of ≥5 × 10⁻⁵ mol dm−3 of Mg2+ introduces porosity in these nanostructures. These particles display dual fluorescence in the red region and NIR range (700–1150 nm) peaking at 770 and 1010 nm.
2. Experimental section
2.1 Reagents
Ribonucleic acid derived from Torula yeast type VI (RNA) and Se powder (99.99%, 100 mesh) (Sigma); nitrogen gas (Grade 1, purity >99.99%) (Sigma, India), lead acetate (Qualigens), sodium hydroxide and sodium borohydride (Merck), magnesium acetate (SRL), styryl 13 (Exciton) and all other chemicals were of analytical grade and used as received.The used RNA sample was a heterogeneous mixture of RNA molecules of varied molecular weight(s) and length(s), and no specific sequence was employed.
2.2 Equipment
Electronic spectra were recorded on Shimadzu UV2100S and Carry 5000 spectrophotometers in a 1 cm quartz cell. Fluorescence measurements were made on Shimadzu RF-5301PC and Horiba Jobin Yvon Nanolog spectrofluorophotometers equipped with 150 W and 450 W xenon lamp sources, respectively. Surface topography was studied by recording 2D and 3D images of fresh and aged samples of the colloidal solutions by the drop casting method using the tapping mode of an Atomic Force Microscope (AFM). The AFM was equipped with NOVA software for image analysis supplied by M/s Molecular Tools and Devices for Nanotechnology (NT-MDT). Surface morphology and elemental analysis of synthesized nanosystems were performed on a QUANTA 200-FEG digital field emission scanning electron microscope (FE-SEM) coupled with an energy dispersive X-ray analysis (EDAX) facility and CCD camera. Electron micrographs and selected area electron diffraction were measured on an FEI-TECNAI 300 kV digital transmission electron microscope (TEM) with an image analysis system having variable magnifications up to 2![[thin space (1/6-em)]](https://www.rsc.org/images/entities/char_2009.gif) 800
800![[thin space (1/6-em)]](https://www.rsc.org/images/entities/char_2009.gif) 000×. Fluorescence lifetime measurements in the nanosecond time domain were recorded in a 1 cm quartz cell on a Horiba Jobin Yvon “FluoroCube Fluorescence Lifetime System” equipped with NanoLED (635 nm) source. Detection of fluorescence in the UV-visible (300–850 nm) and NIR (950–1700 nm) ranges were made by employing thermoelectrically cooled TBX-04-D and Hamamatsu H10330-75 (No.BB0062) detectors, respectively. The latter was operated at −793 V to detect the emitted photons and the lifetimes were recorded using a cut filter of 830 nm.
000×. Fluorescence lifetime measurements in the nanosecond time domain were recorded in a 1 cm quartz cell on a Horiba Jobin Yvon “FluoroCube Fluorescence Lifetime System” equipped with NanoLED (635 nm) source. Detection of fluorescence in the UV-visible (300–850 nm) and NIR (950–1700 nm) ranges were made by employing thermoelectrically cooled TBX-04-D and Hamamatsu H10330-75 (No.BB0062) detectors, respectively. The latter was operated at −793 V to detect the emitted photons and the lifetimes were recorded using a cut filter of 830 nm.
X-Ray diffraction patterns were recorded on a Bruker AXS D8 Advance X-ray diffractometer (XRD) using the Cu-Kα line (1.5418 Å) of the X-ray source at 40 kV and 30 mA. The diffraction patterns were recorded in the 2θ range of 10° to 90° at a scan rate of 0.02° per step and 0.5 s per step. Infrared (IR) spectra were recorded in KBr medium on a Thermo Nicolet Nexus Fourier Transform Infrared (FTIR) spectrophotometer in the mid IR range (4000–400 cm−1). The proton nuclear magnetic resonance (NMR) spectra were recorded on a Bruker Avance 500 (500 MHz) spectrometer in H2O and D2O media in the ratio of 90![[thin space (1/6-em)]](https://www.rsc.org/images/entities/char_2009.gif) :
:![[thin space (1/6-em)]](https://www.rsc.org/images/entities/char_2009.gif) 10.
10.
2.3 Methodology
Samples for TEM analysis were prepared by applying a drop of the colloidal sample on a carbon coated copper grid G-200 (size 3.05 mm). The excess of colloidal solution was removed with the help of a tissue paper. The coated grid was dried in the dark at room temperature for about 30 min to evaporate the remaining moisture. Electron micrographs of these samples were recorded by scanning the dried grid at different magnifications under the electron microscope at an accelerating voltage of 300 kV. Selected area electron diffraction (SAED) patterns of the colloidal samples were recorded to find out the structure of different phases in the colloidal samples. Indexing of electron diffraction patterns was carried out using a ratio method and Miller indices were then assigned corresponding to different rings.Samples for atomic force microscopy (AFM) were prepared by applying sample sizes of about 15 μL on a glass plate which was subsequently dried at room temperature. For these experiments, the scanning frequency was varied in the range of 1.5 to 3.13 Hz and data were recorded at room temperature (20 ± 2 °C).
It was not possible to carry out EDAX analysis for lower sample size(s) and usually about a three times larger sample size(s) (∼40 μL) had to be employed compared to those for AFM and TEM analysis. At lower sample sizes a burning of sample was noted even after reducing the voltage down to 20 kV. For X-ray diffraction (XRD) and infrared (IR) measurements, solid sample(s) of the as-prepared Mg2+/PbSe were obtained by removing excess of water on a Buchi R-114 Rotavapor at 35 °C from their colloidal solution(s).
The fluorescence decay curves were analyzed using the multi-exponential iterative reconvolution technique, for which the software was provided by IBH. Data analysis was carried out by DAS 6.3 software. In order to understand the observed relaxation dynamics, time resolved emission spectra (TRES) for different samples were recorded for different delays, timings for which were worked out from the respective decay curve(s). TRES analysis was limited to only the visible fluorescence range. Delay(s) for each component were selected from the time slice window, when the relative emission intensity was the maximum for that component.
From the values of τ for different components, the depth of traps was estimated by using the Arrhenius equation in which the activation energy was taken as the trap depth.19 The goodness-of-fit was determined by evaluating χ2 from a plot of the weighted residuals and auto-correlation functions.
Image J software was used for analyzing certain FESEM and TEM images, specifically for 3D viewing of porous structures. For analyzing the porosity in AFM images, NOVA software was used.
2.4 Preparation of PbSe samples in the presence of Mg2+ (Mg2+/PbSe)
Colloidal PbSe containing varied amounts of Mg2+ ((1.0 to 15.0) × 10−5 mol dm−3) were prepared by adding 0.15 ml of 0.1 mol dm−3 lead acetate to a 100 ml deaerated aqueous solution containing 0.022 g RNA at 4 °C, followed by the quick injection of freshly prepared NaHSe.11 It results in the formation of a reddish brown PbSe colloidal solution containing different amounts of Mg2+. To this reaction mixture an excess of lead acetate (1.5 × 10⁻⁴ mol dm−3) was added drop wise to make up the effective concentrations of PbSe and Pb2+ to 1.5 × 10⁻⁴ mol dm−3 each and Pb/Se = 2. The pH of the resulting solution was maintained at 8.5 at each step.Sample SB contained 0.022 g RNA per 100 ml at pH 8.5.
Sample SB1 contained 0.022 g RNA per 100 ml; [Mg2+] = 5.0 × 10⁻⁵ mol dm−3 and [Pb2+] = 3.0 × 10⁻⁴ mol dm−3 at pH 8.5.
Sample SB2 contained 0.022 g RNA per 100 ml; [Mg2+] = 10.0 × 10⁻⁵ mol dm−3 and [Pb2+] = 3.0 × 10⁻⁴ mol dm−3 at pH 8.5.
In all the samples containing Mg2+ in the present work, Mg2+ solution was added prior to addition of Pb2+ solution.
3. Results
3.1 Characterization of RNA mediated Mg2+/PbSe nanostructures
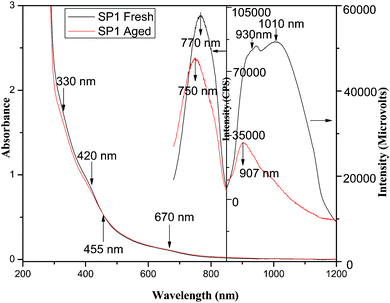 | ||
| Fig. 1 Absorption and fluorescence spectra of SP1: fresh (black), 30 days aged (red). | ||
The fluorescence spectra of these particles upon excitation by 670 nm (1.85 eV) light radiation exhibits the dual fluorescence at 770 nm (1.61 eV) with a FWHM of 93.5 nm (Fig. 1) and a broad band consisting of two peaks at 930 nm (1.33 eV) and 1010 nm (1.23 eV) in the NIR region (Fig. 1). In order to probe the excitation wavelength/energy dependence of fluorescence in the visible and NIR region, 3D excitation–fluorescence spectra were recorded by varying the excitation wavelength from 350–670 nm, and the corresponding fluorescence spectra were monitored in the wavelength range from 680–850 nm (Fig. S1a†) and 850 to 1200 nm (Fig. S1b†), respectively. In the UV-VIS and NIR ranges, the highest fluorescence intensity though corresponded to about 475 nm, but taking into account the absorption coefficient at 475 and 670 nm, the quantum efficiency of fluorescence (ϕfl) was found to be the highest corresponding to λex of 670 nm in the red region at 770 nm (0.02) as well as the NIR region (0.38). The absorption coefficient at 670 nm was about four times less compared to that of at 475 nm. The variations in the intensity of fluorescence at 770 nm and 1000 nm as a function of [Mg2+] are shown in Fig. S1c.† It clearly reveals that a similar variation in the intensity of peak was found to occur in both visible as well NIR regions and both of these curves exhibit the maximum fluorescence intensity corresponding to 5 × 10⁻⁵ mol dm−3 of Mg2+. The optimized sample thus contained: [RNA] = 0.022 g per 100 ml; [Pb2+] = 1.5 × 10⁻⁴ mol dm−3; [Mg2+] = 5 × 10⁻⁵ mol dm−3; [HSe−] = 1.5 × 10⁻⁴ mol dm−3; excess [Pb2+] = 1.5 × 10⁻⁴ mol dm−3 (added after the preparation of stoichiometric PbSe) at pH 8.5 and is abbreviated as SP1. The optical absorption and fluorescence spectra of this sample in the UV-VIS and NIR range are shown in Fig. 1.
Aging of SP1 for a period up to 30 days results in a gradual decrease in the absorption coefficient in the visible region along with a simultaneous, negligibly small increase in the NIR region depicting an isosbestic point (wavelength at which molar absorptivity remains the same) at 455 nm, without causing any shift in the absorption peak(s) (Fig. 1). The excitation of this sample by 670 nm light produces a blue shifted fluorescence peak at 750 nm with a reduction of about 20% in its intensity compared to that of the fresh solution at this wavelength (Fig. 1), whereas the fluorescence at 1010 nm is reduced significantly to produce a new peak at 907 nm and results in a much broader fluorescence band (Fig. 1).
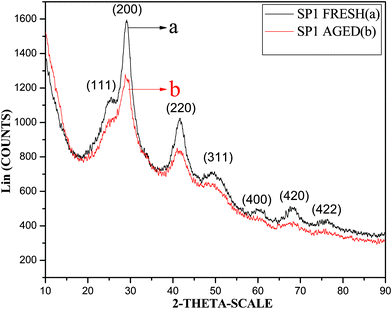 | ||
| Fig. 2 XRD patterns of fresh (a) and aged (b) SP1. | ||
The XRD pattern of 30 days aged SP1 is presented in Fig. 2 (pattern b). All the reflections due to this sample were similar to those observed in the fresh SP1 except the peaks were a little less intense and broader suggesting the aged sample contained the same structure as that observed for fresh SP1. Relatively less intense and broadened peaks corresponding to all the reflections indicate these nanostructures have relatively poor crystallinity.
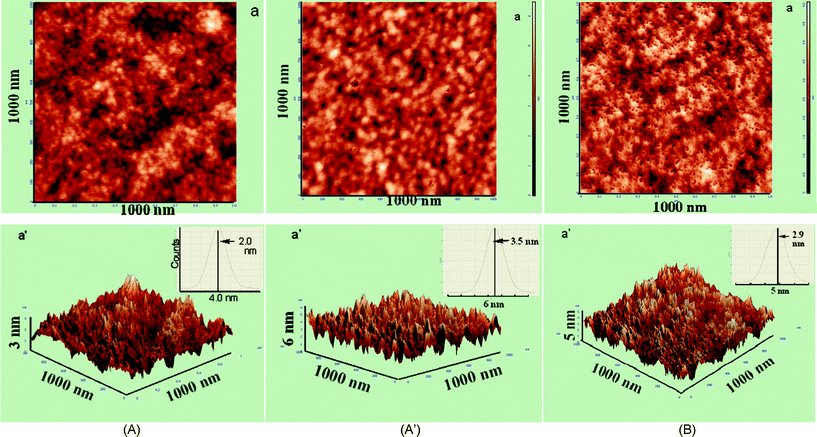 | ||
| Fig. 3 (A) AFM images of fresh SP1: 2D (a), 3D (a′), inset: roughness histogram. (A′) AFM images of aged SP1: 2D (a) and 3D (a′), inset: roughness histogram. (B) AFM images of fresh SP2: 2D (a) and 3D (a′), inset: roughness histogram. | ||
To further investigate the generation of porosity in the presence of Mg2+, higher concentrations of Mg2+ were added to this sample. 2D and 3D images for PbSe samples containing 10.0 × 10⁻⁵ mol dm−3 (SP2) are shown in Fig. 3B. The pore size histograms of fresh SP2 are given in Fig. S2b.† The 2D image of SP2 indicates the formation of a porous structure even in the fresh sample with an increase in the average surface roughness (roughness distribution) to 2.9 nm (1.2 to 4.4 nm) (Fig. 3B (a,a′)) compared to that of 2.0 nm recorded for fresh SP1 (Fig. 3A(a′)). SP2, however, generated a homogeneously distributed porous structure even for the fresh sample and the pore size of these nanostructures is increased to 2.5 nm (Fig. S2b†). The porous nature of the nanostructures was ascertained with their 3D views using image J software (Fig. S2b′†). The depth of these pores was estimated to be at ∼2.0 nm using NOVA software (Fig. S2c and S2d†). At still higher [Mg2+] = 15 × 10−5 mol dm−3 (SP3), although the number of pores has reduced, it resulted in an increase in the pore size (Fig. S2d′†). The average surface roughness (roughness distribution) of these particles was estimated to be 5.2 nm (2.5 to 9.0 nm) (not shown). These data evidently indicate that the addition of Mg2+ in a particular concentration range is responsible for enhancing the porosity in PbSe nanoparticles.
In control experiments, AFM images were also recorded for fresh RNA (SB) and RNA containing Mg2+ and Pb2+ alone (SB1), and are shown in Fig. S3A and S3B,† respectively. It produces spherical nanoparticles for both SB and SB1 having an average surface roughness (roughness distribution) of 7.8 nm (3.7 to 18.0 nm) and 9 nm (2.5 to 13 nm), respectively. Aging of SB and SB1 further resulted in an increase in the roughness of these particles to 9.8 (0.8 to 21 nm) (not shown) and 12 nm (3 to 17.5 nm) (Fig. S3B′†), respectively without changing their morphology. Obviously, the changes observed in SP1 are understood to occur due to the interaction of Mg2+ and Pb2+ ions with RNA mediated PbSe and not with RNA alone.
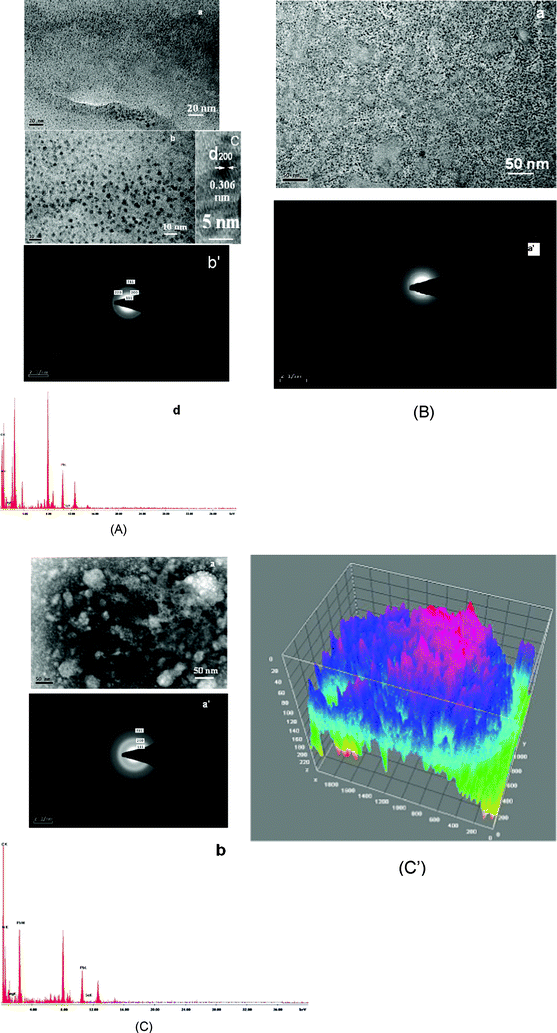 | ||
| Fig. 4 (A) TEM micrographs of fresh SP1 with different scale bars (a,b) and its SAED (b′); HRTEM image (c); EDAX spectrum (d). (B) TEM micrographs of aged SP1 (a) and its SAED (a′). (C) TEM micrographs of fresh SP2 (a); SAED (a′); EDAX spectrum (b). (C′) 3D view of TEM micrographs of SP2 (fresh) with the help of image J software. | ||
Aging of these particles produces a more organized structure with some porosity (Fig. 4B(a)). The SAED pattern of aged SP1 exhibits rather diffused rings (Fig. 4B(a′)), which suggests these particles become more amorphous on aging. This change is also indicated by XRD, where the peaks corresponding to the aged sample have broadened due to different reflections (Fig. 2 pattern b).
TEM images of the fresh SP2 (Fig. 4C(a) and 4C′) clearly show these nanostructures have bigger aggregates with enhanced porosity and are different to that of SB2, recorded in the control experiment (Fig. S4(c)†). The SAED pattern of these particles also presents more diffused rings (Fig. 4C(a′)) compared to those observed for fresh SP1 (Fig. 4A(b′)). The presence of diffused rings in this image possibly arises because of enhanced porosity in these nanosystems.
The formation of pores in the presence of Mg2+ was further probed by performing FESEM analysis. FESEM images of the fresh and aged SP1 along with their EDAX analyses are shown in Fig. 5. The fresh sample shows the presence of spherical nanoparticles and some of them were observed to have small sized pores (Fig. 5A). Aging of this sample results in the development of a large number of bigger sized pores (Fig. 5A′). Elemental mapping of this image shows a homogeneous distribution of the Pb, Se, Mg, C, N and P in the porous nanostructures. A difference in the size of nanostructures and pores in these measurements with those observed with AFM and TEM has been considered to arise because of the lower resolution of FESEM and the relatively large sample size(s) (42 μl) used for these measurements. EDAX analyses of different nanostructures in these images at different locations, indicated by the cross marks in red, evidently indicated the presence of Pb2+, Mg2+ and Se2− outside the pores (Fig. 5B(a)), whereas inside the pores it showed the absence of Pb2+ and Se2− and the presence of Mg2+ only (Fig. 5B(b)). The elemental mapping of the nanostructure(s) of fresh SP2 in the FESEM image demonstrates a homogeneous distribution of Pb2+, Mg2+ and Se2− along the entire region (Fig. 5C).
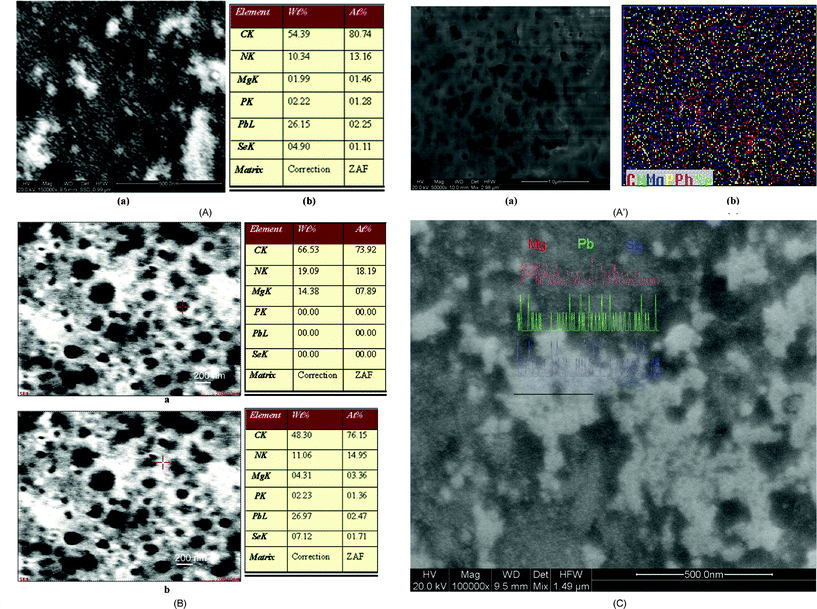 | ||
| Fig. 5 (A) FESEM image of fresh SP1 (a) and its EDAX analysis (b). (A′) FESEM image of aged SP1 (a) and its elemental mapping (b). (B) FESEM image and EDAX analysis of aged SP1. (C) FESEM image of fresh SP2 with elemental mapping. | ||
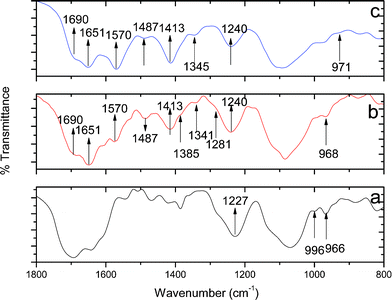 | ||
| Fig. 6 Mid IR spectra of SB (a), SB1 (b), and SP1(c). | ||
| Moieties | Chemical shift (δ) (ppm) | ||
|---|---|---|---|
| SB | SB1 | SP1 | |
| Sugar protons (H2′, H3′, H4′, H5′, H5′′) | 4.05–4.07 | 3.8 | 4.0 |
| Purine and sugar base (H1', H5) | 6.1–6.3 | 5.5–5.9 | 5.7–6.2 |
| Aromatic protons of purine and pyrimidine bases (H2, H8, H6) | 7.6–8.6 | 7.6–8.2 | 7.8–8.5 |
| Sugar 2′-OH | 2.4 | 1.8 | 2.0 |
| 31P | −0.89 | −0.91 | −1.0 |
A comparison of these spectra shows that the 1H NMR due to SB1 is quite different from that of pure RNA (SB) indicating the interaction of Mg2+ and excess Pb2+ with different sites of RNA, which might have caused the deshielding of protons associated with the above mentioned moieties. To analyze the interaction of PbSe with the RNA matrix, a comparison of the NMR spectra of SP1 was made with that of SB1. In comparison to SB1, SP1 shows a downfield shift in the resonance absorption of protons corresponding to: 2′-OH from 1.8 to 2.0 ppm; sugar protons from 3.82 to 3.96 ppm; bases and sugar protons from 5.5–5.9 to 5.7–6.2 ppm; and aromatic protons of purine and pyrimidine bases from 7.6–8.2 to 7.8–8.5, respectively. The observed downfield shift for SP1 compared to that of SB1 is understood to be due to a reduced electron density at various sites because of the above mentioned interactions with PbSe in the presence of Mg2+ and excess Pb2+. It would result in the deshielding of protons associated with these moieties.
31P NMR spectra of SB, SB1, and SP1 are presented in Fig. S5B† (from top to bottom), respectively and did not exhibit any appreciable change in the shape of the peak, but the δ (ppm) shows a regular decrease indicating the interaction of Mg2+ with the PO22− of RNA both in the absence and presence of PbSe, particularly in the presence of PbSe.
3.1.7.1 Time resolved fluorescence measurements. In order to understand the steady state observations on fluorescence measurements, relaxation kinetics of the charge carriers were obtained by performing time resolved studies both in the visible (770 nm) (Fig. S6;†Table 2) and NIR range (1000 nm) (Fig. S7;†Table 3) under varied [Mg2+] (1 × 10⁻⁵ to 10.0 × 10⁻⁵ mol dm−3). At 770 nm, all fluorescence decay curves followed three exponential kinetics (components 1, 2 and 3 in Table 2) having the time constant(s) (emission percent) in the range of: <20 ns (∼10), <100 ns (<40) and ∼300 ns (>50), (Table 2), respectively. A careful examination of the time constants (τ) in Table 2 reveals that with an increase in [Mg2+], all the three time constants have a regular increase in their values. An increase in [Mg2+] resulted in a gradual increase in the average fluorescence lifetime (<τ>) from 186 to 204 ns. Fluorescence decay was also followed kinetically at 1000 nm (Fig. S7†). The latter part of this decay was fitted to the first exponential kinetics from which the lifetime for this process was estimated as a function of [Mg2+] (Table 3). An increase in [Mg2+] also resulted in a regular increase in <τ> with [Mg2+] and for the optimized sample average <τ> was estimated to be 12.4 ns. The depths of traps for fresh SP1 and SP2 were found to be 296 and 313 meV (Table 4). It suggests that the deeper traps are responsible for the increase in fluorescence lifetime.
| Sample [Mg2+] × (10−5 mol dm−3) | Lifetime (ns) | <τ> (ns) | χ 2 | |||||
|---|---|---|---|---|---|---|---|---|
| Component 1 | Component 2 | Component 3 | ||||||
| τ 1 | Emission (%) | τ 2 | Emission (%) | τ 3 | Emission (%) | |||
| a Value in bracket is pre-exponential factor corresponding to respective τ. | ||||||||
| 1.0 | 16.0 (0.32) | 7.43 | 82.0 (0.33) | 38.92 | 284 (0.13) | 53.64 | 186 | 1.15 |
| 2.5 | 16.6 (0.33) | 7.67 | 84.2 (0.32) | 38.49 | 299 (0.13) | 53.84 | 195 | 1.26 |
| 5.0 (SP1) | 17.3 (0.34) | 8.55 | 84.8 (0.32) | 38.82 | 308 (0.12) | 52.63 | 197 | 1.14 |
| 10.0 (SP2) | 22.4 (0.37) | 11.63 | 102 (0.27) | 38.25 | 325 (0.11) | 50.12 | 204 | 1.21 |
| [Mg2+] × (10−5 mol dm−3) | Emission (%) | <τ> (ns) | χ 2 |
|---|---|---|---|
| 1.0 | 100 | 9.6 | 1.08 |
| 2.5 | 100 | 11.6 | 0.99 |
| 5.0 (SP1) | 100 | 12.4 | 1.02 |
| 10.0 (SP2) | 100 | 24.7 | 1.08 |
| Sample | Depth of the traps (meV) |
|---|---|
| SP1 fresh | 296 |
| SP2 fresh | 313 |
For the 30 days aged SP1 and SP2, the fluorescence lifetime decay curves and their lifetime data are given in Fig. 7 and Table 5, respectively. For aged SP1 the fluorescence decays following three exponential kinetics, but it results in a decrease in the time constants for the first two components, whereas, the third component has a slightly higher value causing (<τ>) to increase from 197 (Table 2) to 227 ns (Table 5). For this sample the lifetime decay of fluorescence, monitored at 1000 nm, did not have any significant change in the lifetime.
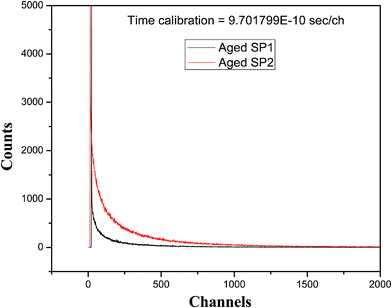 | ||
| Fig. 7 Fluorescence decay curves of aged SP1 and SP2. | ||
| Sample | Lifetime (ns) | <τ> (ns) | χ 2 | |||||
|---|---|---|---|---|---|---|---|---|
| Component 1 | Component 2 | Component 3 | ||||||
| τ 1 | Emission (%) | τ 2 | Emission (%) | τ 3 | Emission (%) | |||
| a Value in bracket is pre-exponential factor corresponding to respective τ. | ||||||||
| SP1 (aged) | 0.38 (8.38) | 6.7 | 55.2 (0.23) | 26.3 | 317 (0.10) | 67.0 | 227 | 1.35 |
| SP2 (aged) | 0.67 (2.80) | 3.55 | 54.3 (0.28) | 28.25 | 316 (0.11) | 68.2 | 231 | 1.41 |
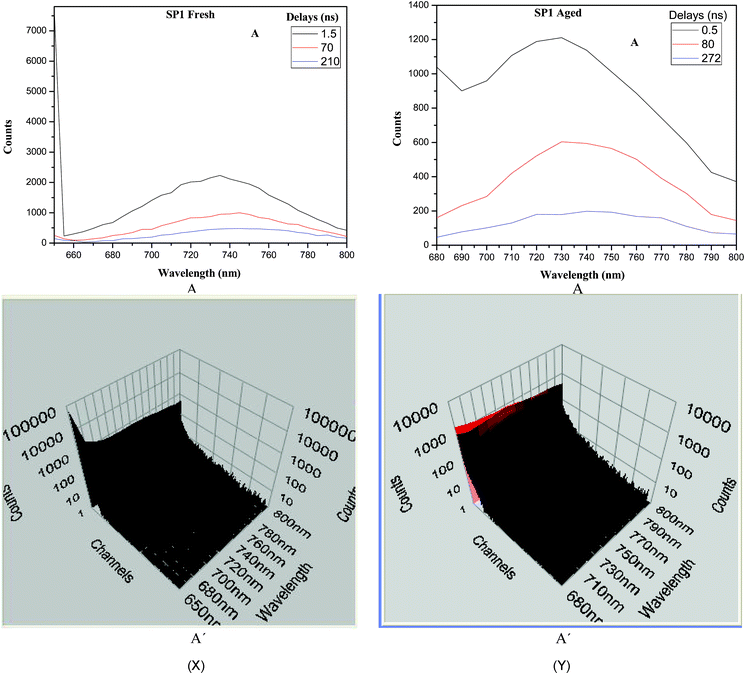
TRES for both the fresh and aged SP1 for different delays, identified from the fluorescence decay curves, are recorded in Fig. 8. An examination of TRES shows the presence of three intermediates for both the fresh (Fig. 8X) and aged samples (Fig. 8Y). For fresh SP1, after 1.5 ns delay the fluorescence intensity decays at lower wavelengths to produce an emitting species in the visible range with λmax at 735 nm (1.687 eV). Over a period of 70 ns delay, it decays further to produce another spectrum at lower energy with a fluorescence maximum at 745 nm (1.664 eV). This species then simply decays without any further spectral change. Corresponding to the different lifetime components, the depth of traps on these timescales at 293 K was estimated kinetically to lie from 304 to 377 meV (Table 6). It is these surface states which may be considered to be responsible for the observed low energy spectral shift. Very similar spectral changes were recorded in the TRES of the aged sample (Fig. 8Y). In this case the first species is observed at 728 nm, which then decays to produce another species with emission about 740 nm (1.68 meV), and the spectrum for the third intermediate was very similar suggesting mainly the decay of previous species. All these peaks were, however, blue shifted compared to those of fresh SP1. From this data the traps corresponding to the first component were estimated to lie at 206 meV. The traps corresponding to the second and third components were very similar to those observed for the fresh SP1. For SP2 the values of depth of traps varied from 222 to 378 meV (Table 6), respectively.
| Sample | Depth of the traps (meV) | ||
|---|---|---|---|
| τ 1 | τ 2 | τ 3 | |
| SP1 fresh | 304 | 344 | 377 |
| SP1 aged | 206 | 333 | 377 |
| SP2 fresh | 310 | 349 | 378 |
| SP2 aged | 222 | 333 | 378 |
4. Discussion
For SP1, the observed onset of absorption in an inert environment corresponds to about 1.01 eV. Considering the negligibly small absorbance in the NIR range beyond 1050 nm, the band gap due to these nanostructures is estimated to be about 1.21 eV. Since the bulk PbSe has a band gap of 0.278 eV, it suggests these particles are quantized. Unlike in the previous studies12–14 these nanostructures were fairly stable with regards to their absorption behavior and exhibited dual fluorescence, having fluorescence maxima in the visible region at 770 nm and a broad fluorescence band consisting of two peaks at 930 and 1010 nm, respectively, in NIR region. There was virtually no change in the absorption and fluorescence behavior in an N2 environment upon aging for about 2 days and there was only a slight decrease in intensity of fluorescence in the visible region without any appreciable change in wavelength. This observation is also in contrast to the previous findings with oleic acid stabilized nanoparticles, where PbSe fluorescence exhibited a red shift in fluorescence by 100 meV within 10 h after synthesis.14 For the present system, even aging for 30 days resulted in a slight decrease in absorbance below 425 nm and a negligibly small increase above 455 nm (Fig. 1). The fluorescence due to these particles, however, gets blue shifted by about 10 and 50 meV in the visible and NIR regions (Fig. 1), respectively, with a significant decrease in intensity of fluorescence. The observed optical and fluorescence changes in the present system might be considered to arise due to the changed interaction of the Mg2+/PbSe particles with RNA matrix containing different chemical environment(s).With regards to their morphology, an AFM image of fresh SP1 showed these nanostructures to largely have spherical morphology and very few of them exhibited porosity. But, aging results in an increase in their porosity (Fig. 3A′). On the contrary SP2, which contains a two fold higher [Mg2+] (10.0 × 10⁻⁵ mol dm−3) to that of SP1, largely produced porous nanoparticles with an average pore size (variation in size) of about 2.5 nm (1.75–2.55 nm) (Fig. S2b†). A further increase in [Mg2+] (15.0 × 10⁻⁵ mol dm−3) in SP3, however, results in a decrease in the number of particles carrying pores, but the pore size is found to increase by more than 4.5 times compared to those of SP1. These observations are also evidenced by TEM analysis. The TEM image of the fresh particles clearly showed the size due to SP1 to be 2.1 ± 0.7 nm (Fig. 4A(b)) and a porosity in these particles became visible upon aging (Fig. 4B(a)). Creation of porosity became quite apparent from the TEM image of fresh SP2 (Fig. 4C). The formation of pores in fresh SP1 and an increase in the size of pores upon aging is also supported by FESEM analysis (Fig. 5). The amorphous nature of the aged sample observed in the XRD pattern (Fig. 2, pattern b) also indicates the increased porosity of these nanostructures. It is thus quite apparent that aging as well as an increase in [Mg2+] up to a certain limit enhances the porosity in PbSe nanostructures. These experiments clearly show that it is the interaction(s) of PbSe with RNA/Pb2+/Mg2+ which are responsible for bringing a change in morphology in the present case.
The possibility of the contribution of the matrix/chemical environment alone to be responsible for the creation of porosity is ruled out by performing control experiments using AFM and TEM, in which the images due to SB and SB1 showed the presence of spherical nanoparticles without any porosity (Fig. S3 and S4†).
The generation of pores at mild concentrations of [Mg2+] in SP1 is understood to arise by changed supramolecular interactions among the core PbSe nanoparticles and the RNA matrix with [Mg2+] and [Pb2+]. The changed interactions are also evidenced by IR (Fig. 6; Table S2†) and NMR studies (Fig. S5A and S5B;†Table 1). An increase in the numbers and size of pores upon aging has been attributed to the reorganization of RNA capped PbSe nanoparticles at relatively higher [Mg2+]. These interactions are shown in Scheme 1. RNA strands are known to undergo folding in the presence of Mg2+ to yield secondary and tertiary structures. Since in a control experiment under the present conditions, the presence of Mg2+ resulted in the formation of slightly bigger spherical nanoparticles (9 nm) for SB1 compared to those observed in its absence (7 nm)11 without generating any pores, it is thus apparent that the observed porosity in SP1 is partly due to supramolecular interactions of PbSe in the presence of Mg2+.
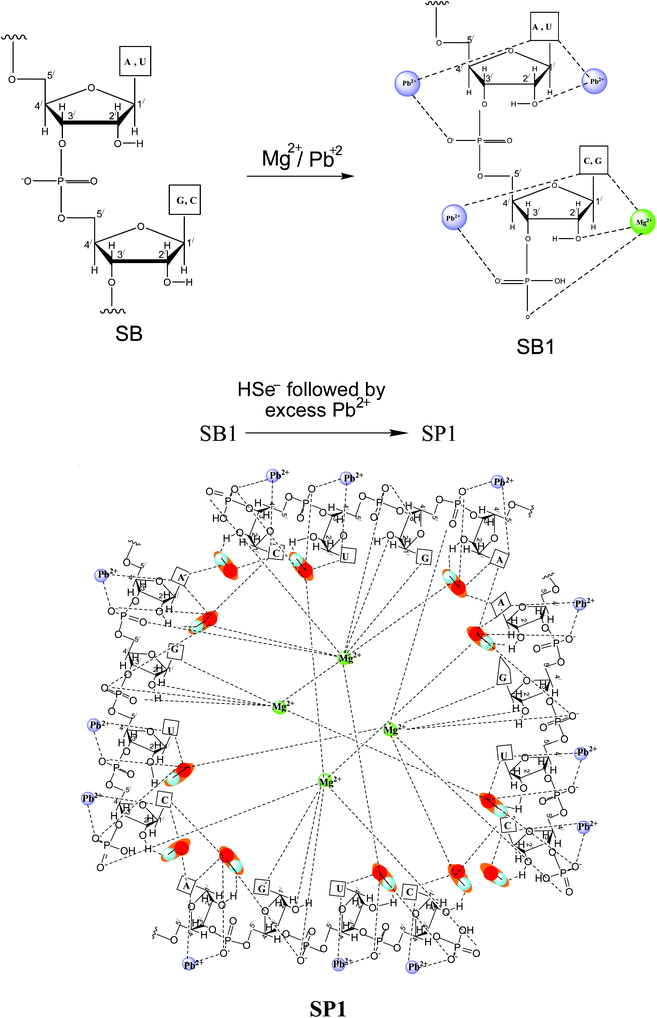 | ||
| Scheme 1 Depicting the interactions of Pb2+, Mg2+ and PbSe in SP1. | ||
The role of Mg2+ in the observed changes in optical properties was further analyzed by comparing the steady state absorption and fluorescence behavior of SP1 (Fig. 1) with that of PbSe nanostructures generated under identical experimental conditions in the absence of Mg2+.11,22 An examination of their absorption spectra reveals that in the presence of Mg2+, the absorption coefficient in the entire UV-VIS-NIR range is increased. With regards to the fluorescence, the intensity remains very similar in the visible region (ϕfl = 0.02), but is increased by about 30% in the NIR region (ϕfl = 0.38) compared to that in the absence of Mg2+.22 Increased oscillator strength in the latter case would possibly create more excited state species. The excited state species possibly relax rapidly to populate the deeper traps enhancing NIR fluorescence. Obviously, the presence of Mg2+ induces some additional transitions in the PbSe possibly by creating different surface states.
Based on the observed morphological changes in these nanostructures in the presence of Mg2+, a blue shift in the optical and fluorescence behavior of these particles upon aging and increasing [Mg2+] can be assigned to the increase in the porosity in these nanostructures.
A comparison of average fluorescence lifetime of SP1 (Tables 2 and 3) with that of PbSe nanostructures prepared in the absence of Mg2+ under identical experimental conditions reveals a decrease in lifetimes in visible11 as well as NIR regions.22 The observed decrease can be attributed to the change in the nature of the nanostructures formed in the two cases, i.e. in the absence and presence of Mg2+. The porous structure formed in the presence of Mg2+ possibly acts in two ways; firstly it results in an increased confinement of particles in the porous structure and secondly, it introduces more radiationless channels. Excess Mg2+ creates shallow traps involved in both radiative and non-radiative transitions, which have been estimated kinetically to lie between 206 to 333 meV (Table 6). Radiative decay from the shallow traps brings a blue shift in the fluorescence spectrum. Non-radiative decay on the other hand causes the charge carriers to relax rapidly to relatively deeper traps (∼296 meV) (Table 4), which are involved in the enhancement of NIR fluorescence (ϕfl = 0.38). The non-radiative decay in both visible and NIR regions results in a decrease in the fluorescence lifetime compared to that recorded with PbSe in the absence of Mg2+. The encapsulation of PbSe nanoparticles in the pores of these nanostructures in SP1 and SP2 thus enhances relaxation of charge carriers to deeper traps to cause an increase in NIR fluorescence. Moreover, SP2 having red and NIR fluorescence lifetimes in the range of 204 and 25 ns, respectively, makes it a new class of fluorescing dye suitable for possible applications in imaging.23 To the best of our knowledge this is the first report observing dual fluorescence due to Mg2+/PbSe. Moreover, these particles are more stable compared to those of oleic acid stabilized PbSe nanocrystals. The observed NIR fluorescence in 700 to 1100 nm after excitation in the red region at 670 nm makes these particles more suitable for bioimaging as living tissues have much less absorption in this wavelength range. This nanosystem may also find other applications in the areas of biomedical and clinical chemistry.10,11,24
5. Conclusions
In summary, in the synthesis of RNA-mediated PbSe nanostructures, the addition of Mg2+ introduces new supramolecular interactions among RNA-mediated PbSe, Pb2+, and Mg2+ bringing a change in the morphology of PbSe from spherical in its absence to porous in its presence. Both the self assembly of these nanostructures and/or addition of relatively higher amounts of Mg2+ result in the formation of porous hollow structures. These morphological changes produce new channels to create additional surface states involved in radiative and non-radiative transitions responsible for the observed fluorescence behavior in the visible and NIR ranges. Due to the confinement of PbSe in the porous nanostructure, the radiative process exhibits a blue shifted emission, whereas the non-radiative relaxation causes a reduction in the intensity of the fluorescence and fluorescence lifetime. It is thus the increased porosity at higher [Mg2+] and aging which might be largely responsible for the observed changes in the optical behavior. As synthesized RNA-mediated Mg2+/PbSe nanostructures, having porosity, relatively higher NIR fluorescence and a higher absorption coefficient compared to PbSe alone, could find biological applications in drug delivery, fluorescence imaging and as a sensitizer for solar energy conversion devices, respectively.Acknowledgements
B.S. is thankful to CSIR, New Delhi for the award of SRF. Thanks are also due to the Heads, IIC and Centre of Nanotechnology, IITR, Roorkee for providing us the facilities of TEM, AFM, Single Photon Counter and PLQY measurements respectively.References
- D. L. Feldheim and B. E. Eaton, ACS Nano, 2007, 1, 154–159 CrossRef CAS.
- N. Ma, E. H. Sargent and S. O. Kelley, J. Mater. Chem., 2008, 18, 954–964 RSC.
- A. L. Rogach, A. Eychmüller, S. G. Hickey and S. V. Kershaw, Small, 2007, 3, 536–557 CrossRef CAS.
- H. Fu and S.-W. Tsang, Nanoscale, 2012, 4, 2187–2201 RSC.
- D. Y. Kim, K. R. Choudhury, J. W. Lee, D. W. Song, G. Sarasqueta and F. So, Nano Lett., 2011, 11, 2109–2113 CrossRef CAS.
- A. G. Pattantyus-Abraham, I. J. Kramer, A. R. Barkhouse, X. Wang, G. Konstantatos, R. Debnath, L. Levina, I. Raabe, M. K. Nazeeruddin, M. Grätzel and E. H. Sargent, ACS Nano, 2010, 4, 3374–3380 CrossRef CAS.
- J. Tang and E. H. Sargent, Adv. Mater., 2011, 23, 12–29 CrossRef CAS.
- J. J. Choi, Y.-F. Lim, M. B. Santiago-Berrios, M. Oh, B.-R. Hyun, L. Sun, A. C. Bartnik, A. Goedhart, G. G. Malliaras, H. D. Abruña, F. W. Wise and T. Hanrath, Nano Lett., 2009, 9, 3749–3755 CrossRef CAS.
- D. V. Talapin and C. B. Murray, Science, 2005, 310, 86–89 CrossRef CAS.
- B.-R. Hyun, H. Chen, D. A. Rey, F. W. Wise and C. A. Batt, J. Phys. Chem. B, 2007, 111, 5726–5730 CrossRef CAS.
- A. Kumar and B. Singh, Chem. Commun., 2011, 47, 4144–4146 RSC.
- C. M. Evans, L. Guo, J. J. Peterson, S. Maccagnano-Zacher and T. D. Krauss, Nano Lett., 2008, 8, 2896–2899 CrossRef CAS.
- W. W. Yu, J. C. Falkner, B. S. Shih and V. L. Colvin, Chem. Mater., 2004, 16, 3318–3322 CrossRef CAS.
- M. Sykora, A. Y. Koposov, J. A. McGuire, R. K. Schulze, O. Tretiak, J. M. Pietryga and V. I. Klimov, ACS Nano, 2010, 4, 2021–2034 CrossRef CAS.
- C. B. Murray, S. Sun, W. Gaschler, H. Doyle, T. A. Betley and C. R. Kagan, IBM J. Res. Dev., 2001, 45, 47–56 CrossRef CAS.
- E. Ennifar, P. Walter and P. Dumas, Nucleic Acids Res., 2003, 10, 2671–2682 CrossRef.
- R. Das, K. J. Travers, Y. Bai and D. Herschlag, J. Am. Chem. Soc., 2005, 127, 8272–8273 CrossRef CAS.
- D. E. Draper, RNA, 2004, 10, 335–343 CrossRef CAS.
- A. Eychmüller, A. Hässelbarth, L. Katsikas and H. Weller, J. Lumin., 1991, 48–49, 745–749 CrossRef.
- M. Banyay, M. Sarkar and A. Gräslunda, Biophys. Chem., 2003, 104, 477–488 CrossRef CAS.
- D. Söl, S. Nishimura and P. Moore, RNA, Pergamon Elsevier Science (P) Ltd, London, 2001, p. 7 Search PubMed.
- (a) In a control experiment, the absorption of PbSe in the absence of Mg2+ under identical conditions was found to have about 1.3 times lesser absorption in the entire absorption range and relatively weaker bands at 420, 670 and 930 nm; (b) NIR absorption, fluorescence, quantum efficiency of fluorescence and fluorescence lifetime of PbSe will be reported in a separate manuscript.
- (a) J. V. Frangioni, Curr. Opin. Chem. Biol., 2003, 7, 626–634 CrossRef CAS; (b) M. V. Berezin, W. J. Akers, K. Guo, G. M. Fisher, E. Datrozzo, A. Zumbush and S. Achilefu, Biophys. J., 2009, 97, L22–L24 CrossRef CAS.
- O. O. Abugo, R. Nair and J. R. Lakowicz, Anal. Biochem., 2000, 279, 142–150 CrossRef CAS.
Footnote |
| † Electronic supplementary information (ESI) available. See DOI: 10.1039/c2ra20878d |
| This journal is © The Royal Society of Chemistry 2012 |

