“Green light” for Zn(II) mesogens†
Daniela
Pucci
*a,
Alessandra
Crispini
ab,
Mauro
Ghedini
a,
Massimo La
Deda
ab,
Paola F.
Liguori
a,
Claudio
Pettinari
c and
Elisabeta I.
Szerb
a
aCentro di Eccellenza CEMIF.CAL-LASCAMM, CR-INSTM Unità della Calabria, Dipartimento di Chimica, Università della Calabria, Via P. Bucci Cubo 14C, Arcavacata (Rende), Italy. E-mail: d.pucci@unical.it; Fax: +390984492066; Tel: +390984492064
bCentro di Eccellenza CEMIF.CAL-LASCAMM, CR-INSTM Unità della Calabria, Dipartimento di Scienze Farmaceutiche, Università della Calabria, Edificio Polifunzionale, Arcavacata (Rende), Italy
cSchool of Pharmacy, University of Camerino, S. Agostino, 62032, Camerino (MC), Italy
First published on 24th August 2012
Abstract
Zn(II) complexes of different geometries have been synthesized starting from hexacatenar 2,2′-bipyridine or 1,10-phenanthroline ligands and their photophysical behaviour has been studied as a function of the temperature, starting from the solid state up to the isotropic liquid, in order to correlate the aggregation state to the luminescence properties.
1. Introduction
Order, mobility and anisotropic photophysical properties are ingredients that are driving luminescent liquid crystalline materials to a predominant position in the research area of photoactive molecular materials for optoelectronic devices, information storage, sensors and contrast displays.1,2 In addition, the photophysical characteristics of transition metal complexes make coordination compounds suitable and versatile electroluminescent materials for such applications, depending on the judicious choice of metals and ligands.3 Therefore, the promotion of mesomorphism and luminescence simultaneously occurring in metal complexes should make emissive metallomesogens excellent candidates for practical applications. Among them,4 a very few cases of luminescent Zn(II) mesogens have been reported up to now. In particular, blue luminescence, in both the solid and in the frozen B6 mesophase, is induced after coordination of the Zn(II) ion to tetradentate dimeric salicylaldimine ligands.5 Moreover, the photophysical behaviour in the lamellar or columnar liquid crystalline state at room temperature has been investigated for a series of blue emitters based on polycatenar monodentate pyrazoles and bis(pyrazolyl)methane chelating ligands.6As part of our research in the field of luminescent liquid crystalline complexes,7–10 we have chosen to take advantage of the versatile coordination ability of Zn(II) for investigating the thermal and photophysical properties of a number of coordination compounds in the function of both of the different coordination environments of the metal centre and the aggregation states. Thus, we have selected two hexacatenar N,N-donor ligands of increasing aromaticity (L1 and L2 in Scheme 1) as promesogenic main ligands and performed the synthesis and study of their heteroleptic Zn(II) complexes showing variable coordination numbers depending on the nature and ratio of the ancillary ligand used. Indeed, when a monodentate (chloride) ligand is introduced in a 1![[thin space (1/6-em)]](https://www.rsc.org/images/entities/char_2009.gif) :
:![[thin space (1/6-em)]](https://www.rsc.org/images/entities/char_2009.gif) 2 molar ratio (metal:ligand) tetracoordinated Zn(II) complexes are obtained, while the presence of one or two O,O-chelating HQ units (Scheme 1) afford penta- or hexacoordinated derivatives, respectively. The influence of the molecular shape on the liquid crystalline and photophysical properties of all of the Zn(II) compounds synthesized have been studied and compared over the entire temperature range explored.
2 molar ratio (metal:ligand) tetracoordinated Zn(II) complexes are obtained, while the presence of one or two O,O-chelating HQ units (Scheme 1) afford penta- or hexacoordinated derivatives, respectively. The influence of the molecular shape on the liquid crystalline and photophysical properties of all of the Zn(II) compounds synthesized have been studied and compared over the entire temperature range explored.
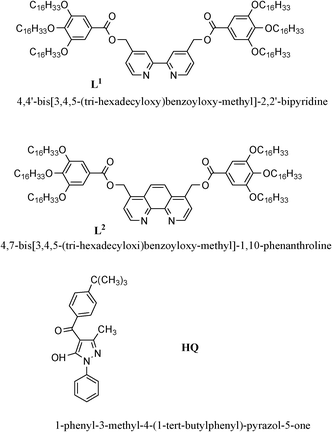 | ||
| Scheme 1 Chemical structures of the O,O- and N,N-ligands used. | ||
2. Experimental section
Materials and methods
All commercially available starting materials were used as received without further purification. 1-phenyl-3-methyl-4-(1-tert-butylphenyl)-pyrazol-5-one (HQ) was synthesized following the procedure reported in the literature.11 Both ligands10,12 and complex 112 were synthesized as previously described.1H NMR spectra were recorded on a Bruker Avance AC-300 spectrometer in CDCl3 solution, using tetramethylsilane (TMS) as the internal standard. Elemental analyses (CHN) were performed with a Perkin Elmer 2400 microanalyzer by the Microanalytical Laboratory at the University of Calabria. Infrared spectra (KBr) in the range 4000–400 cm−1 were recorded on a Spectrum One FT-IR Perkin Elmer spectrometer. Conductivity measurements were performed in dichloromethane solution, with an InoLab Cond Level 1-720 conductometer equipped with a LR 325/001 immersion cell.
Mesomorphism
The textures of the mesophases were examined with a Leica DMLP polarising microscope equipped with a Leica DFC280 camera and a CalCTec (Italy) heating stage. The thermal stability was measured on a Perkin-Elmer Thermogravimetric Analyser Pyris 6 TGA, the transition temperatures and enthalpies were measured on a Perkin-Elmer 1 Pyris Differential Scanning Calorimeter with a heating and cooling rate of 10 °C min−1. The apparatus was calibrated with indium. Three heating/cooling cycles were performed on each sample. Powder X-Ray diffraction patterns were obtained using a Bruker AXS General Area Detector Diffraction System (D8 Discover with GADDS) with Cu-Kα radiation (λ = 1.54056 Å). The highly sensitive area detector was placed at a distance of 20 cm from the sample and at an angle (2θD) of 14°. A CalCTec (Italy) heating stage was used to heat the samples at a rate of 5 °C min−1 to the appropriate temperature. Measurements were performed by placing the samples in Lindemann capillary tubes with an inner diameter of 0.5 mm.Photophysical measurements
Emission and excitation spectra were recorded on a HORIBA Jobin-Yvon Fluorolog-3 FL3-211 spectrofluorimeter equipped with a 450 W xenon arc lamp, double-grating excitation and single-grating emission monochromators (2.1 nm mm−1 dispersion; 1200 grooves per mm) and a Hamamatsu R928 photomultiplier tube. Emission and excitation spectra were corrected for source intensity (lamp and grating) and emission spectral response (detector and grating) by standard correction curves. Powder samples were prepared by placing the powder between two quartz plates, in such a position that the luminescence has been measured in reflection mode, in a front-facing arrangement to reduce the scattered light. To reach the mesophase, the two quartz plates were heated in the sample compartment spectrofluorimeter by means of a customized temperature-controlled hot stage realized by CaLCTec s.r.l. (Rende, Italy), with an uncertainty in the temperature of 1 °C.The emission quantum yields of the samples were obtained by means of a Labsphere HORIBA Jobin-Yvon integrating sphere (diameter 102 mm), mounted in the optical path of the spectrofluorimeter; the sphere is coated with Spectralon®, which provides a reflectance >99% over 400–1500 nm range (>95% within 250–2500 nm). The sphere accessories were made from Teflon (rod and sample holders) or Spectralon (baffle). The quartz-sandwich, containing the powder sample, was placed into the sphere, on a Teflon holder, by means of a customized temperature-controlled hot stage realized by CaLCTec s.r.l. (Rende, Italy), with an uncertainty in the temperature of 1 °C. The procedure used to determine the emission quantum yield is based on the de Mello method,13 but slightly modified.14,15
The experimental uncertainties were 1 nm for the band maxima of the luminescence spectra and 5% for the emission quantum yield values.
Synthesis
![[double bond, length as m-dash]](https://www.rsc.org/images/entities/char_e001.gif) O). 1H NMR δH (300 MHz, CDCl3): 9.22 (2H, d, J(H,H) = 4.94 Hz, H2,9), 8.31 (2H, s, H5,6), 8.11 (2H, d, J(H,H) = 4.94 Hz, H3,8), 7.30 (4H, s, Hα,α′), 5.98 (4H, s, CH2), 4.04 (12H, m, OCH2(CH2)14CH3), 1.78 (12H, m, CH2(CH2)13CH3), 1.36 (156H, m, (CH2)13CH3), 0.87 (18H, t, J(H,H) = 6.86, CH3). ΛM (c = 1.5 × 10⁻⁵ mol L−1 in CH2Cl2): 5.33 Ω−1 cm2 mol−1.
O). 1H NMR δH (300 MHz, CDCl3): 9.22 (2H, d, J(H,H) = 4.94 Hz, H2,9), 8.31 (2H, s, H5,6), 8.11 (2H, d, J(H,H) = 4.94 Hz, H3,8), 7.30 (4H, s, Hα,α′), 5.98 (4H, s, CH2), 4.04 (12H, m, OCH2(CH2)14CH3), 1.78 (12H, m, CH2(CH2)13CH3), 1.36 (156H, m, (CH2)13CH3), 0.87 (18H, t, J(H,H) = 6.86, CH3). ΛM (c = 1.5 × 10⁻⁵ mol L−1 in CH2Cl2): 5.33 Ω−1 cm2 mol−1.
| Compound | Transitiona | T/°Cb | ΔH/kJ mol−1 | |
|---|---|---|---|---|
| a C: crystal; Colh: columnar hexagonal mesophases; Colr: columnar rectangular phase; I: isotropic liquid. b Temperature data as onset peaks. c Data from ref. 12. | ||||
| 1 c | I cycle | C–C′ | 58.5 | 73.7 |
| C′–Colh | 90.6 | 37.7 | ||
| Colh–I | 111.4 | 8.0 | ||
| I–Colh | 111.1 | 1.3 | ||
| Colh–C′ | 59.3 | 24.7 | ||
| II cycle | C–C′ | 34.3 | 5.6 | |
| C′–Colh | 63.1 | 26.4 | ||
| Colh–I | 107.7 | 12.8 | ||
| I–Colh | 111.5 | 1.8 | ||
| Colh–C′ | 60.4 | 28.6 | ||
| 2 | I cycle | C–C′ | 53.4 | 8.3 |
| C′–Colh | 82.4 | 58.3 | ||
| Colh–I | 170.9 | 4.9 | ||
| I–Colh | 170.5 | 2.2 | ||
| II cycle | C–Colh | 30.8 | 32.7 | |
| Colh–I | 170.0 | 2.2 | ||
| I–Colh | 170.5 | 2.1 | ||
| 3 | I cycle | C–Colh | 36.4 | 34.5 |
| Colh–I | 80.9 | 4.5 | ||
| I–Colh | 79.6 | 2.7 | ||
| II cycle | C–Colh | 36.0 | 11.0 | |
| Colh–I | 82.4 | 3.0 | ||
| I–Colh | 79.5 | 2.6 | ||
| 4 | I cycle | C–Colh | 42.7 | 74.0 |
| Colh–I | 126.2 | 6.1 | ||
| I–Colh | 125.2 | 3.1 | ||
| II cycle | Colh–I | 126.2 | 2.3 | |
| I–Colh | 123.9 | 3.1 | ||
| 5 | I cycle | C–Colr | 47.7 | 91.4 |
| Colr–I | 121.8 | 9.6 | ||
| I–Colr | 112.0 | 10.0 | ||
| Colr–C | 38.3 | 25.7 | ||
| II cycle | C–Colr | 33.6 | 25.8 | |
| Colr–I | 122.6 | 8.9 | ||
| I–Colr | 112.0 | 10.4 | ||
| Colr–C | 38.3 | 24.4 | ||
![[double bond, length as m-dash]](https://www.rsc.org/images/entities/char_e001.gif) O), 1610 (C
O), 1610 (C![[double bond, length as m-dash]](https://www.rsc.org/images/entities/char_e001.gif) O Q). 1H NMR δH (300 MHz, CDCl3): 9.22 (2H, d, J(H,H) = 5.2 Hz, H6,6′), 8.16 (2H, s, H3,3′), 7.97 (2H, d, J(H,H) = 7.8 Hz, He,i), 7.66 (2H, d, J(H,H) = 5.2 Hz, H5,5′), 7.46 (6H, m, Ha,b, Hc,d, Hh,f), 7.29 (4H, d, J(H,H) = 5.2 Hz, Hα,α′), 7.20 (1H, t, J(H,H) = 7.4 Hz, Hg), 5.48 (4H, s, CH2), 4.02 (12H, m, OCH2), 1.77 (15H, m, CH3Q, CH2(CH2)13CH3), 1.41 (165H, m, C(CH3)3Q, (CH2)13CH3), 0.87 (18H, t, J(H,H) = 6.7 CH3); ΛM (c = 1.3 × 10⁻⁵ mol L−1 in CH2Cl2): 1.02 Ω−1 cm2 mol−1.
O Q). 1H NMR δH (300 MHz, CDCl3): 9.22 (2H, d, J(H,H) = 5.2 Hz, H6,6′), 8.16 (2H, s, H3,3′), 7.97 (2H, d, J(H,H) = 7.8 Hz, He,i), 7.66 (2H, d, J(H,H) = 5.2 Hz, H5,5′), 7.46 (6H, m, Ha,b, Hc,d, Hh,f), 7.29 (4H, d, J(H,H) = 5.2 Hz, Hα,α′), 7.20 (1H, t, J(H,H) = 7.4 Hz, Hg), 5.48 (4H, s, CH2), 4.02 (12H, m, OCH2), 1.77 (15H, m, CH3Q, CH2(CH2)13CH3), 1.41 (165H, m, C(CH3)3Q, (CH2)13CH3), 0.87 (18H, t, J(H,H) = 6.7 CH3); ΛM (c = 1.3 × 10⁻⁵ mol L−1 in CH2Cl2): 1.02 Ω−1 cm2 mol−1.
![[double bond, length as m-dash]](https://www.rsc.org/images/entities/char_e001.gif) O), 1608 (C
O), 1608 (C![[double bond, length as m-dash]](https://www.rsc.org/images/entities/char_e001.gif) O QW). 1H NMR δH (300 MHz, CDCl3): 9.50 (2H, d, J(H,H) = 5.2 Hz, H2,9), 8.25 (2H, s, H5,6), 8.01 (4H, t, J(H,H) = 6.6 Hz, He,i, H3,8), 7.56 (2H, d, J(H,H) = 7.9 Hz, Ha,d), 7.44 (4H, m, Hc,d, Hh,f), 7.29 (4H, Hα,α′), 7.20 (1H, t, J(H,H) = 7.7 Hz, Hg), 5.93 (4H, s, CH2), 4.01 (12H, m, OCH2(CH2)14CH3), 1.79 (15H, m, CH3QW, CH2(CH2)13CH3), 1.24 (165H, m, C(CH3)3QW, (CH2)13CH3), 0.87 (18H, t, J(H,H) = 6.6 Hz, CH3); ΛM (c = 1.2 × 10⁻⁵ mol L−1 in CH2Cl2): 2.8 Ω−1 cm2 mol−1.
O QW). 1H NMR δH (300 MHz, CDCl3): 9.50 (2H, d, J(H,H) = 5.2 Hz, H2,9), 8.25 (2H, s, H5,6), 8.01 (4H, t, J(H,H) = 6.6 Hz, He,i, H3,8), 7.56 (2H, d, J(H,H) = 7.9 Hz, Ha,d), 7.44 (4H, m, Hc,d, Hh,f), 7.29 (4H, Hα,α′), 7.20 (1H, t, J(H,H) = 7.7 Hz, Hg), 5.93 (4H, s, CH2), 4.01 (12H, m, OCH2(CH2)14CH3), 1.79 (15H, m, CH3QW, CH2(CH2)13CH3), 1.24 (165H, m, C(CH3)3QW, (CH2)13CH3), 0.87 (18H, t, J(H,H) = 6.6 Hz, CH3); ΛM (c = 1.2 × 10⁻⁵ mol L−1 in CH2Cl2): 2.8 Ω−1 cm2 mol−1.
![[double bond, length as m-dash]](https://www.rsc.org/images/entities/char_e001.gif) O), 1619 (C
O), 1619 (C![[double bond, length as m-dash]](https://www.rsc.org/images/entities/char_e001.gif) O QW). 1H NMR δH (300 MHz, CDCl3): 9.40 (2H, d, J(H,H) = 4.8 Hz, H2,9), 8.19 (2H, s, H5,6), 7.93 (6H, t, J(H,H) = 6.7 Hz, He,i, H3,8), 7.31 (10H, m, Ha,b,c,d, Hα,α′), 7.16 (4H, t, J(H,H) = 7.8 Hz, Hh,h′, Hf,f′), 7.00 (2H, t, J(H,H) = 7.5 Hz, Hg,g′), 5.91 (4H, s, CH2), 3.99 (12H, m, OCH2(CH2)14CH3), 1.70 (18H, m, CH3QW, CH2(CH2)13CH3), 1.35 (174H, m, C(CH3)3 QW, (CH2)13CH3), 0.87 (18H, t, J(H,H) = 6.6 Hz, CH3). ΛM (c = 1.0 × 10⁻⁵ mol L−1 in CH2Cl2): 3.02 Ω−1 cm2 mol−1.
O QW). 1H NMR δH (300 MHz, CDCl3): 9.40 (2H, d, J(H,H) = 4.8 Hz, H2,9), 8.19 (2H, s, H5,6), 7.93 (6H, t, J(H,H) = 6.7 Hz, He,i, H3,8), 7.31 (10H, m, Ha,b,c,d, Hα,α′), 7.16 (4H, t, J(H,H) = 7.8 Hz, Hh,h′, Hf,f′), 7.00 (2H, t, J(H,H) = 7.5 Hz, Hg,g′), 5.91 (4H, s, CH2), 3.99 (12H, m, OCH2(CH2)14CH3), 1.70 (18H, m, CH3QW, CH2(CH2)13CH3), 1.35 (174H, m, C(CH3)3 QW, (CH2)13CH3), 0.87 (18H, t, J(H,H) = 6.6 Hz, CH3). ΛM (c = 1.0 × 10⁻⁵ mol L−1 in CH2Cl2): 3.02 Ω−1 cm2 mol−1.
3. Results and discussion
Synthesis and characterisation
Three different typologies of Zn(II) complexes were prepared starting from two hexacatenar N,N chelating ligands, the 4,4′-bis-[(3,4,5-(tri-hexadecyloxy)benzoyloxy-methyl)]-2,2′-bipyridine (L1) and the 4,7-bis[3,4,5-(tri-hexadecyloxy)benzoyloxy-methyl]-1,10-phenanthroline (L2), according to Schemes 2 and 3.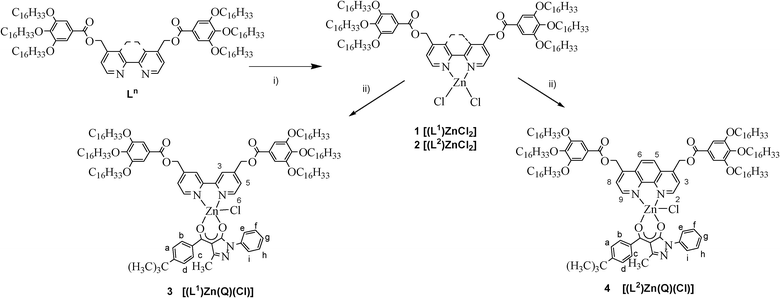 | ||
| Scheme 2 The synthesis of complexes 1–4. Reagents and conditions: i) ZnCl2, CHCl3, 6 days, r.t.; ii) KQ, CH2Cl2, 3 days, r.t., N2. | ||
 | ||
| Scheme 3 The synthesis of complex 5. Reagents and conditions: i) CHCl3, r.t.; 8 days. | ||
The phenanthroline dichloro [(Ln)ZnCl2] complex 2 was prepared by reaction (Scheme 2) of an equimolar amount of L2 ligand with ZnCl2, in chloroform, at room temperature, following the procedure previously reported for the analogous bipyridine complex 1.12
The IR and 1H NMR spectroscopic data of complex 2 showed the expected shifts of the signals with respect to the free ligand, confirming the coordination of the phenantroline to the Zn(II) centre. The neutral character of complex 2 was established by conductivity measurements in CH2Cl2 solution. TGA analysis revealed a desolvation process of one molecule of H2O (experimental mass loss = 0.85%) at 61.7 °C, in accordance with a large transition peak in DSC (ESI†). This is consistent with the presence of co-crystallised water solvent, as also suggested by the elemental analysis values. Taking into consideration the single crystal X-ray structure of an analogous dichloro 2,2′-bipyridine compound too,16 the coordination geometry of complex 2 is proposed to be tetrahedral.
The [(Ln)ZnCl2] compounds were subsequently used as precursors for the synthesis of the corresponding mono-diketonate derivatives 3–4, through substitution reaction with one equivalent of the potassium salt of the ancillary ligand 1-phenyl-3-methyl-4-(1-tert-butylphenyl)-pyrazol-5-one (KQ) (Scheme 2).
The purity and the structures of the mono-acylpyrazolonate derivatives 3–4 were confirmed on the basis of elemental analysis, IR and 1H NMR spectroscopies. In particular, in the IR spectra the carbon–oxygen bands of the acylpyrazolate fragment are shifted by about 10 cm−1 with respect to the corresponding O,O-free ligand, confirming that the coordination to the Zn(II) ion took place. In the 1H NMR spectra the H6,6′, H2,9 and He,i proton resonances shift by about 0.4–0.5 ppm down field with respect to their organic precursors, confirming the presence of chelated systems around the Zn(II) ion. Moreover, the intensities of the proton signals of complexes 3–4 are in agreement with the proposed 1![[thin space (1/6-em)]](https://www.rsc.org/images/entities/char_2009.gif) :
:![[thin space (1/6-em)]](https://www.rsc.org/images/entities/char_2009.gif) 1 ratio between N,N-ligand and O,O-ligand. Finally, conductivity measurements made in CH2Cl2 solution confirmed the neutral character of 3–4 in solution. TGA analysis revealed the absence of any solvent molecules for the solid samples of 3–4.
1 ratio between N,N-ligand and O,O-ligand. Finally, conductivity measurements made in CH2Cl2 solution confirmed the neutral character of 3–4 in solution. TGA analysis revealed the absence of any solvent molecules for the solid samples of 3–4.
Thus, in analogy to similar bipyridine-based Zn(II) derivatives already structurally characterized,17 the coordination sphere of the Zn(II) ion in complexes 3–4 is proposed to be saturated by a chloride ion, leading to the general formula [(Ln)Zn(Q)(Cl)].
All attempts to obtain the bis-diketonate Zn(II) derivatives in a one-pot procedure upon reaction of the dichloro precursors 1–2 with two equivalents of KQ failed and a mixture of Zn(II) bis-acylpyrazolonate and HLn was recovered. Therefore, an alternative synthetic methodology was employed between the homoleptic Zn(II) acylpyrazolonate precursor [Zn(Q)2(S)2] (where S is methanol),18,19 and one equivalent of the appropriate nitrogen ligand Ln, as shown in Scheme 3.
However, probably due to the lower metal binding strength of the bipyriridine with respect to the phenanthroline, only the phenantroline based bis-diketonate complex, [(L2)Zn(Q)2] 5, was obtained. The structure of 5 was assigned on the basis of elemental analysis, IR and 1H NMR spectroscopies. In particular, in the 1H NMR spectrum the intensities of the signals corresponding to the protons of the ancillary ligands are in agreement with the 1![[thin space (1/6-em)]](https://www.rsc.org/images/entities/char_2009.gif) :
:![[thin space (1/6-em)]](https://www.rsc.org/images/entities/char_2009.gif) 2 (metal:O,O-ligand) stoichiometry, as proposed in Scheme 3. The conductivity measurements, performed in dichloromethane solution, confirmed the neutral nature of 5, at least in solution. Therefore, an hexacoordination is proposed around the Zn(II) ion, the sphere of which, apart from the N,N-ligand grafted, is saturated by two O,O chelating units.
2 (metal:O,O-ligand) stoichiometry, as proposed in Scheme 3. The conductivity measurements, performed in dichloromethane solution, confirmed the neutral nature of 5, at least in solution. Therefore, an hexacoordination is proposed around the Zn(II) ion, the sphere of which, apart from the N,N-ligand grafted, is saturated by two O,O chelating units.
Mesomorphism
The thermal behaviour of all Zn(II) derivatives 1–5 was determined by a combination of thermogravimetric analysis (TGA), differential scanning calorimetry (DSC), polarized optical microscopy (POM) and X-ray powder diffraction (PXRD) at variable temperature. The DSC scans are reproducible on several heating/cooling cycles. Thermal data are summarized in Table 1.POM analysis performed on the phenanthroline based complex 2 revealed a focal-conic texture with homeotropic zones, typical of a columnar hexagonal mesophase (ESI†). The PXRD pattern, similar to that of the bipyridine derivative 1,12 shows in the small angle region four reflections typical of a 2D hexagonal lattice (Table 2 and ESI†).
| Compound | Mesophase lattice constants/Å | d meas/Å | Miller indicesb |
|---|---|---|---|
| (dcalcd/Å)a | hk | ||
a
d
meas and dcalcd are the measured and calculated diffraction spacings.
b
hk are the indices of the reflections corresponding to the Colh phase, respectively.
c Data from ref. 12;
d The lattice parameter of the Colh phase is deduced from  ).
e . ).
e . and and  ; ;  , assuming a density of ρ = 1.2 g cm−3.
f The lattice parameters of the Colr phase are deduced from the measured spacings d11 and d20: a = 2·d20 and , assuming a density of ρ = 1.2 g cm−3.
f The lattice parameters of the Colr phase are deduced from the measured spacings d11 and d20: a = 2·d20 and  . .
|
|||
| 2 c | Colh at 160 °C | 35.3 (35.3) | (1 0) |
| (on cooling) | 20.5 (20.4) | (1 1) | |
| a = 40.8 Åd | 17.7 (17.7) | (2 0) | |
| Sh = 1442.6 Å2e | 13.5 (13.3) | (2 1) | |
| Z = 1.8 | 4.5 | h CH | |
| 3.6 | h | ||
| 3 | Colh at 70 °C | 33.1 (33.1) | (1 0) |
| (on cooling) | 19.2 (19.1) | (1 1) | |
| a = 38.2 Åd | 4.5 | h CH | |
| 4 | Colh at 115 °C | 35.1 (35.1) | (1 0) |
| (on cooling) | 20.3 (20.6) | (1 1) | |
| a = 40.5 Åd | 4.5 | h CH | |
| 5 | Colr at 100 °C | 38.8 (38.8) | 20 |
| (on cooling) | 32.8 (32.8) | 11 | |
| a = 77.6 Å | 18.1 (18.2) | 02 | |
| b = 36.2 Åf | 17.6 (17.7) | 12 | |
| Sr = 2809.0 Å2e | 14.5 (14.8/14.3) | 32/51 | |
| Z = 3.6 | 11.8 (11.6/12.0) | 23/13 | |
| 10.9 (10.9) | 33 | ||
| 9.4 | h 2 | ||
| 4.6 | h CH | ||
A broad diffuse scattering halo corresponding to the liquid-like disorder of the aliphatic chains is observed in the wide angle region. Furthermore, a broad reflection centred at 3.6 Å, absent in the case of complex 1, indicates the existence of π–π interactions (Table 2). The presence of additional intermolecular interactions together with a small shrinkage of the lattice parameter (from 42.7 Å in 1 to 40.8 Å in 2) indicates the existence of a more ordered well-packed columnar hexagonal phase. This effect can be attributed to the extension of the aromatic portion in the phenanthroline ligand and its increased planarity. The calculated number of molecules in the cross-section of the columns amounts to about 2 (Z value in Table 2), confirming the association of two half-disks (one molecule) in order to rich a complete alkyl chain surrounding around the central core.
POM analysis performed on the acylpyrazolate derivatives 3–5 showed small schlieren fluid textures (ESI†), whose identification was not unequivocal. Thus, the nature of the mesophase was clarified by powder X-Ray diffraction experiments carried out at variable temperatures.
The X-ray powder patterns of complexes 3 and 4 indicate the existence of a columnar hexagonal mesophase characterized by a more pronounced degree of disorder when compared to 1 and 2. The small angle region of the spectra consists of two reflections, indexed to the (10) and (11) of a 2D hexagonal lattice (Table 2 and ESI), but the broad reflection centred at 3.6 Å indicating a period stacking within the columns is absent. However, in both cases, it is possible to assume the presence of two molecules per disk, as calculated in the case of complex 2 due to the shape of a single molecule. Assumimg that the association of molecules arises from the stacking of the nitrogen aromatic ligands, a model is proposed for compex 4 as shown in Fig. 1.
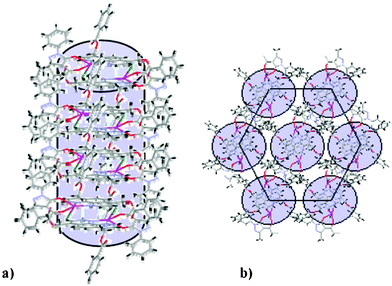 | ||
| Fig. 1 Proposed packing diagrams for the Colh phase of 4 showing the association of molecules through aromatic stacking within the columns (a) and the organization of columns into an hexagonal lattice (b). | ||
As in the case of the dichloro precursors 1 and 2, the presence of the phenanthroline as the main ligand yields a stabilisation of the mesomorphic temperature range with respect to the bipyridine derivatives. Hence, the clearing temperatures of the phenanthroline derivatives turn out to be higher and the range of existence of the mesophase redoubled with respect to the corresponding bipyridine-based analogous complexes.
Complex 5 exhibits an enantiotropic columnar mesomorphism, from nearly room temperature (33 °C) to 122 °C. The PXRD pattern consists, in the small angle region, of two fundamental peaks: the less intense corresponding to the fundamental reflection (20) and the second, more intense, associated with the (11) reflection (Table 2 and Fig. 2). Higher orders of diffraction, all successfully indexed, prove the presence of a columnar rectangular mesophase of symmetry p2gg on the base of the extinction rules (hk no conditions; h0: h = 2n, 0k: k = 2n). In the middle angle region, the reflection centred at 9.4 Å (h2) corresponds to the stacking distance along a column generated by the repetition of dimers into the columnar disk. However, the additional stacking reflection at 4.7 Å (h1) is not clearly visible in the PXRD pattern, being underneath the broad scattering halo corresponding to the liquid-like order of the alkyl chains. Hence, the Z value of about 4, calculated using the stacking distance h2 (almost twice the h1 value) and assuming the density ρ = 1.2 g cm−3, confirms the association of two molecules in the cross-section of the columns. Due to the molecular shape of complex 5 (octahedral), the projection of non-cylindrical columnar cores onto the lattice plane perpendicular to the columnar axis gives rise to elliptical columnar cross-sections, resulting in the rectangular symmetry.
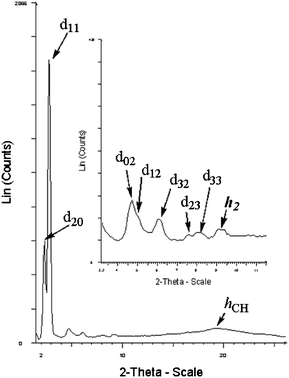 | ||
| Fig. 2 The X-ray pattern of complex 5 in the Colr phase recorded at 100 °C on cooling. | ||
Photophysical measurements
The photophysical behaviour of all of the Zn(II) complexes has been investigated on the solid samples at room temperature and in the mesophase at various temperatures, until the isotropic state has been reached. The complexes are emissive in all of the aggregation states, and most of the data are reported in Table 3, while the complete records can be found in the ESI†. The photophysical properties in solution were not explored because of their instability.| Compound | Solid (room temperature) | Mesophase (T/°C) | ||
|---|---|---|---|---|
| Excitation Spectrum/nm | Em/nm, Φ/% | Excitation spectrum/nm | Em/nm, Φ/% | |
| 1 | 320, 370 | 454, 7.00 | 335, 390 | 500, 2.10 (90 °C) |
| [(L1)ZnCl2] | (90 °C) | |||
| 2 | 350 | 516, 17.50 | 356 | 510, 17.81 (70 °C) |
| [(L2)ZnCl2] | (70 °C) | |||
| 3 | 310, 363 | 561, 5.70 | 310, 367 | 563, 1.30 (70 °C) |
| [(L1)Zn(Q)(Cl)] | (70 °C) | |||
| 4 | 320 | 508, 22.00 | 320 | 511, 10.82 (60° C) |
| [(L2)Zn(Q)(Cl)] | (60 °C) | |||
| 5 | 367, 394 | 562, 0.80 | 367, 394 | 564, 0.29 (60 °C) |
| [(L2)Zn(Q)2] | (60 °C) | |||
The excitation spectra of the solid samples were used to attribute electronic transitions. The low-energy peak of complexes 1–5 ranges from 350 to 394 nm (Fig. 3 and Table 3). The spectral properties of all Zn(II) complexes derive from the transitions localized on the aromatic rings of the bipyridine or the phenanthroline coordinated to the zinc ion. These transitions are attributed to a metal-perturbed π–π* ligand-centred (LC) transition, as can be inferred taking into account the L1 and L2 electronic spectra (see ESI†).10
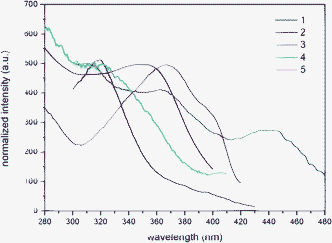 | ||
| Fig. 3 Excitation spectra of 1–5 recorded from solid samples at room temperature. | ||
The de-excitation of the LC state is responsible for the luminescence of complexes 1–5, all emitting in the 454–562 nm range (Table 3), with large Stokes shifts. Generally, the Stokes' shift (SS) is correlated to the distortion between the electronic ground-state and the excited-state geometry;20 consequently, an SS increase reflects a relief from conformational strain.
Indeed, an increase of the SS values is observed for the phenanthroline homologues, on going from complex 5 (7587 cm−1) to compound 2 (9192 cm−1) and to complex 4 (11565 cm−1), as well as for the bipyridine derivatives on going from complex 1 (SS value of 5000 cm−1) to complex 3 (9720 cm 1). The observed increase of the SS values is consistent with the higher degree of freedom for a possible distortion caused by electronic excitation of a square-pyramidal arrangement with respect to both tetrahedral and octahedral coordination geometries.
Complexes 1–5 exhibit remarkable emission quantum yields (Φ) in the solid state (Table 3), the values of which are determined by the electronic effects combined with those of the excited state structural relaxation. The trend of the Φ-value in the solid sample of the bipyridine-derived compounds merely follows a correlation with the rigidity of the coordination around the metal centre. Indeed, complex 1 shows Φ = 7.00%, while complex 3, the geometry of which could be easily distorted in the excited state, shows a Φ = 5.70%. In the case of the phenanthroline Zn(II) derivatives the opposite trend is observed; the octahedral compound 5 shows a very low value of Φ (0.8%), which increases, for compound 2, up to 17.5%, and reaches the exceptional value of 22% for complex 4.
The photophysical behaviour of complexes 1–5 were also explored at variable temperature, starting from the solid state up to the isotropic liquid, in order to prove the role of the aggregation states on the luminescence properties. As regards the excitation spectra, by heating the samples, the shape of the spectra, for all of the complexes, are substantially identical to those recorded at room temperature in the solid state.
The emission spectra, recorded at various temperatures, are similar for all Zn(II) complexes (see a representative example in Fig. 4), and consist of a broad band in the 500–564 nm range (Table 3 and ESI†). The shape of the spectra remains unvaried on heating the samples, but the emission maxima show a slight temperature-dependent red-shift ranging from 61 nm for 1 to 2 nm for 5, followed by a reversible blue-shift by decreasing the temperature. This behaviour is easily rationalized considering that, at higher temperatures, an increase of the vibrational states density occurs.21 Consequently, in the transition moment dipole integral, the Franck–Condon overlap factor involves vibronic levels close in energy, so the emission wavelength increases. A residual emission is preserved also in the isotropic state where 1–5 show the maximum value of the emission wavelength (Fig. 4 and ESI†).
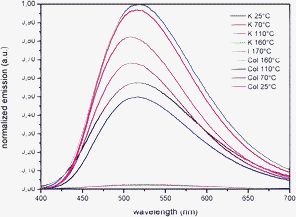 | ||
| Fig. 4 Emission spectra of 2 (λex = 360 nm) during the first heating and cooling cycle. | ||
Since 1–5, in their liquid crystalline state, show the same photoluminescent profiles observed at room temperature, the emission is attributed to the same excited states for both of the aggregation states. Indeed, if the emission profiles of complexes 1–5 recorded at both the same aggregation state (i.e. isotropic state at different temperature) and the same temperature (different aggregation states) (Fig. 5), it is possible to derive that the emission properties are intrinsic to the complexes despite of their aggregation modes.
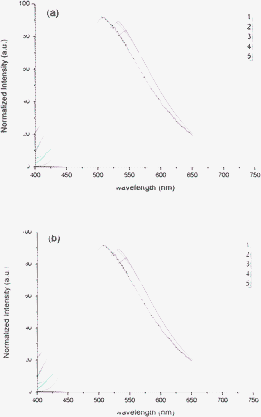 | ||
| Fig. 5 Emission spectra of compounds 1–5 at the isotropic point (a) and at 65 °C (b). | ||
The SS values measured in the mesophase are larger than those in the solid state, due to the greater fluidity of the mesophase and the temperature rise, which facilitates the vibrational relaxation (Table 3 and ESI†). However, in the case of complex 5, the SS value remains almost unvaried (7650 cm−1) due to a decrease of fluidity in the rectangular columnar mesophase.
The SS values measured in the mesophase follow the same trend already observed in the solid state, with an increase moving from the tetrahedral geometry (5640 cm−1 for 1 and 8482 cm−1 for 2) towards the square pyramidal one (9486 cm−1 and 11686 cm−1 for 3 and 4, respectively).
In Fig. 6 it is possible to note that the emission quantum yield values result decreased from the solid to the mesophase and, even more, in the isotropic liquid, the dependence from the temperature being less effective, probably because the sample is more fluid, so favouring radiationless decays. However, this inverse proportionality of the Φ values with respect to the temperature is a phenomenon that is more dramatic during the first heating cycle than during the successive heating cycles, due to the differences between the pristine solid and the room temperature solid obtained by cooling down the mesophase. Indeed, starting from the second heating cycle, all heating and cooling cycles are practically superimposable.
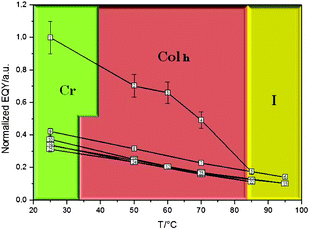 | ||
| Fig. 6 A diagram of temperature vs. emission quantum yield measured for 3. The numbers within the squares represent the order of the measures along a series of heating and cooling cycles. The Φ uncertainty is reported. | ||
However, for both the dichloro complexes 1 and 2, the presence of solvent molecules in the sample is responsible, during the first heating cycle, for an anomalous temperature-dependent Φ-increase (ESI†).
Conclusions
Three different types of Zn(II) mesogens based on N,N chelating ligands of increasing aromaticity (2,2′-bipyridine and 1,10-phenanthroline) have been synthesised, taking advantage of the easiness with which the coordination number of the Zn(II) compounds can be varied through the nature and number of ancillary ligands used. Indeed, tetracoordinated Zn(II) complexes ([(Ln)ZnCl2]) have been obtained by using a monodentate ligand in a 1![[thin space (1/6-em)]](https://www.rsc.org/images/entities/char_2009.gif) :
:![[thin space (1/6-em)]](https://www.rsc.org/images/entities/char_2009.gif) 2 molar ratio (metal:ligand), while one or two units of the O,O chelating 1-phenyl-3-methyl-4-(1-tert-butylphenyl)-5-pyrazolone (HQ) ligand, afforded penta- ([(Ln)Zn(Q)(Cl)]) or hexacoordinated ([(L2)Zn(Q)2]) derivatives, respectively.
2 molar ratio (metal:ligand), while one or two units of the O,O chelating 1-phenyl-3-methyl-4-(1-tert-butylphenyl)-5-pyrazolone (HQ) ligand, afforded penta- ([(Ln)Zn(Q)(Cl)]) or hexacoordinated ([(L2)Zn(Q)2]) derivatives, respectively.
The peripheral polycatenar tails grafted on the nitrogen ligands promote columnar mesomorphism, even at very low temperature, in all of the Zn(II) derivatives, in spite of their various architectures, confirming that shapes and coordination geometries are no longer a constraint that prevents the onset of mesomorphism in metallomesogens.
A systematic study of the photophysical properties has been performed along an extended range of temperature, as a function of temperature and aggregation state.
For all of the complexes the green luminescence recorded, at room temperature, in the solid state is retained also in the mesophase and even in the isotropic state, with a general and reversible red-shift related to a temperature increase.
Large Stokes shifts have been observed for all of the Zn(II) complexes, in both solid and liquid crystalline states, the values of which are related to the flexibility of the coordination geometry around the metal centre, taking into account the degree of distortion suffered on going from the ground to the excited electronic state. In particular, the observed increase of the SS values is consistent with the higher degree of freedom for a possible distortion caused by electronic excitation of a square-pyramidal arrangement with respect to both tetrahedral and octahedral coordination geometries.
An exhaustive study of the emission quantum yields as a function of the temperature was performed, showing a general but slight decrease with respect to the solid state.
Thus, the molecular properties have been found to predominate over the intermolecular interactions, allowing preservation of the same photophysical properties in every aggregation state.
Acknowledgements
Financial support received from the Ministero dell'Istruzione, dell'Università e della Ricerca (MIUR) through the Centro di Eccellenza CEMIF.CAL (CLAB01TYEF) is gratefully acknowledged.References
- M. O'Neill and S. M. Kelly, Adv. Mater., 2003, 15, 1135 CrossRef CAS.
- M. O'Neill and S. M. Kelly, Adv. Mater., 2011, 23, 566 CrossRef CAS.
- R. C. Evans, P. Douglas and C. J. Winscom, Coord. Chem. Rev., 2006, 250, 2093 CrossRef CAS.
- K. Binnemans, J. Mater. Chem., 2009, 19, 448 RSC.
- D. Pucci, I. Aiello, A. Bellusci, A. Crispini, M. Ghedini and M. La Deda, Eur. J. Inorg. Chem., 2009, 4274 CrossRef CAS.
- E. Cavero, S. Uriel, P. Romero, J. L. Serrano and R. Giménez, J. Am. Chem. Soc., 2007, 129, 11608 CrossRef CAS.
- D. Pucci, A. Bellusci, A. Crispini, M. Ghedini, N. Godbert, E. I. Szerb and A. M. Talarico, J. Mater. Chem., 2009, 19, 7643 RSC.
- E. I. Szerb, A. M. Talarico, I. Aiello, A. Crispini, N. Godbert, D. Pucci, T. Pugliese and M. Ghedini, Eur. J. Inorg. Chem., 2010, 3270 CrossRef CAS.
- C. Pettinari, N. Masciocchi, L. Pandolfo and D. Pucci, Chem.–Eur. J., 2010, 16, 1106 CrossRef CAS.
- E. I. Szerb, A. Crispini, M. La Deda, D. Pucci, P. F. Liguori and C. Pettinari, Mol. Cryst. Liq. Cryst., 2011, 549, 86 CAS.
- B. S. Jensen, Acta Chem. Scand., 1959, 13, 1668 CrossRef CAS.
- G. Barberio, A. Bellusci, A. Crispini, M. Ghedini, A. Golemme, P. Prus and D. Pucci, Eur. J. Inorg. Chem., 2005, 181 CrossRef CAS.
- J. C. de Mello, H. F. Wittmann and R. H. Friend, Adv. Mater., 1997, 9, 230 CrossRef CAS.
- L. O. Palsonn and A. P. Monkman, Adv. Mater., 2002, 14, 757 CrossRef.
- L. Porres, A. Holland, L. O. Palsonn, A. P. Monkman, C. Kemp and A. Beeby, J. Fluoresc., 2006, 16, 267 CrossRef CAS.
- D. Pucci, G. Barberio, O. Francescangeli, M. Ghedini and M. La Deda, Eur. J. Inorg. Chem., 2003, 3649 CrossRef CAS.
- P. F. Liguori, A. Valentini, M. Palma, A. Bellusci, S. Bernardini, M. Ghedini, M. L. Panno, C. Pettinari, F. Marchetti, A. Crispini and D. Pucci, Dalton Trans., 2010, 39, 4205 RSC.
- F. Marchetti, C. Pettinari, R. Pettinari, D. Arriva, S. Troyanov and A. Drozdov, Inorg. Chim. Acta, 2000, 307, 97 CrossRef CAS.
- C. Pettinari, F. Marchetti, R. Pettinari, A. Drozdov, S. Troyanov, A. I. Voloshin and N. M. Shavalev, J. Chem. Soc., Dalton Trans., 2002, 1409 RSC.
- (a) B. Xu and S. Holdcroft, Macromolecules, 1993, 26, 4457–4460 CrossRef CAS; (b) N. I. Nijegorodov and W. S. Downey, J. Phys. Chem., 1994, 98, 5639 CrossRef CAS.
- K.K. Rohatgi-Mukherjee, Fundamentals of Photochemistry Revised Edition, New Age International Limited, New Delhi, 1997 Search PubMed.
Footnote |
| † Electronic Supplementary Information (ESI) available. See DOI: 10.1039/c2ra20700a/ |
| This journal is © The Royal Society of Chemistry 2012 |
