Influence of external electrolyte on ion exchange in Nafion membranes
E. Siva Subramaniam
Iyer
and
Anindya
Datta
*
Department of Chemistry, Indian Institute of Technology Bombay, Powai, Mumbai 400076, India. E-mail: anindya@chem.iitb.ac.in; Fax: +91-22-2576-3480; Tel: +91-22-2576-7149
First published on 26th June 2012
Abstract
The influence of the electrolyte on the cation exchange process of Nafion membranes has been studied using 2-(2′-pyridyl)benzimidazole (2PBI) as a fluorescent probe. The relative fluorescence intensities at 360 and 470 nm of this molecule are found to be different in Na+-exchanged Nafion membranes. The relative contributions of the two phototautomers emitting at these two wavelengths is found to depend on the method of incorporation of Na+ ion as well as the fluorophore. The fluorescence data, in conjunction with the lifetimes, are used to develop a model to rationalize the role of co-ions present in the electrolyte on the ion exchange process of Nafion.
Introduction
Ion exchange is a ubiquitous process. It occurs in biological systems in the form of transmembrane ion transport. on the other hand ion exchange finds applications in fuel cells, water purification, dialysis, etc. This process is quite facile in Nafion, an ionomer that is used as a polymer electrolyte membrane in fuel cells,1 as cation exchange resin in chlor-alkali industry2 and as catalyst in various organic reactions.3 Spectroscopic studies on Nafion is fast emerging into a field of intense activity.4–8 Its structure comprises of a Teflon backbone with pendant sulfonate groups (Scheme 1), making the polymer remarkably permselective.9 The negative charge of these groups is neutralized by mobile counterions. H3O+ is the counterion in the case of the native membrane, but can be easily replaced by cations by dipping the membrane in solutions of electrolytes containing different cations.10–12 Several attempts have been made to understand the effect of ions on the mobility of cations in Nafion.13–16 Most of these studies focus on the effect of cations, but a few reports on anion dependence on transport of cations are also available.17,18 Goswami and co-workers, for example, have shown that mercury(II) ions in solution are absorbed in different oxidation states, depending on the electrolyte present in the solution from which they are taken up by Nafion. When loaded from Hg(NO3)2, the charge of the species inside the membrane has been found to be +2, as expected. However, for ions taken up from HgCl2, it is +1. This is rationalized in the light of absorption of [HgCl]+ ions from the solution in the first case.19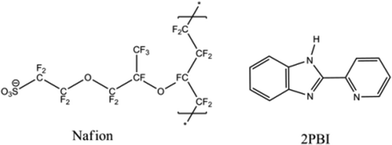 | ||
| Scheme 1 Structure of Nafion and 2PBI. | ||
In the present article, we discuss the uptake of Na+ ions by Nafion, from aqueous solutions of NaCl and NaOH. As has been stated in the previous paragraph, the uptake of anions by Nafion is minimal. Both NaCl and NaOH being strong electrolytes in water, one might expect the cation uptake from the two solutions to be identical. However, as has been discussed in the sections that follow, this is not the case. In the present experiments, cation exchange has been monitored by fluorescence spectroscopy, using 2-(2′-pyridyl)benzimidazole (2PBI, Scheme 1). 2PBI undergoes excited state proton transfer (ESPT) in its protonated form, in acidic aqueous solutions.20 The proton transfer is manifested in a significantly Stokes shifted emission at 460 nm, ascribed to the excited state tautomer T* (Scheme 2). The normal (N*) and “cationic” (C*) forms, in which the pyridyl nitrogen is not protonated, emit at 360 nm. The proton transfer can be brought about in microheterogeneous media in which aqueous and apolar compartments are separated by a negatively charged interface.21–24 It has been observed earlier that in native Nafion membrane, the ground state is dicationic (D). Upon excitation, a proton is lost and T*, but not C* is formed. In Nafion membranes where H3O+ is replaced with Na+ or (CH3)4N+ ions , the ground state is monocationic (C), and dual emission from C* and T* is observed.21 The ratio of intensities of normal and tautomer fluorescence has been found to be different in Na+- and (CH3)4N+-exchanged membranes. This has been rationalized in the light of the difference in water contents of Na+- and (CH3)4N+-exchanged membranes.23 In another experiment, our group has proposed that (CH3)4N+ and Na+ ions are distributed differently inside the water channels of Nafion.25–27 In the present experiments, the relative intensities of emission of the two tautomers, as well as their lifetimes, has been used to monitor the uptake of cations by Nafion membranes, from the two different electrolyte solutions.
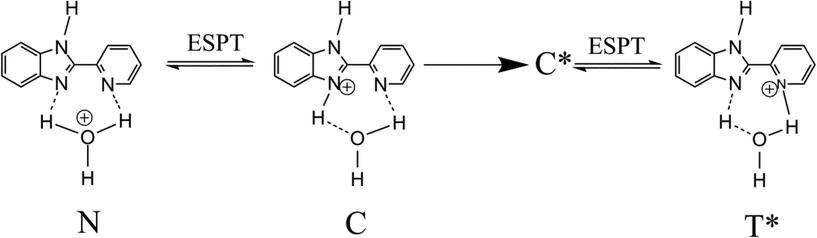 | ||
| Scheme 2 2PBI in its neutral and monocationic forms; T* is formed only in the excited state, by ESPT from electronically excited C*. | ||
Experimental section
Nafion 117 (equivalent weight 1100, 0.007 inches thick) membrane was procured from Aldrich. NaOH and NaCl (AR grade) from Merck, were used as received. 2PBI from Aldrich was recrystallised from cyclohexane prior to use. Nafion membrane was activated by boiling sequentially in 3% H2O2 for 1 h, 1 M HNO3 for 3 h and in double distilled water for 3 h. The process was repeated until a visually transparent membrane was obtained. In order to perform the cation exchange, this membrane was dipped either in 1 M NaCl or 1 M NaOH solution, for 24 h and the solution was stirred. Both the batches of Na+-exchanged membranes thus prepared were divided into three parts. Each part was dipped in one of the following aqueous solutions of 2PBI (maximum absorbance = 0.8): (i) with no co-solute, (ii) containing 1 M NaCl and (iii) containing 1 M NaOH. Thus, six different batches of membranes are prepared, with different combinations of solutions used for incorporation of Na+ ions and 2PBI. They were labelled in order to distinguish them from each other (Table 1). Steady-state absorption and fluorescence spectra were recorded on JASCO V530 absorption spectrophotometer and Varian Cary Eclipse spectrofluorimeter, respectively. Time-resolved fluorescence experiments were performed in an IBH Horiba-Jovian fluorocube.24 The decays were recorded at the magic angle with the sample excited by a NanoLed, emitting at 295 nm and with full width at half maximum of 700 ps. The membrane was kept at 45° to the excitation source such that the excitation light was directed opposite to the detector and fluorescence was collected from the back surface of the membrane. The data obtained were fitted to multiexponential functions by an iterative reconvolution technique, using DAS 6.2 data analysis software.Results and discussion
The shape of absorption spectra recorded is the same for all the samples (Fig. 1), but the extents of loading are not, as is evidenced by the difference in absorbances at spectral maxima. The amount of dye loaded from NaOH solution is the least. Even after immersing the membrane for more than 24 h in the alkaline solution of the dye, the absorbance of dye loaded in the membrane does not exceed 0.04. On the contrary, the absorbance reaches a value of 0.5 in a few minutes when the membrane is dipped in an aqueous solution of 2PBI. This is explained on the basis of the species present in the solution. In NaOH solution, the dye is present in anionic form and hence its uptake is hindered, due to electrostatic repulsion with the sulfonate groups; however, it is not stopped altogether. There have been earlier reports of incorporation of co-ions at high electrolyte concentrations.28 Upon incorporation, the dye takes up one or more protons and exists as a cation or a neutral molecule, as is evident in the absorption and fluorescence spectra (Fig. 1). Fluorescence spectra are independent of the excitation wavelength. Irrespective of its state of protonation/deprotonation in the electrolyte solutions from which it is incorporated into the membrane, 2PBI exists in the cationic form in Na+-exchanged membranes, as is evidenced later from fluorescence lifetimes. The absorption spectrum is the same in all these membranes, indicating that the ground state of the fluorophore is the same in all cases. On the other hand, contributions of the two emissive states C* and T* to the fluorescence spectra depend on the solution from which cation exchange is performed as well as the solution from which the dye is loaded.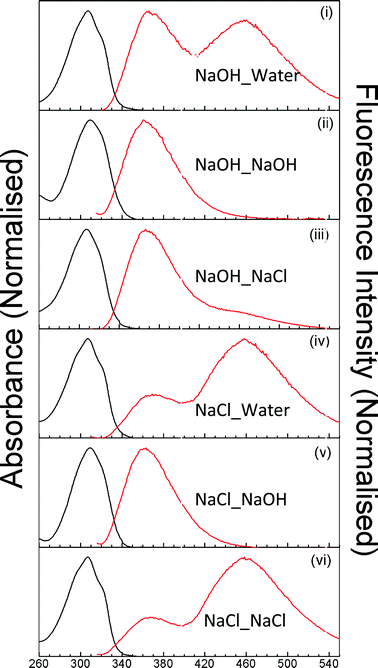 | ||
| Fig. 1 The normalized absorption (black) and fluorescence (red) spectra of 2PBI in various cation-exchanged membranes. | ||
It may be recalled here that the environment of the nanochannels of cation-exchanged membranes is different from that of native membranes and is dependent on the counterion that has replaced H3O+. Na+ ions are uniformly distributed in the water pores and more or less a uniform water environment is observed. This inference was drawn from a experiment performed earlier in our group where the ESPT in 2PBI in Na+- and (CH3)4N+-exchanged membranes were compared. When the ion exchange is performed with (CH3)4N+ ions, a more water-like environment is observed by the fluorophore. This is explained on the basis of the preferential localization of the bulky (CH3)4N+ ions near the negatively charged interface, formed by the sulfonate groups. Due to electrostatic repulsion with this layer of cations, cationic dye molecules are kept away from the interface and experience a more bulk-like environment present in the water channels.25 This difference in location causes a difference in the extent of proton transfer in 2PBI, which is solvent mediated. A change in amount of H+ ions would also influence the extent of tautomerization. Thus the extent of ESPT can indicate the level of heterogeneity inside the membrane.
The extent of ESPT is different in the different systems. The most remarkable observation is the absence of T* emission from the spectra of 2PBI in membranes in which it has been loaded from solutions containing NaOH (Fig. 1 (ii), (v)). As has been discussed already, the extent of incorporation of 2PBI in these membranes is very low. The reason for absence of T* fluorescence in the spectra from these membranes is that the small number of cationic 2PBI molecules in these membranes get attracted to the sulfonate groups and do not get a chance to interact with the water molecules and undergo ESPT. The second important observation is that the extent of ESPT is significantly greater in membranes in which Na+ incorporation has been carried out from NaCl solution (Fig. 1 (iv), (vi)) than their counterparts in which the incorporation has been carried out from NaOH solution (Fig. 1(i), (iii)). Besides, prominent T* fluorescence is observed in the membrane in which Na+ has been incorporated from NaOH solution, but 2PBI has been incorporated from aqueous solution (Fig. 1(i)), as compared to those in which 2PBI has been incorporated from NaCl solution (Fig. 1(iii)). Interestingly, such a difference is not observed between the fluorescence spectra of 2PBI in membranes in which Na+ uptake is from NaCl solution and dye uptake is from aqueous solution (Fig. 1(iv)) and those in which both Na+ and 2PBI uptake are from NaCl solutions (Fig. 1(vi)).
The picture that emerges from the observation of relatively lesser T* emission in membranes in which Na+ incorporation has occurred from NaOH is as follows: the acidity, as indicated by the relative contribution of T* to fluorescence, is greater in membranes in which Na+ ions are incorporated from NaCl solutions, compared to that in membranes in which Na+ uptake is from NaOH solution. Keeping in mind that a greater acidity implies a lesser extent of Na+ incorporation, one may infer that the extent of Na+ uptake is greater in membranes that are immersed in NaOH solution. This is surprising, as the membrane is strongly permselective and is not expected to take up a significant amount of the anions, no matter whether they are OH− ions or Cl− ions. So, the effect of the anion, present in the electrolyte, must be to affect the propensity of cation exchange in Nafion. Since both NaCl and NaOH are strong electrolytes, incorporation of the anion as members of ion pairs can be ruled out. The possibility of a difference in the concentration of Na+ ions in equimolar aqueous solutions does not arise either. A possible mechanism of the increased Na+ incorporation from NaOH could involve a more facile abstraction of hydronium ions from the membrane by the OH− ions present in NaOH solutions. Such an effect would be absent in NaCl. Alternatively, OH− ions might facilitate the uptake of Na+ by Nafion through a more direct mechanism. The transport number of Cl− is less than that of OH−,29 as particulate migration is a much less efficient mechanism than the Grotthus mechanism operative in OH−. So, the migration of Na+ ions from water to Nafion would be associated with a lesser hindrance from OH− ions that it would from Cl− ions.
A comparison of Fig. 1(i) with Fig. 1(iii) reveals that for Nafion membranes in which Na+ ions have been incorporated from NaOH, T* emission is more prominent when incorporation of 2PBI occurs from aqueous solutions, in comparison with that when 2PBI is incorporated from NaCl solutions. This implies that the acidity within the nanochannels is greater, or in other words, the effective concentration of Na+ ions is less in the first case. It may be remembered here that prior to incorporation of 2PBI, the extent of loading of Na+ ions is the same in the two membranes, as in both the cases, the Na+ ion incorporation step is identical. Thus, it may be inferred that of Na+ ions leach out when the membranes are immersed in aqueous solutions of the dye, containing no co-solute with Na+ ions. In such a case, the effective H3O+ ion content in the membrane increases in order to maintain charge neutrality, thereby facilitating the ESPT process from C* to T* form in 2PBI. It has been reported previously that simple cations may leach out if the cation exchanged membranes are dipped in highly acidic solutions.30 Here, we observe that cations can leach out even when the external medium is neutral. This model suffers an apparent setback upon inspection of Fig. 1(iv) and Fig. 1(vi), as the fluorescence spectra of 2PBI in Nafion membranes, in which Na+-incorporation takes place from NaCl solutions, remains almost the same, no matter whether incorporation of 2PBI is carried out from aqueous solutions or from NaCl solutions. This apparent anomaly may be rationalized using the inference drawn from the comparison of membranes in which Na+ ions are incorporated from NaOH and NaCl solutions. The extent of loading of Na+ is less in the second case and so 2PBI experiences a more water-like environment in these membranes. It appears that the leaching out of Na+ ions, when 2PBI is incorporated from an aqueous solution in this case, does not alter the microenvironment experienced by the fluorophore to any great extent, possibly due to the low initial Na+ uptake.
Fluorescence decays have been recorded in an attempt to get a better insight of the situation. The decays have been recorded at emission wavelengths of 360 and 470 nm, which are the characteristic fluorescence maxima of C* and T*, respectively. The decays at 360 nm are faster than those at 470 nm in all cases (Fig. 2) and are biexponential, except for the cases where 2PBI is incorporated into the membrane from NaOH solution. In this case the decays are single exponential (Fig. 2(ii), (v)). The lifetime associated with the single exponential decay in the membrane in which the Na+ ions are incorporated from NaOH is 2.06 ns, while that in the membrane in which the ions are incorporated from NaCl is 1.70 ns. This difference in lifetimes may be rationalized in the light of the difference in the polarity of the water nanochannels in the two membranes. For the other membranes, the fluorescence decays of 2PBI at λem = 360 nm are fitted to two components of ∼600 ps and ∼1.6–2.2 ns (Table 2). The decays at 470 nm have not been recorded for membranes where 2PBI has been incorporated from NaOH solutions, as there is no T* band in the steady-state fluorescence spectra in these cases (Fig. 1(ii), (v)). For the other membranes, the traces recorded at 470 nm are biexponential, with a decaying component of 4.9 ns and a rising component of ∼560 ps (Table 2). The 4.9 ns component at 470 nm is assigned to a T* emission. The fast component at 360 nm (C* fluorescence) matches the risetime observed at 470 nm (T* fluorescence). So, this component is assigned to ESPT of C* to T*. The slower component at 360 nm is ascribed to fluorescence from C* molecules that do not undergo ESPT. Thus, the model of ion transport, proposed from steady-state fluorescence spectra, gains further credence, as the fluorescing species are identified by their lifetimes, and occurrence or non-occurrence of ESPT under different conditions is marked by the risetimes in T* fluorescence, or lack thereof, in different cases.
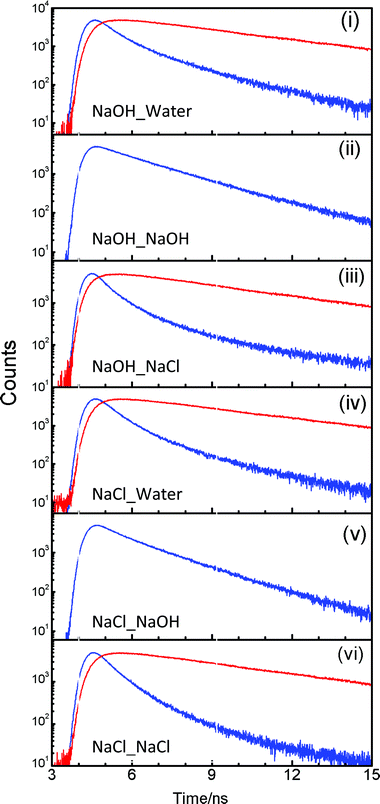 | ||
| Fig. 2 Fluorescence decays of 2PBI in different cation exchanged membranes at λem = 370 nm (blue) and λem = 470 nm (red). Fluorescence decays of 2PBI at λem = 460 nm for (ii) and (v) have not been recorded as these membranes do not exhibit T* fluorescence. | ||
| Label | λ em/nm | τ 1/ns | τ 2/ns | a 1 | a 2 |
|---|---|---|---|---|---|
| NaOH_Water | 360 | 0.46 | 1.89 | 0.77 | 0.23 |
| NaOH_NaOH | — | 2.06 | — | 1.00 | |
| NaOH_NaCl | 0.58 | 2.21 | 0.86 | 0.14 | |
| NaCl_Water | 0.60 | 1.87 | 0.35 | 0.65 | |
| NaCl_NaOH | — | 1.70 | — | 1.00 | |
| NaCl_NaCl | 0.61 | 1.66 | 0.85 | 0.15 | |
| NaOH_Water | |||||
| NaOH_NaCl | |||||
| NaCl_Water | 470 | 0.56 | 4.96 | −0.90 | 1.90 |
| NaCl_NaCl | |||||
Conclusion
The potential of fluorescence techniques in monitoring the ion-exchange behaviour in membranes is brought out, using 2PBI as an example. The difference in extent of ESPT of this molecule in these Nafion membranes, obtained by cation exchange from different electrolytes, indicates that incorporation of Na+ ions in Nafion occurs more efficiently from NaOH solution than from NaCl solution. Leaching out of Na+ ions from Nafion to water is found to take place at sufficiently high levels of Na+-loading of the membrane. Such leaching is suppressed in the presence of Na+ ions in the external solution.Acknowledgements
The authors thank the Naval Research Board, India for a generous research grant. E. S. S. I. thanks CSIR, India for a Senior Research Fellowship.References
- K. A. Mauritz and R. B. Moore, Chem. Rev., 2004, 104, 4535 CrossRef CAS
.
- K-D. Kreuer, S. J. Paddinson, E. Spohr and M. Schuster, Chem. Rev., 2004, 104, 4637 CrossRef CAS
- G. Gelbard, Ind. Eng. Chem. Res., 2005, 44, 8468 CrossRef CAS
- D. K. Lee, T.i Saito, A. J. Benesi, M. A. Hickner and H. R. Allcock, J. Phys. Chem. B, 2011, 115, 776 CrossRef CAS
- Z.u Ma, R. Jiang, M. E. Myers, E. L. Thompson Jr. and C. S. Gittleman, J. Mater. Chem., 2011, 21, 9302 RSC
- D. B. Spry and M. D. Fayer, J. Phys. Chem. B, 2009, 113, 10210 CrossRef CAS
- T. N. Burai and A. Datta, J. Phys. Chem. B, 2009, 113, 15901 CrossRef CAS
- K. Schmidt-Rohr and Q. Chen, Nat. Mater., 2007, 7, 75 CrossRef
- T. D. Gierke, G. E. Munn and F. C. Wilson, J. Polym. Sci., Polym. Phys. Ed., 1981, 19, 1687 CrossRef CAS
- J. Palomo and P. N. Pintauro, J. Membr. Sci., 2003, 215, 103 CrossRef CAS
- L. A. Stenina, Ph. Sistat, A. I. Rebrov, G. Pourcelly and A. Yaroslavstev, Desalination, 2004, 170, 49 CrossRef
- K. Hognsirikarn, J. G. Goodwin Jr., S. Greenway and S. Creager, J. Power Sources, 2010, 195, 7213 CrossRef
- P. Holzhauser and K. Bouzek, J. Appl. Electrochem., 2006, 36, 703 CrossRef CAS
- M. Userandi, J. Parrando and F. Mijangos, Int. J. Chem. React. Eng., 2008, 6, A59 Search PubMed
- R. S. L. Yee, R. A. Rozendalb, K. Zhangc and B. P. Ladewiga, Chem. Eng. Res. Des., 2012, 90, 950 CrossRef
- S. Chaudhurya, C. Agarwala, A. K. Pandeya, V. T. Aherb, L. Panicker, S. V. Ramagirid, J. R. Bellared and A. Goswami, J. Membr. Sci., 2011, 382, 262 CrossRef
- S. Chaudhary, C. Agarwal, A. K. Pandey and A. Goswami, J. Phys. Chem. B, 2012, 116, 1605 CrossRef
- C. Agarwal, S. Chaudhury, A. Mhatre and A. Goswami, Desalinisation, 2012, 38, 222 Search PubMed
- C. Agarwal, S. Chaudhury, A. Mhatre and A. Goswami, J. Phys. Chem. B, 2010, 114, 4471 CrossRef CAS
- F. Rodriguez-Prieto, M. Mosquera and M. Novo, J. Phys. Chem., 1990, 94, 8536 CrossRef CAS
- T. K. Mukherjee, P. Ahuja, A. L. Koner and A. Datta, J. Phys. Chem. B, 2005, 109, 12567 CrossRef CAS
- T. K. Mukherjee, D. Panda and A. Datta, J. Phys. Chem. B, 2005, 109, 18895 CrossRef CAS
- T. K. Mukherjee and A. Datta, J. Phys. Chem. B, 2006, 110, 2611 CrossRef CAS
- E. S. S. Iyer, D. Samanta, A. Dey, A. Kundu and A. Datta, J. Phys. Chem. B, 2012, 116, 1586 CrossRef CAS
- T. N. Burai and A. Datta, J. Phys. Chem. B, 2009, 113, 15901 CrossRef CAS
- E. S. S. Iyer and A. Datta, J. Phys. Chem. B, 2012, 116, 5302 CrossRef CAS
- E. S. S. Iyer and A. Datta, J. Phys. Chem. B, 2011, 115, 8707 CrossRef CAS
- P. N. Pintauro and D. N. Bennion, Ind. Eng. Chem. Fundam., 1984, 23, 234 CAS
- S. Koter, Sep. Purif. Technol., 2001, 22–23, 643 CrossRef
- C. C. R.Wang, J. W. Strojek and T. Kuwana, J. Phys. Chem., 1987, 91, 3606 CrossRef
| This journal is © The Royal Society of Chemistry 2012 |