Effect of polyphenyl-substituted ethylene end-capped groups in metal-free organic dyes on performance of dye-sensitized solar cells†
Chengjian
Chen‡
,
Jin-Yun
Liao‡
,
Zhenguo
Chi
*,
Bingjia
Xu
,
Xiqi
Zhang
,
Dai-Bin
Kuang
*,
Yi
Zhang
,
Siwei
Liu
and
Jiarui
Xu
PCFM Lab, DSAPM Lab, MOE Key Laboratory of Bioinorganic and Synthetic Chemistry, KLGHEI of Environment and Energy Chemistry, State Key Laboratory of Optoelectronic Materials and Technologies, School of Chemistry and Chemical Engineering, Sun Yat-sen University, Guangzhou, 510275, P. R. China. E-mail: chizhg@mail.sysu.edu.cn; kuangdb@mail.sysu.edu.cn; Fax: +86 20 84112222; Tel: +86 20 84112712
First published on 30th July 2012
Abstract
A novel series of highly similar and comparable metal-free organic dyes have been designed and synthesized for dye-sensitized solar cells (DSSCs). The end-capped groups, namely, diphenylethylene, triphenylethylene, and tetraphenylethylene, have significant effects on the performance of DSSCs. The DSSC based on a triphenylethylene end-capped dye exhibits the highest power conversion efficiency (η) of 6.29%, whereas that based on a tetraphenylethylene end-capped dye has the highest open-circuit photovoltage (Voc) of 804 mV. The Voc of the DSSCs can be greatly improved upon the incorporation of a twisted non-planar aggregation-induced emission (AIE) moiety in the molecular structure of the dyes. The triphenylethylene group with a moderately twisted non-planar structure is found to be suitable for the improvement of the power conversion efficiency. The dyes exhibit an aggregation-caused emission quenching effect, i.e., the dyes do not emit light after being adsorbed on TiO2 films, although they contain aggregation-induced emission triphenylethylene and tetraphenylethylene moieties.
Introduction
The present energy and environmental crises have stimulated interests on the search for clean and alternative sources of energy. Solar energy is the favorite among several forms of energy being harnessed through new technologies, as it is inexhaustible and always available for use. As one of the most important solar photovoltaic devices, dye-sensitized solar cells (DSSCs) based on coordination complexes have been receiving great attention since the breakthrough reported by Grätzel in 1991.1 However, the complexes they reported contained the rare and expensive metal ruthenium and required careful synthesis involving tricky purification steps. Thus, the investigation on DSSCs synthesized using metal-free organic dyes emerged as a necessity. Compared with metal complexes, metal-free organic dyes have the advantages of environmental friendliness, higher structural flexibility, lower costs, easier preparation and purification, and so on.2 The most significant advantage, however, may be their tunable absorption and electrochemical properties through appropriate molecular design strategies. In the last decade, numerous metal-free organic dyes with photopower conversion efficiencies (η) of over 5% have been reported, such as hemicyanine dye, polyene-diphenylaniline dye, thienylfluorence dye, phenothiazine dye, thienothiophene-thiophene-derived dye, phenyl-conjugated polyene dye, N,N-dimethylaniline-cyanoacetic acid dye, porphyrin dye, oligothiophene dye, coumarin dye, oligo-phenylenevinylene-unit dye, indoline dye and pyranylidene dye.3 Notably, under standard air mass (AM) 1.5 G simulated sunlight, DSSC based on thienothiophene dye C217 adhering an antireflection film to the DSSC photoanode have shown η of up to 9.8%.4 Control of dye aggregation by chenodeoxycholic acid (CDCA) is often used to improve the performance of DSSCs.5 From an applicative point of view, the use of anti-aggregation reagents to solve the aggregation problem is not the best choice. Therefore, a dye with inherent anti-aggregation has become one of the best options for a practical and useful DSSCs candidate.Phenothiazine contains electron-rich nitrogen and sulfur heteroatoms in a heterocyclic structure with high electron-donating ability, making its derivatives suitable hole transport materials for organic devices. In addition, this compound's non-planar butterfly conformation can impede molecular aggregation and formation of intermolecular excimers.6 Therefore, the efficiency of DSSCs could be increased by using phenothiazine as the sensitizer. However, despite their potential, few studies reporting phenothiazine-based sensitizers in DSSCs exist.
Very recently, we have observed that the introduction of triphenylethylene phenothiazine into a dye molecule can increase η and Voc values.7 The triphenylethylene structure has been widely used to construct aggregation-induced emission (AIE) molecules.8
In the current study, special consideration was given to the design of the molecular structure to determine its correlation with the performance of DSSCs. A series of organic dyes with end-capped structures slightly different from diphenylethylene to tetraphenylethylene were prepared (Scheme 1). Afterward, the effects of different end-capped structure units on the photophysical, photochemical, and photovoltaic properties of the DSSCs were investigated. To the best of our knowledge, there are no systemic reports on the introduction of AIE twisted structures (triphenylethylene and tetraphenylethylene) into dye molecules for DSSCs. The present results show that AIE twisted structures can effectively improve Voc.
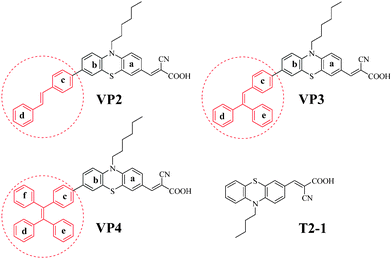 | ||
| Scheme 1 Molecular structures of the target organic dyes and T2-1. | ||
Results and discussion
The synthetic routes for VP2, VP3 and VP4 dyes are shown in Scheme 2. The introduction of a phenothiazine unit into the dyes may potentially improve the performance of solid-state DSSCs, considering its excellent hole-transporting ability. The intermediates, pinacolato boronic ester VP2B, was achieved by the substitution reaction of brominated diphenylethylenes using bis(pinacolato)diboron, catalytic amounts of Pd(dppf)Cl2, and potassium acetate in 1,4-dioxane; boronic acids VP3B and VP4B were prepared from brominated polyphenyl-substituted ethylenes by lithiation with n-butyllithium and boronation with trimethylborate. Brominated phenothiazine aldehyde (APe-Br) was synthesized starting from phenothiazine and 1-bromohexane in three steps (alkylation, formylation and bromination). Suzuki coupling reaction was employed for the synthesis of the key aldehyde intermediates (VP2A, VP3A and VP4A) using the corresponding pinacolato boronic ester or boronic acids mentioned above, namely, brominated phenothiazine aldehyde, Pd(PPh3)4 and K2CO3 in toluene. Knoevenagel condensation of the corresponding aldehyde intermediates with cyanoacetic acid in acetonitrile using piperidine as a catalyst generated the target products in moderate yields. The molecular structures of the products were confirmed using proton and carbon-13 nuclear magnetic resonance spectroscopy, mass spectrometry, and elemental analysis. Detailed synthesis, corresponding references and characterization data are available in the ESI†.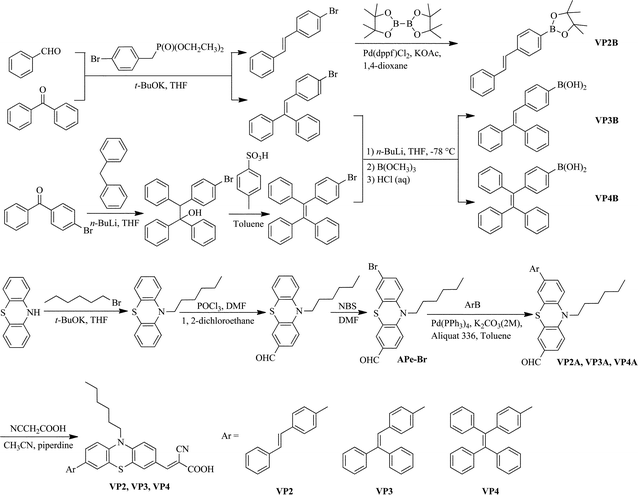 | ||
| Scheme 2 Synthetic routes of VP2, VP3, and VP4. | ||
The UV-visible absorption spectra of VP2, VP3 and VP4 were measured in methylene dichloride (MC) and on TiO2 film. As shown in Fig. 1a, the UV-vis spectrum of VP2 exhibited two absorption bands centered at 326 nm (ε = 5.1 × 10⁴ M−1 cm−1) and 471 nm (ε = 1.6 × 10⁴ M−1 cm−1). The first absorption band was attributed to the absorption of the phenothiazine units, whereas the second one was attributed to π–π* transition of the whole conjugated π-electron system. The UV-vis spectrum of VP3 showed a new absorption band located at 236 nm (ε = 3.2 × 10⁴ M−1 cm−1), which was attributed to the absorption of the phenyl ring e, aside from the two absorption bands at 325 nm (ε = 5.6 × 10⁴ M−1 cm−1) and 474 nm (ε = 2.0 × 10⁴ M−1 cm−1). The UV-vis spectrum of VP4 was similar to that of VP3 in that it showed bands at 320 nm (ε = 5.0 × 10⁴ M−1 cm−1) and 474 nm (ε = 2.0 × 10⁴ M−1 cm−1); however, a relatively small shoulder peak at 273 nm (ε = 3.1 × 10⁴ M−1 cm−1) also existed in the spectrum of VP4, which can be assigned to the absorption of the phenyl ring f. These results indicated that the UV-vis spectra were in full accordance with the structures of the dyes. As seen in Fig. 1b, the absorption spectra of the dyes on the surface of the nanoscopic TiO2 films broadened as compared with those in MC, and the absorption maxima red-shifted, resulting most likely from the formation of J-aggregates (ESI, Fig. S1†).7
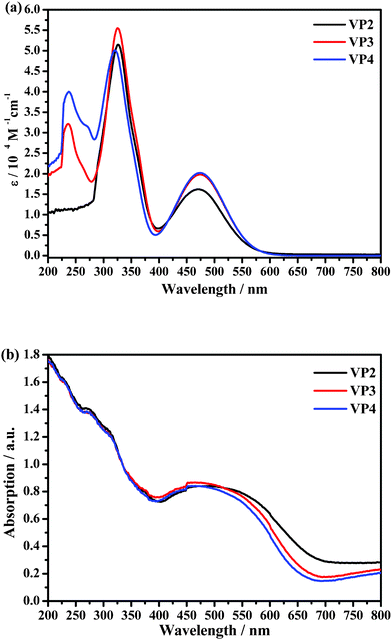 | ||
| Fig. 1 UV-vis absorption spectra of VP2, VP3 and VP4 in MC (a) and on TiO2 film (b). | ||
The onset oxidation potentials (Eonsetox) vs. Ag/AgCl of the dyes were measured in MC (0.5 mM) via cyclic voltammetry (CV) for the calculation of HOMO to evaluate the dye regeneration process from the iodide ionizations to oxydic dye molecules (Fig. S2†). The HOMO levels of VP2, VP3 and VP4 are the same (−5.12 eV). All the obtained values implied efficient regeneration of the oxidized dye, in contrast with −4.60 eV of iodide,9 avoiding geminate charge recombination between the oxidized dye molecules and photo-injected electrons in the nanocrystalline TiO2 film (CR1, Fig. 2). The optical band gaps estimated from the onset of the absorption spectra of VP2, VP3 and VP4 were 1.94, 1.95 and 1.95 eV, respectively. The calculated LUMO levels of VP2, VP3 and VP4 were −3.18, −3.17 and −3.17 eV, respectively. These could provide the thermodynamic drive for charge generation relative to the conduction band edge of the semiconductor electrode (TiO2, −4.00 eV).10 Comparing the energy levels of the dyes, the values obtained were found to be almost the same (Table S2†); thus, the twisted end-capped groups had almost no effects on the electron injection (inj) and dye regeneration (reg), in other words, the end-capped groups probably act as a blocking barrier preventing CR2 (Fig. 2).
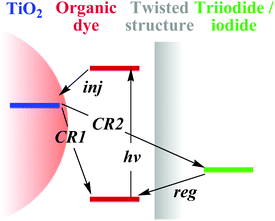 | ||
| Fig. 2 Electron transport in DSSCs: electron injection from organic dye at the excited state into CB of TiO2 (inj); dye regeneration via electron transfer to redox dye from iodide (reg); electron recombination to redox dye (CR1) and recombination to the triiodide (CR2). The shaded rectangle depicts the electron-transfer blocking effects of the end-capped twisted structures of the as-synthesized dyes. | ||
To investigate the molecular structure and electron distribution of the dyes, their geometries were optimized via density functional theory calculations at the B3LYP/6-31G level.11 As shown in Fig. 3, in the ground state (HOMO), electrons were mainly delocalized over the whole conjugation aromatic ring skeletons, whereas in the excited state (LUMO), they completely moved to the acceptor units near the anchoring group, which favored the electron injection from sensitizers to the conduction band of TiO2, leading to the improvement of cell efficiency. The aggregation-caused emission quenching (ACEQ) effect will be discussed in detail later, which may be caused by the change separation which usually quenched emission between the closed dye molecules in the aggregated state. In addition, the change separation should play an important role in improving the performance of DSSCs.
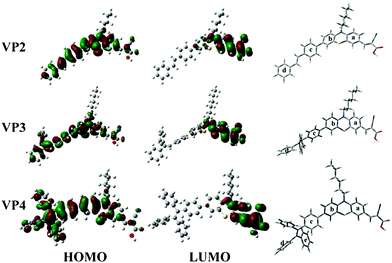 | ||
| Fig. 3 HOMO, LUMO values and bent molecular structures calculated at the B3LYP/6-31G level of VP2, VP3, and VP4. | ||
The photocurrent density-photovoltage (J-V) curves and the incident photon-to-current efficiency (IPCE) plots of the DSSCs based on VP2, VP3 and VP4 are shown in Fig. 4a and 4b, respectively. The performance of these dyes-based DSSCs is summarized in Table 1. The DSSC based on VP3 showed the highest conversion efficiency (η) of 6.29% (η = 5.84% for VP2 and η = 5.76% for VP4). The η value of the DSSC based on metal-free dyes reached up to 71% of that for a standard N719-based device (η = 8.84%, Jsc = 16.91 mAcm−2, Voc = 783 mV, ff = 0.67) prepared under the same conditions. The fill factors (ff) of the DSSCs were very close to one another. The order of the dyes in terms of photocurrent densities (Jsc) of the DSSCs was VP3 (12.62 mA cm−2) > VP2 (11.82 mA cm−2) > VP4 (11.41 mA cm−2), which is to be explained later. In terms of Voc, the order was VP4 (804 mV) > VP3 (789 mV) > VP2 (759 mV). Clearly, the Voc values increased with the increase in the number of substituted phenyl rings in the mutilphenylethylene, implying that the introduction of twisted AIE structure improves Voc. The Voc of VP4 was up to 804 mV, significantly higher than that of N719 (783 mV). To the best of our knowledge, DSSCs based on metal-free organic dyes with Voc values > 800 mV are extremely rare because the maximum Voc of a DSSC corresponds to the difference between the energy level of the conduction band of TiO2 and the redox potential of the electrolyte (I3−/I−), which is generally 800 mV to 900 mV. Although the Voc values of the reported triphenyamine-, indoline-, and perylene-based dyes were beyond 800 mV, their conversion efficiencies were lower than 4.1%. By comparison, the performance efficiencies of the DSSCs based on VP2, VP3 and VP4 were better than those of their parent-compound-sensitized counterpart T2-1 (Jsc = 10.9 mA cm−2, Voc = 712 mV, η = 5.5%),12 suggesting that the introduction of phenylethylene groups can increase the performance of the DSSCs.
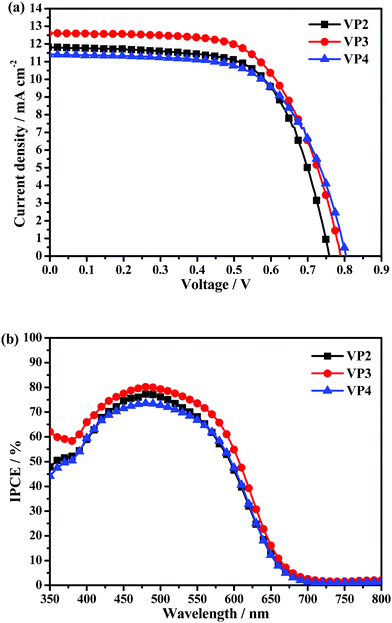 | ||
| Fig. 4 (a) Photocurrent density-photovoltage curves of VP2, VP3, and VP4 under an illumination of 100 mW cm−2 AM 1.5 G sunlight; (b) IPCE spectra of the DSSCs based on the three organic dyes. | ||
| Dye | J sc/mA cm−2 | V oc/mV | Fill factor (ff) | η (%) |
|---|---|---|---|---|
| a Measured under 100 mW cm−2 of simulated AM 1.5 G solar light (100 mW cm−2) at room temperature. | ||||
| VP2 | 11.82 | 759 | 0.65 | 5.84 |
| VP3 | 12.62 | 789 | 0.63 | 6.29 |
| VP4 | 11.41 | 804 | 0.63 | 5.76 |
The IPCE spectra of the DSSCs based on the dyes as a function of wavelength are plotted in Fig. 4b. From Fig. 1b and 4b, the IPCE spectra (VP3 > VP2 > VP4) can be partly ascribed to the UV-vis absorption spectra on the TiO2 film (VP3 > VP2∼VP4). Furthermore, the absorption maxima position and absorption range of the dyes (Fig. 1a) were nearly identical, suggesting that the differences in the performances of DSSCs were probably determined by the end-capped groups. However, the absorption of VP2, VP3 and VP4 on the TiO2 film displayed different levels of red-shift, which are in accordance with the levels of planarization conformation for the non-planar phenothiazine unit when being adsorbed on TiO2 film, given that three-dimensional spatial steric hindrance of the end-capped groups is in the increasing order of diphenylethylene, triphenylethylene to tetraphenylethylene (ESI, Table S1†). The maximum IPCE of the DSSCs based on VP2, VP3 and VP4 dyes at 480 nm were 77.2%, 80.2% and 73.6%, respectively. However, the onset of the IPCE spectra of the three DSSCs was 700 nm, which may be explained by the similar π-conjugated structure and very close energy levels in VP2, VP3 and VP4 molecules after considering the possible progress as follows: influenced by the photo-injected electrons in the TiO2 film, the non-planar butterfly 10-hexyl-10H-phenothiazine unit of VP2, VP3 and VP4 probably changed to the similar planarization conformation.7 As mentioned above, the non-planar phenothiazine in VP2 have already adopted the planarization conformation when being adsorbed on the TiO2 film, hence, the planarization effect, influenced by the photo-injected electrons, could not be further reflected, which lead to the identical onset for the absorption on the TiO2 film and the IPCE. For VP3 and VP4, the IPCE shows red shift to the onset of 700 nm compared to the absorption on the TiO2 film, which can be ascribed to the planarization conformation.
The dark current curves of the DSSCs based on VP2, VP3 and VP4 dyes are shown in Fig. 5. Dark current is generally used to estimate the extent of back electron transfer.13 As seen in Fig. 5, the dark current values for the DSSCs based on the as-synthesized dyes was in the order VP2 > VP3 > VP4, indicating that the increase in Voc was probably achieved by suppressing the recombination of injected electrons. Therefore, the suppression effect of twisted structures on the back electron transfer was clearly indicated by the dark current, as seen in Fig. 5. Moreover, the molecular structures of VP2, VP3 and VP4 implied that the introduction of twisted structures with increasing sizes onto the end of the organic dyes reduces more effectively the recombination of injected electrons at the interface or in the electrolyte. For this reason, the electron lifetime and Voc in the DSSCs increased in the following order: VP2 < VP3 < VP4.
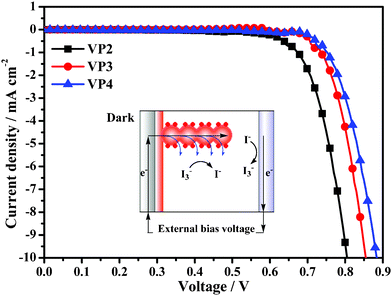 | ||
| Fig. 5 Dark current curves of DSSCs based on VP2, VP3, and VP4. Inset: schematic representation of electron transfer function in DSSCs in the dark. | ||
Open-circuit voltage decay (OCVD)14 was further employed to investigate the electron recombination in the DSSCs based on VP2, VP3 and VP4, since dark current measurements did not present a good simulation of the recombination current under illumination. Generally, the kinetics of the electron transfer processes plays an important role in determining the performance of DSSCs. Therefore, we monitored the transient Voc as a function of time upon switching off the light to investigate the electron recombination kinetics. As clearly shown in Fig. 6, after 5 s of illumination, the Voc of the DSSC based on VP2 exhibited a sharp decay due to electron recombination (which is related to electron lifetime), followed by a steady decrease.15 The Voc of the DSSCs based on VP3 and VP4 showed significantly slower decay rates relative to the DSSC based on VP2, which implied slower recombination kinetics and longer electron lifetime for the former. In other words, there were more electrons surviving the back-reactions in the DSSCs based on VP3 and VP4. Comparisons between the molecular structures of VP2, VP3 and VP4 indicated that the more twisted triphenylethylene and tetraphenylethylene cap structures of the dyes are superior to diphenylethene in terms of slowing down the electron recombination kinetics and lengthening the electron lifetime. In addition, triphenylethylene and tetraphenylethylene can remain twisted in the solid state, which is the most widely accepted explanation for the aggregation-induced fluorescence emission phenomenon.16 We believe that the described structures should be further studied in organic dyes because the results of the present study suggest that twisted structures can efficiently prevent electron recombination.
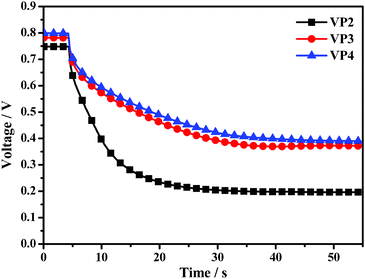 | ||
| Fig. 6 The curves of open-circuit photovoltage decay (OCVD) measurements of DSSCs based on VP2, VP3, and VP4 dyes. | ||
Intensity modulated photovoltage spectroscopy (IMVS) and intensity modulated photocurrent spectroscopy (IMPS) have been widely used to investigate the electron transport and charge recombination in DSSCs. Accordingly, we used IMVS and IMPS to measure the electron lifetime (τr) and transport time (τd) in DSSCs based on VP2, VP3 and VP4 at different light intensities (from 30 W m−2 to 150 W m−2) of illumination from a LED light source (λ = 457 nm). Corresponding charge collection efficiencies (ηcc) were calculated using the equation ηcc = 1 − τd/τr.17 Curves of transport time, lifetime and charge collection efficiency as functions of light intensity derived from IMVS and IMPS measurements are shown in Fig. 7a, 7b and 7c, respectively.
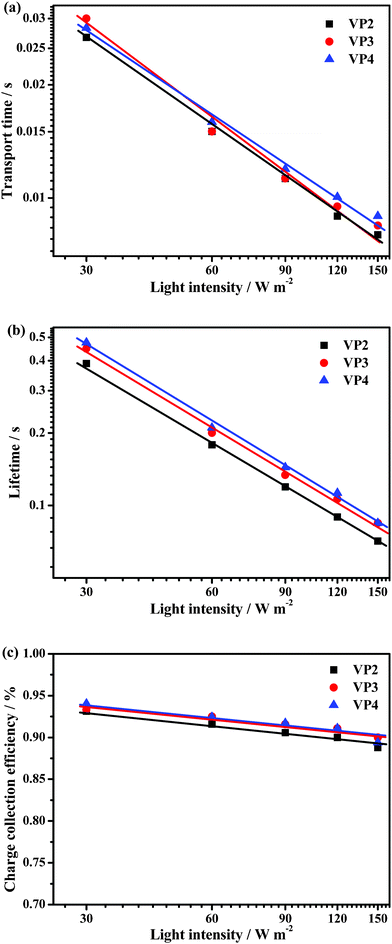 | ||
| Fig. 7 (a) Electron transport time, (b) electron lifetime, and (c) charge collection efficiency measured via IMPS or IMVS at different light intensities for the DSSCs based on VP2, VP3, and VP4 dyes. | ||
As shown in Fig. 7a and 7b, both the electron transport time and lifetime of the three DSSCs based on metal-free dyes decreased with increasing light intensity. The τd measurements obtained via IMPS for the DSSC based on VP2 was a little shorter than that for the DSSCs based on VP4, suggesting that the more rigid end-capped group (tetraphenylethylene for VP4) might show an unfavourable effect on the electron transport with increasing light intensity. These observations revealed that the electron transport rates in the DSSCs based on VP2, VP3 and VP4 may be influenced by the three-dimensional structure of phenothiazine, which is a consequence of the phenothiazine moiety in the VP2 molecule that is less non-planar as compared to those in VP3 and VP4 molecules. In general, the planarization conformation is beneficial for electron transport. The triphenylethylene moiety has a smaller steric hindrance effect on phenothiazine relative to the tetraphenylethylene moiety. Hence, the phenothiazine moiety in the VP3 molecule easily adopts a more planar conformation after being influenced by photo-injected electrons in the TiO2 film, given that the phenothiazine moiety was very close to the TiO2 film. Therefore, the DSSCs based on VP2 and VP3 showed the similar τd with increasing light intensity.
The τr measurements obtained via IMVS reflected the electron recombination processes in DSSCs (Fig. 2). The dye layer on the surface of TiO2 could act as a blocking barrier that prevents CR2.18 The τr for the DSSC based on VP4 was the largest observed, followed by VP3, then VP2. This indicated that the twisted tetraphenylethylene and triphenylethylene cap structures can more effectively block the contact of the redox couple species (triiodide) to the TiO2 surface (CR2). Consequently, the charge recombination decreased and the corresponding photovoltage of the DSSCs was enhanced. Additionally, π–π aggregation between dye molecules can be suppressed by the non-planar, twisted tetraphenylethylene or triphenylethylene moieties. The observation that electron recombination can be retarded by the twisted tetraphenylethylene and triphenylethylene moieties confirmed the enhancement of Voc by twisted structures. Therefore, charge recombination between the injected electron and triiodide in the DSSCs based on VP3 and VP4 was more effectively prohibited, which accounted for longer transient photovoltage decay time and smaller dark current values.
As shown in Fig. 7c, the charge collection efficiency values of the DSSCs increased in the following order: VP2 < VP3∼VP4. VP3 was almost equal to VP4. This finding implied that the introduction of a twisted structure onto the end of the organic dye molecules is beneficial for the enhancement of the charge collection efficiency, considering that charge collection in DSSCs is determined by the competition between charge-transport and recombination kinetics.19Jsc can be estimated using the expression Jsc = qηlhηinjηccI0, where q is the elementary charge, ηlh is the light harvesting efficiency, ηinj is the charge injection efficiency, and I0 is the incident photo flux.20 The charge injection efficiency of the DSSCs based on the three metal-free dyes are probably identical, given that the dipole moment and the HOMO and LUMO levels are almost the same (Table S2†); thus, the Jsc values, namely, VP4 < VP2 < VP3, were mainly attributed to both the UV-vis absorption on the TiO2 film. Moreover, it suggests that the modification of organic dye molecules via the introduction of twisted structures may be an efficient way to enhance charge collection efficiencies. Consequently, improved performance of DSSCs based on VP3 was achieved.
The photoluminescence (PL) spectra of VP2, VP3 and VP4 dyes were investigated in water–DMF mixtures (Fig. 8). The PL intensity of the VP2, VP3 and VP4 emission spectra decreased dramatically with increasing water fraction. Water is a poor solvent and DMF is a good solvent for the dyes, so increasing the water fraction in the mixed solvent can change the existing form of the dyes, from solution in pure DMF to aggregated particles in the mixtures with high water content. These results indicated that the dyes exhibited an ACEQ effect. However, many triphenylethylene and tetraphenylethylene derivatives have been reported to have aggregation-induced emission characteristics.21 This property is ascribed to intramolecular charge transfer (ICT) caused by the change separation. Before the formation of aggregates, D–A type molecules tend to adopt a twisted conformation in polar solvents. Hence, the excited luminogens are in the twisted intramolecular charge transfer state referred to as nonradiative quenching processes. However, solid aldehyde precursors of the VP2A, VP3A and VP4A dyes have strong fluorescent emission properties showing high AIE effects, indicating that the ACEQ effect of the dyes is activated by the introduction of cyanoacrylic acid moieties. ACEQ effect for the dyes of DSSCs should be very important to prohibit the consumption of absorption energy with the way of fluorescent emission, and consequentially improve the performance of DSSCs. The PL wavelength variation trend of VP2 in water-DMF exhibited a top-down “U” pattern. Although they had certain similarities with VP2 in terms of molecular structure, the variation trends of VP3 and VP4 showed continuous red-shifting.
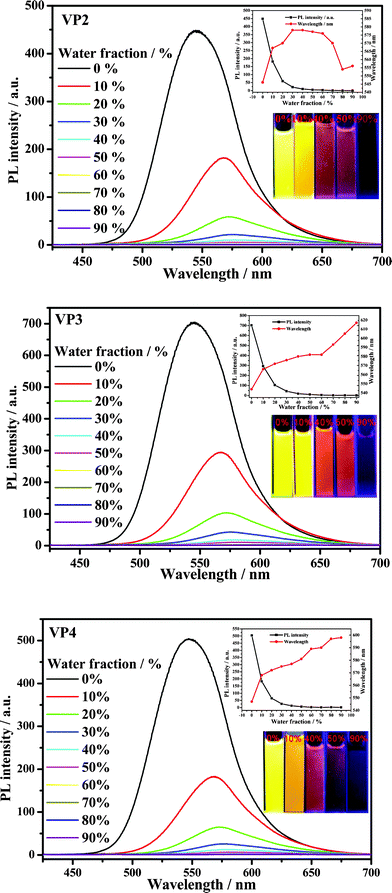 | ||
| Fig. 8 PL spectra of VP2, VP3, and VP4 dyes in water-DMF mixtures (10 μM) with different water fractions. Inset: maximum PL wavelength and intensity of dyes in DMF with different water fractions and emission images taken under 365 nm UV illumination at room temperature. Excitation wavelength, 415 nm. | ||
Experimental section
Materials
Benzaldehyde, benzophenone, diethyl 4-bromobenzyl-phosphonate, 4-bromobenzophenone, diphenylmethane, potassium tert-butyloxide, n-butyllithium in hexane (2.2 M), p-toluenesulfonic acid, bis(pinacolato)diboron, [1,1′-bis(diphenylphosphino)ferrocene]palladium(II) chloride [Pd(dppf)Cl2], 10H-phenothiazine, 1-bromohexane, N-bromosuccinimide (NBS), cynaoacetic acid, Aliquat 336, tetrakis (triphenylphosphine) palladium(0) and tetrabutylammonium perchlorate (electrochemical grade) purchased from Alfa Aesar were used as received. All other reagents and solvents were purchased as analytical grade from Guangzhou Dongzheng Company (China) and used without further purification. Tetrahydrofuran (THF) was distilled from sodium/benzophenone. Ultra-pure water was used in the experiments. The intermediates, APe-Br,7VP2B,22VP3B,23 and VP4B24 were synthesized according to the literature methods.Measurements and characterization
1H NMR and 13C NMR spectra were measured on a Mercury-Plus 300 spectrometer, and chemical shifts were reported in ppm (CDCl3 as solvent and TMS as the internal standard). Mass spectra (MS) were measured on a Thermo DSQ MS and LCQ DECA XP spectrometers. Elemental analyses (EA) were performed with an Elementar Vario EL elemental analyzer. UV-visible absorption spectra (UV) were determined on a Hitachi U-3900 spectrophotometer. Photoluminescence spectra (PL) were measured on a Shimadzu RF-5301PC spectrometer with a slit width of 3 nm for both excitation and emission. The DMF-water mixtures with different water fractions were prepared by slowly adding ultra-pure water into the DMF solution of samples under ultrasound at room temperature. Cyclic voltammetry (CV) measurement was carried out on a Shanghai Chenhua electrochemical workstation CHI660C in a three-electrode cell with a Pt disk counter electrode, a Ag/AgCl reference electrode and a glassy carbon working electrode. All CV measurements were performed under an inert argon atmosphere with supporting electrolyte of 0.1 M tetrabutylammonium perchlorate (n-Bu4NClO4) in dichloromethane at a scan rate of 100 mV s−1 using ferrocene (4.80 eV vs. vacuum) as standard. The highest occupied molecular orbital (HOMO) energy levels were obtained using the onsets oxidation potentials from the CV curves. The lowest unoccupied molecular orbital/highest occupied molecular orbital (LUMO/HOMO) energy gaps ΔEg for the compounds were estimated from the onsets absorption of UV-vis absorption spectra in MC.Preparation and fabrication of DSSCs
Fluorine-dopedtin oxide (FTO) glasses were cleaned in the order of detergent solution, water and ethanol using an ultrasonic bath for 15 min, respectively. Firstly, the TiO2 (20 nm particle size) paste was screen-printed FTO coated glass (15 Ω/square, Nippon Sheet Glass, Japan). The paste fabrication process was carried out according to the previous paper.1 Briefly, TiO2 powder (20 nm) (1.0 g) was ground for 40 min in a mixture of ethanol (8.0 mL), acetic acid (0.2 mL), terpineol (3.0 g) and ethyl cellulose (0.5 g) to form a slurry, and then the slurry was sonicated for 5 min in an ultrasonic bath, finally to form a viscous white TiO2 paste. The thickness of films can be easily controlled through repeating screen-printing. Afterward a heating process (325 °C for 5 min, at 375 °C for 5 min, at 450 °C for 15 min, and then at 500 °C for 15 min) to remove the organic substances was used. The as-prepared TiO2 nanostructured films (TiO2/FTO) were soaked in a 0.04 M aqueous solution of TiCl4 for 30 min at 70 °C, which improved the photocurrent and photovoltaic performance. The TiCl4-treated as-prepared films were rinsed with deionized water and ethanol, and then sintered at 520 °C for 30 min. After cooling to 80 °C, the films were immersed in a 5.0 × 10⁻⁴ M solution of the VP2, VP3, VP4 in MC and N719 (Solaronix SA, Switzerland) in acetonitrile/tert-butanol (1/1), and sensitized for about 16 h. Afterwards, the films were rinsed with MC or acetonitrile (N719) to remove physisorbed dye molecules. To evaluate their photovoltaic performance, the dye-sensitized TiO2 nanostructured FTO films were sandwiched together with Pt-coated FTO glass, which was used as a counter electrode. Platinized counter electrodes were fabricated by thermally depositing H2PtCl6 solution (5 mM in isopropanol) onto FTO glass. The electrolyte (0.6 M 1-methyl-3-propylimidazolium iodide (PMII), 0.10 M guanidinium thiocyanate, 0.03 M I2, 0.5 M tert-butylpyridine in acetonitrile, and valeronitrile (85![[thin space (1/6-em)]](https://www.rsc.org/images/entities/char_2009.gif) :
:![[thin space (1/6-em)]](https://www.rsc.org/images/entities/char_2009.gif) 15)) was injected into the space (25 μm) between the sandwiched cells. The active area of the dye-coated TiO2 film was 0.16 cm2.
15)) was injected into the space (25 μm) between the sandwiched cells. The active area of the dye-coated TiO2 film was 0.16 cm2.
Photovoltaic performance measurements
To measure the amount of adsorbed dye on the TiO2 film, the dye/TiO2 film was immersed in a 0.1 M aqueous solution of NaOH (3.0 mL) and UV-vis absorption spectra of the desorbed dye solution were measured by using a Hitachi U-3900 spectrophotometer. The current–voltage characteristics of the DSSCs were recorded using a Keithley 2400 source meter under one sun AM 1.5 G (100 mW cm−2) illumination with a solar light simulator (Oriel, Model: 91192). A 1000 W xenon arc lamp (Oriel, Model: 6271) was served as a light source and its incident light intensity was calibrated with a NREL-calibrated Si solar cell equipped with a optical filter to approximate AM 1.5 G one sun light intensity before each measurement. The incident photon-to-current efficiency (IPCE) spectra were measured as a function of wavelength from 350 to 800 nm on the basis of a Spectral Products DK240 monochromator. Intensity-modulated photovoltage spectroscopy (IMVS) and intensity-modulated photocurrent spectroscopy (IMPS) measurements were carried out on an electrochemical workstation (Zahner, Zennium) with a frequency response analyzer under a modulated green light emitting diode (457 nm) driven by a source supply (Zahner, PP211), which can provide both DC and AC components of the illumination. The modulated light intensity was 10% or less than the base light intensity. The frequency range was set from 100 kHz to 0.1 Hz.Synthesis of 10-hexyl-7-(4-styrylphenyl)-10H-phenothiazine-3-carbaldehyde (VP2A)
To a solution of APe-Br (0.64 g, 1.6 mmol) and VP2B (0.61 g, 2.0 mmol) in toluene (20 mL), 2 M aqueous K2CO3 solution (3 mL) and Aliquat 336 (5 drops) were added. The mixture was stirred for 15 min under an argon atmosphere at room temperature. Then the Pd (PPh3)4 (0.05 g) catalyst was added and the reaction mixture was stirred at 80 °C overnight. After cooling to room temperature, the product was concentrated and purified with silica gel column chromatography using dichloromethane/n-hexane (1/2, v/v) as eluant. An orange-yellow power of VP2A (0.51 g, 65% yield) was obtained. 1H NMR (300 MHz, CDCl3) δ (ppm): 9.79 (s, 1H), 7.52–7.66 (m, 8H), 7.34–7.43 (m, 4H), 7.28 (d, 1H), 7.14 (s, 2H), 6.92 (q, 2H), 3.92 (t, 2H), 1.86 (m, 2H), 1.32–1.50 (m, 6H), 0.90 (t, 3H); 13C NMR (75 MHz, CDCl3) δ (ppm): 190.05, 150.50, 142.74, 138.74, 137.44, 136.57, 131.28, 131.06, 130.69, 130.36, 129.96, 129.61, 128.91, 128.56, 128.24, 127.89, 127.38, 127.19, 126.87, 126.73, 126.13, 125.76, 116.30, 114.97, 48.38, 31.77, 26.91, 22.98, 14.40; MS (EI), m/z: 489 ([M]+, calcd for C33H31NOS, 489).Synthesis of 7-(4-(2,2-diphenylvinyl)phenyl)-10-hexyl-10H-phenothiazine-3-carbaldehyde (VP3A)
The synthesis method is the same as that used for compound VP2A. Orange-yellow power of VP3A (0.40 g, 63% yield) was obtained. 1H NMR (300 MHz, CDCl3) δ (ppm): 9.78 (s, 1H), 7.72 (m, 1H), 7.63 (q, 1H), 7.58 (d, 1H), 7.52 (m, 1H), 7.29–7.36 (m, 12H),7.06 (d, 2H), 6.98 (s, 1H), 6.88 (q, 2H), 3.89 (t, 2H), 1.84 (m, 2H), 1.32–1.49 (m, 6H), 0.90 (t, 3H); 13C NMR (75 MHz, CDCl3) δ (ppm): 190.01, 150.52, 143.48, 142.91, 142.63, 140.56, 137.74, 136.62, 136.20, 131.23, 131.08, 130.53, 130.30, 130.23, 128.94, 128.57, 128.41, 127.75, 126.05, 125.78, 124.75, 124.28, 116.26, 116.18, 114.95, 114.87, 48.42, 31.74, 27.08, 26.88, 22.95, 19.58, 14.36; MS (EI), m/z: 565 ([M]+, calcd for C39H35NOS, 565).Synthesis of 10-hexyl-7-(4-(1,2,2-triphenylvinyl)phenyl)-10H-phenothiazine-3-carbaldehyde (VP4A)
The synthesis method is the same as that used for compound VP2A. Orange-yellow power of VP4A (0.32 g, 39% yield) was obtained. 1H NMR (300 MHz, CDCl3) δ (ppm): 9.78 (s, 1H), 7.63 (q, 1H), 7.57 (d, 1H), 7.33 (q, 1H), 7.28 (d, 2H), 7.00–7.14 (m, 18H), 6.88 (q, 2H), 3.90 (t, 2H), 1.83 (m, 2H), 1.31–1.46 (m, 6H), 0.90 (t, 3H); 13C NMR (75 MHz, CDCl3) δ (ppm): 190.02, 150.59, 143.85, 142.94, 142.52, 141.35, 140.58, 137.36, 136.32, 132.01, 131.50, 131.20, 130.30, 128.58, 127.88, 126.68, 126.04, 125.83, 125.72, 124.76, 124.24, 116.20, 114.89, 110.00, 48.42, 31.75, 27.07, 26.88, 22.96, 14.37; MS (EI), m/z: 641 ([M]+, calcd for C45H39NOS, 641).Synthesis of 2-cyano-3-(10-hexyl-7-(4-styrylphenyl)-10H-phenothiazin-3-yl)acrylic acid (VP2)
In a three-necked flask under an argon atmosphere, VP2A (0.25 g, 0.51 mmol) was dissolved in acetonitrile (35 mL). Piperidine (0.2 mL) was added dropwise to the reaction mixture. The stirring was continued for 10 min, then cyanoacetic acid (0.13 g, 1.5 mmol) was added and the mixture was heated to 90 °C for 3 h. After evaporation of the solvent under reduced pressure, the residue was purified by column chromatography using silica gel and dichloromethane/methanol (15/1, v/v) as the eluent to give VP2 (0.15 g, 54% yield) as a purple-red power. 1H NMR (300 MHz, DMSO) δ (ppm): 8.11 (s, 1H), 7.88 (d, 1H), 7.80 (s, 1H), 7.49–7.64 (m, 8H), 7.36 (t, 2H), 7.24 (t, 3H), 7.12 (t, 2H), 3.95 (t, 2H), 1.70 (m, 2H), 1.24–1.42 (m, 6H), 0.83 (t, 3H); 13C NMR (75 MHz, DMSO) δ (ppm): 164.35, 152.69, 148.97, 142.57, 138.14, 137.67, 136.72, 135.50, 132.20, 130.52, 129.91, 129.63, 129.37, 129.09, 128.52, 128.33, 127.73, 127.15, 126.92, 126.55, 126.38, 125.50, 123.41, 117.67, 116.40, 116.30, 47.78, 31.62, 26.88, 26.53, 22.91, 14.69; MS (ESI), m/z: 555.9 ([M]+, calcd for C36H32N2O2S, 556.2); Anal. calcd for C36H32N2O2S: C 77.67, H 5.79, N 5.03, O 5.75, S 5.76; found: C 77.61, H 5.72, N 5.00, S 5.73.Synthesis of 2-cyano-3-(7-(4-(2,2-diphenylvinyl)phenyl)-10-hexyl-10H-phenothiazin-3-yl)acrylic acid (VP3)
The synthesis method resembles compound VP2. Black-red power of VP3 (0.10 g, 45% yield) was obtained. 1H NMR (300 MHz, CDCl3) δ (ppm): 8.08 (s, 1H), 7.91 (d, 1H), 7.66 (s, 1H), 7.29–7.38 (m, 11H), 7.26 (s, 1H), 7.23 (t, 2H), 7.06 (d, 2H), 6.98 (s, 1H), 6.87 (q, 2H), 3.90 (t, 2H), 1.84 (m, 2H), 1.33–1.50 (m, 6H), 0.91 (t, 3H); 13C NMR (75 MHz, DMSO) δ (ppm): 165.22, 147.91, 147.28, 143.14, 143.05, 142.30, 140.62, 137.41, 136.40, 134.79. 130.67, 130.46, 130.33, 129.70, 129.19, 129.01, 128.35, 127.87, 127.64, 126.37, 126.19, 126.06, 125.34, 123.55, 119.77, 118.95, 117.02, 109.42, 47.56, 31.60, 27.74, 26.86, 26.53, 22.88, 14.67; MS (ESI), m/z: 631.9 ([M]+, calcd for C42H36N2O2S, 632.2); Anal. calcd for C42H36N2O2S: C 79.72, H 5.73, N 4.43, O 5.06, S 5.07; found: C 79.78, H 5.69, N 4.38, S 5.02.Synthesis of 2-cyano-3-(10-hexyl-7-(4-(1,2,2-triphenyl-vinyl)phenyl)-10H-phenothiazin-3-yl)acrylic acid (VP4)
The synthesis method resembles compound VP2. Black-ed power of VP4 (0.12 g, 54% yield) was obtained. 1H NMR (300 MHz, CDCl3) δ (ppm): 8.08 (s, 1H), 7.91 (d, 1H), 7.66 (s, 1H), 7.30 (t, 3H), 7.01–7.14 (m, 18H), 6.86 (q, 2H), 3.90 (t, 2H), 1.84 (m, 2H), 1.34–1.47 (m, 6H), 0.90 (t, 3H); 13C NMR (75MHz, CDCl3) δ (ppm): 167.97, 154.80, 150.11, 143.84, 143.08, 141.79, 141.42, 140.57, 137.19, 136.68, 132.03, 131.50, 130.70, 127.95, 127.89, 126.70, 126.12, 125.73, 124.51, 123.71, 116.21, 116.00, 115.09, 97.57, 48.53, 31.73, 27.06, 26.86, 22.95, 14.35; MS (EI), m/z: 708 ([M]+, calcd for C48H40N2O2S, 708); Anal. calcd for C48H40N2O2S: C 81.32, H 5.69, N 3.95, O 4.51, S 4.52; found: C 81.28, H 5.61, N 3.90, S 4.47.Conclusion
A new series of organic dyes with various end-capped groups, e.g., diphenylethylene, triphenylethylene and tetraphenylethylene, have been synthesized and the nature of the end-capped groups have shown significant effects on the performance of the DSSCs. The DSSC based on triphenylethylene end-capped dye (VP3) exhibited the highest η of 6.29%, whereas the DSSC based on tetraphenylethylene end-capped dye had the highest Voc of 804 mV, as measured under standard AM 1.5 G solar conditions. The Voc of DSSCs can be greatly improved via the incorporation of a twisted non-planar AIE moiety in the dye structure, which is confirmed by the measurements of dark current, open-circuit voltage decay and intensity modulated photovoltage spectroscopy. Although the dyes contain AIE moieties, they exhibit an ACEQ effect, i.e., the dyes would not waste near ultraviolet light to emit light away. As a consequence, many other AIE derivatives can be introduced to study their effects on the performance of DSSCs, which is now in progress in our labs.Acknowledgements
The authors gratefully acknowledge the financial support from the National Natural Science Foundation of China (51173210, 51073177, 20873183), Construction Project for University-Industry cooperation platform for Flat Panel Display from the Commission of Economy and Informatization of Guangdong Province, the Fundamental Research Funds for the Central Universities, the Program for New Century Excellent Talents in University (NCET-11-0533), and Natural Science Foundation of Guangdong (S2011020001190).References
- B. O'Regan and M. Grätzel, Nature, 1991, 353, 737 CrossRef CAS.
- Y. S. Yen, H. H. Chou, Y. C. Chen, C. Y. Hsu and J. T. Lin, J. Mater. Chem., 2012, 22, 8734 RSC.
- (a) A. Mishra, M. K. R. Fischer and P. Bäuerle, Angew. Chem., Int. Ed., 2009, 48, 2474 CrossRef CAS; (b) S. Franco, J. Garín, N. M. de Baroja, R. Pérez-Tejada, J. Orduna, Y. Yu and M. Lira-Cantú, Org. Lett., 2012, 14, 752 CrossRef CAS.
- G. L. Zhang, H. Bala, Y. M. Cheng, D. Shi, X. J. Lv, Q. J. Yu and P. Wang, Chem. Commun., 2009, 2198 RSC.
- S. Ito, H. Miura, S. Uchida, M. Takata, K. Sumioka, P. Liska, P. Comte, P. Péchy and M. Grätzel, Chem. Commun., 2008, 5194 RSC.
- (a) X. P. Qiu, R. Lu, H. P. Zhou, X. F. Zhang, T. H. Xu, X. L. Liu and Y. Y. Zhao, Tetrahedron Lett., 2008, 49, 7446 CrossRef CAS; (b) S. A. Haque, S. Handa, K. Peter, E. Palomares, M. Thelakkat and J. R. Durrant, Angew. Chem., Int. Ed., 2005, 44, 5740 CrossRef CAS.
- C. J. Chen, J. Y. Liao, Z. G. Chi, B. J. Xu, X. Q. Zhang, D. B. Kuang, Y. Zhang, S. W. Liu and J. R. Xu, J. Mater. Chem., 2012, 22, 8994 RSC.
- (a) H. Y. Li, X. Q. Zhang, Z. G. Chi, B. J. Xu, W. Zhou, S. W. Liu, Y. Zhang and J. R. Xu, Org. Lett., 2011, 13, 556 CrossRef CAS; (b) X. Q. Zhang, Z. G. Chi, H. Y. Li, B. J. Xu, X. F. Li, S. W. Liu, Y. Zhang and J. R. Xu, J. Mater. Chem., 2011, 21, 1788 RSC; (c) X. Q. Zhang, Z. G. Chi, B. J. Xu, H. Y. Li, Z. Y. Yang, X. F. Li, S. W. Liu, Y. Zhang and J. R. Xu, Dyes Pigm., 2011, 89, 56 CrossRef CAS; (d) X. F. Li, Z. G. Chi, B. J. Xu, H. Y. Li, X. Q. Zhang, W. Zhou, Y. Zhang, S. W. Liu and J. R. Xu, J. Fluoresc., 2011, 21, 1969 CrossRef CAS; (e) B. J. Xu, Z. G. Chi, X. F. Li, H. Y. Li, W. Zhou, X. Q. Zhang, C. C. Wang, Y. Zhang, S. W. Liu and J. R. Xu, J. Fluoresc., 2011, 21, 433 CrossRef CAS; (f) X. Q. Zhang, Z. G. Chi, B. J. Xu, H. Y. Li, W. Zhou, X. F. Li, Y. Zhang, S. W. Liu and J. R. Xu, J. Fluoresc., 2011, 21, 133 CrossRef CAS; (g) Z. Y. Yang, Z. G. Chi, B. J. Xu, H. Y. Li, X. Q. Zhang, X. F. Li, S. W. Liu, Y. Zhang and J. R. Xu, J. Mater. Chem., 2010, 20, 7352 RSC; (h) X. Q. Zhang, Z. Y. Yang, Z. G. Chi, M. N. Chen, B. J. Xu, C. C. Wang, S. W. Liu, Y. Zhang and J. R. Xu, J. Mater. Chem., 2010, 20, 292 RSC; (i) B. J. Xu, Z. G. Chi, Z. Y. Yang, J. B. Chen, S. Z. Deng, H. Y. Li, X. F. Li, Y. Zhang, N. S. Xu and J. R. Xu, J. Mater. Chem., 2010, 20, 4135 RSC; (j) H. Y. Li, Z. G. Chi, B. J. Xu, X. Q. Zhang, Z. Y. Yang, X. F. Li, S. W. Liu, Y. Zhang and J. R. Xu, J. Mater. Chem., 2010, 20, 6103 RSC; (k) Z. Y. Yang, Z. G. Chi, T. Yu, X. Q. Zhang, M. N. Chen, B. J. Xu, S. W. Liu, Y. Zhang and J. R. Xu, J. Mater. Chem., 2009, 19, 5541 RSC; (l) Z. Y. Yang, T. Yu, M. N. Chen, X. Q. Zhang, C. C. Wang, B. J. Xu, X. Zhou, S. W. Liu, Y. Zhang, Z. G. Chi and J. R. Xu, Acta Polym. Sin., 2009, 009, 560 CrossRef.
- G. L. Zhang, Y. Bai, R. Z. Li, D. Shi, S. Wenger, S. M. Zakeeruddin, M. Grätzel and P. Wang, Energy Environ. Sci., 2009, 2, 92 CAS.
- M. Grätzel, Nature, 2001, 414, 338 CrossRef.
- M. J. Frisch, G. W. Trucks, H. B. Schlegel, G. E. Scuseria, M. A. Robb, J. R. Cheeseman, J. A. Montgomery, Jr., T. Vreven, K. N. Kudin, J. C. Burant, J. M. Millam, S. S. Iyengar, J. Tomasi, V. Barone, B. Mennucci, M. Cossi, G. Scalmani, N. Rega, G. A. Petersson, H. Nakatsuji, M. Hada, M. Ehara, K. Toyota, R. Fukuda, J. Hasegawa, M. Ishida, T. Nakajima, Y. Honda, O. Kitao, H. Nakai, M. Klene, X. Li, J. E. Knox, H. P. Hratchian, J. B. Cross, V. Bakken, C. Adamo, J. Jaramillo, R. Gomperts, R. E. Stratmann, O. Yazyev, A. J. Austin, R. Cammi, C. Pomelli, J. Ochterski, P. Y. Ayala, K. Morokuma, G. A. Voth, P. Salvador, J. J. Dannenberg, V. G. Zakrzewski, S. Dapprich, A. D. Daniels, M. C. Strain, O. Farkas, D. K. Malick, A. D. Rabuck, K. Raghavachari, J. B. Foresman, J. V. Ortiz, Q. Cui, A. G. Baboul, S. Clifford, J. Cioslowski, B. B. Stefanov, G. Liu, A. Liashenko, P. Piskorz, I. Komaromi, R. L. Martin, D. J. Fox, T. Keith, M. A. Al-Laham, C. Y. Peng, A. Nanayakkara, M. Challacombe, P. M. W. Gill, B. G. Johnson, W. Chen, M. W. Wong, C. Gonzalez and J. A. Pople, GAUSSIAN 03 (Revision D.01), Gaussian, Inc., Wallingford, CT, 2004 Search PubMed.
- H. N. Tian, X. C. Yang, R. K. Chen, Y. Z. Pan, L. Li, A. Hagfeldt and L. C. Sun, Chem. Commun., 2007, 3741 RSC.
- Z. P. Zhang, S. M. Zakeeruddin, B. C. O'Regan, R. Humphry-Baker and M. Grätzel, J. Phys. Chem. B, 2005, 109, 21818 CrossRef CAS.
- (a) H. X. Wang, M. N. Liu, M. Zhang, P. Wang, H. Miura, Y. Cheng and J. Bell, Phys. Chem. Chem. Phys., 2011, 13, 17359 RSC; (b) A. Zaban, M. Greenshtein and J. Bisquert, ChemPhysChem, 2003, 4, 859 CrossRef CAS.
- B. X. Lei, J. Y. Liao, R. Zhang, J. Wang, C. Y. Su and D. B. Kuang, J. Phys. Chem. C, 2010, 114, 15228 CAS.
- Y. N. Hong, J. W. Y. Lam and B. Z. Tang, Chem. Commun., 2009, 4332 RSC.
- A. Hagfeldt, G. Boschloo, L. C. Sun, L. Kloo and H. Pettersson, Chem. Rev., 2010, 110, 6595 CrossRef CAS.
- S. Ito, P. Liska, P. Comte, R. Charvet, P. Péchy, U. Bach, L. Schmidtmende, S. M. Zakeeruddin, A. Kay, M. K. Nazeeruddin and M. Gräzel, Chem. Commun., 2005, 4351 RSC.
- K. Zhu, S. R. Jang and A. J. Frank, J. Phys. Chem. Lett., 2011, 2, 1070 CrossRef CAS.
- J. Y. Liao, B. X. Lei, D. B. Kuang and C. Y. Su, Energy Environ. Sci., 2011, 4, 4079 CAS.
- (a) H. Y. Li, Z. G. Chi, B. J. Xu, X. Q. Zhang, X. F. Li, S. W. Liu, Y. Zhang and J. R. Xu, J. Mater. Chem., 2011, 21, 3760 RSC; (b) B. J. Xu, Z. G. Chi, H. Y. Li, X. Q. Zhang, X. F. Li, S. W. Liu, Y. Zhang and J. R. Xu, J. Phys. Chem. C, 2011, 115, 17574 CrossRef CAS; (c) Y. N. Hong, J. W. Y. Lam and B. Z. Tang, Chem. Soc. Rev., 2011, 40, 5361 RSC; (d) X. Q. Zhang, Z. G. Chi, H. Y. Li, B. J. Xu, X. F. Li, W. Zhou, S. W. Liu, Y. Zhang and J. R. Xu, Chem.–Asian J., 2011, 6, 808 CrossRef CAS; (e) B. J. Xu, Z. G. Chi, X. Q. Zhang, H. Y. Li, C. J. Chen, S. W. Liu, Y. Zhang and J. R. Xu, Chem. Commun., 2011, 47, 11080 RSC; (f) H. Y. Li, Z. G. Chi, X. Q. Zhang, B. J. Xu, S. W. Liu, Y. Zhang and J. R. Xu, Chem. Commun., 2011, 47, 11273 RSC.
- A. Oehlke, A. A. Auer, I. Jahre, B. Walfort, T. Rüffer, P. Zoufalá, H. Lang and S. Spange, J. Org. Chem., 2007, 72, 4328 CrossRef CAS.
- J. C. Ostrowski, R. A. Hudack, Jr., M. R. Robinson, S. J. Wang and G. C. Bazan, Chem.–Eur. J., 2001, 7, 4500 CrossRef CAS.
- B. J. Xu, Z. G. Chi, J. Y. Zhang, X. Q. Zhang, H. Y. Li, X. F. Li, S. W. Liu, Y. Zhang and J. R. Xu, Chem.–Asian J., 2011, 6, 1470 CrossRef CAS.
Footnotes |
| † Electronic supplementary information (ESI) available: Figs. S1-S20 and Tables S1-S2 (PDF). See DOI: 10.1039/c2ra20819a |
| ‡ These authors contributed equally to the preparation of this work. |
| This journal is © The Royal Society of Chemistry 2012 |
