Novel catalyst layer synthesized by an in situ sol–gel process with tetraethoxysilane in a Nafion ionomer solution with Pt/C for PEFCs: the effect of self-assembled Nafion–SiO2 on Pt ORR activity and an increased water content in the polymer membranes†
Taeyoung
Kim‡
*a,
Junghun
Lee
a,
Tae-Hyun
Yang
a,
Young-Gi
Yoon
a,
Seok-Hee
Park
a and
Sung-Dae
Yim ‡
*b
aFuel Cell Research Center, New and Renewable Energy Research Division, Korea Institute of Energy Research (KIER), 102 Gajeong-ro, Yuseong-gu, Daejeon, 305-343, Republic of Korea.. E-mail: abc@kier.re.kr; Tel: +82-42-860-3007; Fax: +82-42-860-3104
bFuel Cell Research Center, New and Renewable Energy Research Division, Korea Institute of Energy Research (KIER), 102 Gajeong-ro, Yuseong-gu, Daejeon, 305-343, Republic of Korea.. E-mail: jimmyim@kier.re.kr; Tel: +82-42-860-3548; Fax: +82-42-860-3104
First published on 5th July 2012
Abstract
A highly optimized catalyst layer, under low humidity conditions, was developed through an in situ sol–gel process with tetraethoxysilane (TEOS) in a Nafion ionomer solution with Pt/C in order to prepare a polymer electrolyte fuel cell (PEFC). This method is quick and does not require the use of additional solvents to accomplish the sol–gel reaction of TEOS at high temperatures compared to other ex situ sol–gel methods. Amorphous SiO2 nanoparticles of <5 nm were distributed uniformly in the vicinity of the graphitic carbons and the Pt electrocatalysts without significant particle aggregation. In the in situ sol–gel reaction, due to their very high acidity, –SO3H groups attached to the Nafion polymer conveniently served as catalyst to facilitate the hydrolysis reaction. Hydrolyzed alkoxysilanes migrated to the negatively charged sulfonate groups (–SO3−) due to a rapid increase in the ζ potential of the SiO2 nanoparticles at pH < 2, which resulted in a core–shell structure in the catalyst ink during the drying of the membrane–electrode assemblies (MEAs). A core–shell structure that consisted of positively charged ![[triple bond, length as m-dash]](https://www.rsc.org/images/entities/char_e002.gif) SiOH2+ groups and negatively charged –SO3− in the Nafion ionomer was evaluated for its enhancement of the water content in the polymer membranes, as well as its effect on the specific activity of Pt. When an MEA has SiO2 nanoparticles only within the cathode catalyst layer under low humidity, the chemically-adsorbed water molecules on the silanol groups are released into the cathode catalyst layer, increasing the water content at the cathode catalyst layer, which increases the water transport from the cathode to the anode (i.e., back diffusion). The enhanced back diffusion mitigated the dehydration of the membrane under low humidity conditions. Furthermore, it is interesting to note that the core–shell structure between positively-charged SiOH2+ groups and negatively-charged –SO3− groups in the Nafion ionomer may reduce the specific adsorption of –SO3− groups on the surface of Pt, which enhances the kinetics of the oxygen reduction reaction (ORR) in the catalyst layer of the cathode.
SiOH2+ groups and negatively charged –SO3− in the Nafion ionomer was evaluated for its enhancement of the water content in the polymer membranes, as well as its effect on the specific activity of Pt. When an MEA has SiO2 nanoparticles only within the cathode catalyst layer under low humidity, the chemically-adsorbed water molecules on the silanol groups are released into the cathode catalyst layer, increasing the water content at the cathode catalyst layer, which increases the water transport from the cathode to the anode (i.e., back diffusion). The enhanced back diffusion mitigated the dehydration of the membrane under low humidity conditions. Furthermore, it is interesting to note that the core–shell structure between positively-charged SiOH2+ groups and negatively-charged –SO3− groups in the Nafion ionomer may reduce the specific adsorption of –SO3− groups on the surface of Pt, which enhances the kinetics of the oxygen reduction reaction (ORR) in the catalyst layer of the cathode.
Introduction
High temperature operations with low humidification levels for polymer electrolyte fuel cells (PEFCs) have recently captured a great deal of attention because of their potential for solving the problem of CO poisoning and could enhance electrochemical reactions, simplify the design of water and thermal subsystems and reduce the cost of PEFCs.1 Despite the fact that Nafion-based membranes are the best performing, commercially available polymer electrolytes, the development of non-perfluorinated polymer membranes and ionomer binders is in urgent need for alternative proton conductive materials due to the instability of Nafion-based polymers at elevated temperatures. However, extensive studies have reported that a hydrocarbon-based ionomer binder is not appropriate for use in catalyst layers because of the strong adsorption of the aromatic rings and sulfonate acid groups (–SO3H) of the hydrocarbon-based ionomer on the Pt catalyst, which leads to significant inhibition of the oxygen reduction reaction (ORR).2,3b Furthermore, the low diffusion coefficient of water and the high swelling property and low gas permeability of the hydrocarbon-based ionomer binder in the catalyst layer have detrimental effects on the efficient oxygen mass transport under high relative humidity (RH) conditions.3 Although hydrocarbon polymers that contain polar groups have high water uptakes over a wide temperature range, the absorbed water is restricted to the polar groups of the polymer chains. Thus, the humidity has a greater effect on the water retention and proton conductivity of the hydrocarbon ionomer than it has on these same properties for the Nafion ionomer. This restricts the application of hydrocarbon ionomers to PEFC operation under low humidity conditions. Hence, we believe that a highly optimized, Nafion-based electrode system can be employed successfully with alternative hydrocarbon-based membranes in order to produce high performance, membrane–electrode assemblies (MEAs).However, the proton conductivity of Nafion ionomers is commonly altered dramatically under low humidity conditions. One promising strategy to increase the water content in the polymer matrix is to incorporate nanometer-sized particles of hygroscopic metal oxides in the cathode and/or anode catalyst layers.4 The incorporation of hygroscopic metal oxides is usually conducted by dispersing the nanoparticles synthesized by an ex situ sol–gel process. However, a notable issue is that hygroscopic oxide particles synthesized by ex situ sol–gel reactions can be easily lost or can significantly aggregate in the MEA when the oxide particles are just simply mixed and not immobilized in these electrodes, which results in a decreased performance of the cell during its long-term operation. Furthermore, the addition of excessive oxide particles may have a detrimental effect on the interfacial contact between the catalyst layer and the polymer membrane. In addition, it may deteriorate the charge transfer dynamics (i.e., proton and electron transfer) of the electrodes due to the insulating properties of the oxide particles.4d Furthermore, many research groups have found that the enhanced performance of MEAs that contain hygroscopic metal oxides is attributable to the increase of the proton conductivity in the electrode and/or the polymer membrane due to an increase in water transport from the cathode to the anode under low humidity conditions. However, these researchers did not support their assertions by providing specific examples, such as the net water transport in polymer membranes and the proton resistance in the electrode.
In the present work, we described the significant enhancement of the water content of polymer ionomers under dehydrated condition by preparing a novel composite catalyst layer that contains a Nafion ionomer self-assembled with SiOH2+, which was derived from an in situ sol–gel process with tetraethoxysilane (TEOS) at pH < 2. Further, we verified that the experimental methods for measuring the water transport in the polymer membrane are applicable to all types of MEA. Most importantly, the method suggested in the present study is quick and does not require additional solvent to accomplish the sol–gel reaction of TEOS at high temperatures, as compared to ex situ methods that have been reported previously. To the best of our knowledge, there has been no studies that attempt to improve the performance of cells at low humidity with an MEA that utilizes in situ sol–gel processes with TEOS in a Nafion solution with Pt/C. These approaches originate from in situ sol–gel procedures, which consist of two steps: 1) conducting the hydrolysis of TEOS in a solvent mixture that consists of a Nafion ionomer solution, alcohol and water and 2) polycondensation, which occurs during the drying of the MEA. More specifically, the –SO3H protons, which are attached to the Nafion polymer, conveniently serve as catalysts for the hydrolysis reaction thanks to the very high acidity of the perfluorinated side chain. Hydrolyzed alkoxysilanes migrate to the negatively charged sulfonate groups (–SO3−) due to a rapid increase in the zeta (ζ) potential at pH < 2 and they form a core–shell structure. In the catalyst ink, the strong stabilization and steric hindrance effect of self-assembled Nafion–SiO2 prevents the grain growth of the SiO2 nanoparticles, which leads to an even distribution of <5 nm SiO2 nanoparticles in the electrode. After the catalyst ink was sprayed, it was dried at 80 °C to remove the residual solvent and further promote the condensation reaction in which H2O and C2H5OH are lost, as shown in Fig. 1. Using this method, it was shown that the novel composite catalyst layer enhanced the performance of the cell significantly, from 476 mA cm−2 to 655 mA cm−2 at 0.6 V and 50% RH, due to the lower proton resistance in the polymer membrane.
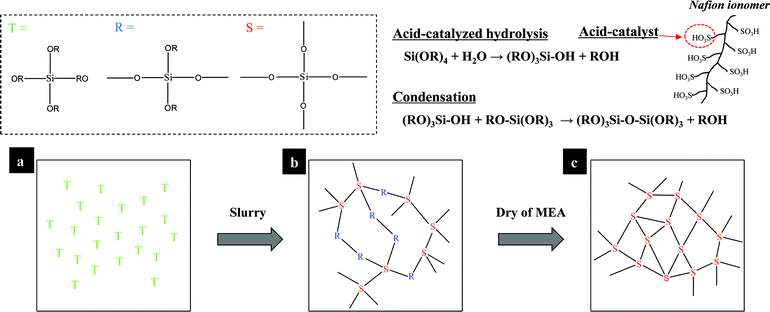 | ||
| Fig. 1 Schematic diagrams for the in situ sol–gel reactions of tetraethoxysilane (TEOS) in a Nafion ionomer solution. The polymer-attached –SO3H groups conveniently serve as catalyst for the hydrolysis reaction. (a) the TEOS solution; (b) continuous hydrolysis–condensation reactions take place in the catalyst ink; (c) finally, the MEA is dried at 80 °C to remove the residual solvent and promote further condensation of the SiOH groups within the silica network. | ||
In addition to the higher water content in the polymer ionomer, the reduction of the Pt loading has become a critical aspect in the design and operation of PEFCs. Lowering the Pt loading as a result of increasing the Pt utilization is crucial for achieving cost reduction without significantly sacrificing the PEFC performance. According to the experimental observation in this study, we significantly increased the mass activity from 8.3 A gPt−1 to 18.9 A gPt−1 at 50% RH under 0.9 ViR-free. The specific activity increased from 52.5 μA cm−2 to 122.5 μA cm−2 at 50% RH. In the present work, the electrochemical surface area of Pt was not altered irrespective of the addition of SiO2 nanoparticles. This means that the ORR activity of Pt in the vicinity of SiO2 nanoparticles synthesized by in situ sol–gel processes significantly increases compared to that of Pt in the electrode without SiO2 nanoparticles.
In this work, the various conditions were designated as shown: 1) the MEA with TEOS only at the cathode catalyst layer (MEA-C); 2) the MEA with TEOS only at the anode catalyst layer (MEA-A); 3) the MEA without TEOS at both the anode and cathode catalyst layers (MEA-N); and 4) the MEA with TEOS at both the anode and cathode catalyst layers (MEA-C/A).
Materials and methods
Tetraethoxysilane (TEOS) (99.999%, Sigma–Aldrich Co.) was used as the oxide precursor. Commercial Pt supported on graphitized carbon (60 wt%, Johnson–Matthey) was prepared by mixing solutions with 2-propanol, deionized (DI) water and a solution of Nafion DE 521 (5 wt% Nafion, 45 ± 3 wt% water, 48 ± 3 wt% 1-propanol, <4 wt% ethanol with an ion exchange capacity (IEC) of 0.95–1.03 meq g−1, DuPont) without acid or base.The anode and cathode Pt loadings were approximately 0.50 mgPt cm−2 and all the cathodes and/or anodes had 30 wt% ionomer and around 0.9 wt% SiO2. In order to make the catalyst ink, a mixture of Pt/C and the Nafion ionomer was sonicated for 20 min and mixed by a stirrer for 40 min. Subsequently, the selected catalyst ink was prepared by adding equal masses of the TEOS solution and the solid Nafion ionomer into a prepared mixture of the catalyst ink. The anode and cathode catalyst inks were sonicated for an additional 10 min and then stirred for 20 min. The MEA with an active area of 25 cm2 was fabricated by the spray method on a 50 μm-thick Nafion NRE 212 membrane (DuPont). Then, the MEA was dried at 80 °C to remove the residual solvents and to further promote the polycondensation reaction, in which H2O and C2H5OH are lost.
The anode and cathode gases were humidified by passing them through bubbler-type humidifiers. Before the unit cell operation began, we calibrated the humidifiers of both the cathode and anode with a humidity sensor (Viasensor HS-1000). All of the unit cell experiments were conducted at 70 °C and the temperature of the gas lines to the anode and the cathode were always set at 10 °C above the temperature of the humidifier to avoid the condensation of water vapor. In the present study, all MEAs were tested to confirm the stability of the voltage for 24 h under various current conditions before the electrochemical measurements were made. Based on the experimental results, we confirmed that the cell performance does not significantly decrease with time in a long-term stability test. This means that all our experimental results provide sufficient stability of the voltage at each current density under different humidity conditions. After this, polarization experiments were conducted in a galvanostatic mode. An electronic load was used to maintain a constant current. At each current, the cell was allowed to stabilize for 18 min before the voltage of the cell was measured. At currents less than 10 A, the anode was fed with humidified H2 gas at a constant flow rate of 100 mL min−1 and the cathode was fed with humidified air at a constant flow rate of 410 mL min−1 (all at ambient pressure). At currents greater than 10 A, the stoichiometric quantities of H2 and air were 1.43 and 2.5, respectively.
Electrochemical impedance spectroscopy (EIS) measurements were conducted using an HCP-803 analyzer (BioLogic, Science Instruments). At each current, the cell was allowed to stabilize for 18 min, after which the voltage of the cell was measured. All EIS spectra were obtained under the same operating conditions as a measurement test for the polarization curve. The impedance spectra were measured in a constant current mode at 40, 100, 600, 800, 1000, 1200 and 1400 mA cm−2 by sweeping frequencies over a range of 1000 kHz–100 mHz with 20 points decade−1. The impedance spectra were fit using ZView software.5 The cathode and the anode were purged with N2 (1500 mL min−1) and H2 (350 mL min−1) and then cyclic voltammetry (CV) was performed to measure the electrochemical surface area (ECA) of Pt using an EIS potentiostat. The potential range and the scan rate were 0.04–1.2 V (vs. RHE) and 20 mV s−1, respectively. We measured the proton resistance within the electrode via a one-dimensional transmission-line model under an H2-fed anode (reference/counter electrode) and a N2-purged cathode (working electrode).6 The cathode and the anode were purged with N2 (900 mL min−1) and H2 (900 mL min−1).
Thermal gravimetric (TG) analysis (TG 209 F3 Tarsus) was performed to obtain information about the total amount of silica in the MEA. We prepared five samples in order to determine the silica content in the electrode. All experimental samples were conducted five times and the average of twenty five results was taken as the final silica content in the electrode. The technology, known as 29Si solid-state NMR, is a well-established means of determining the coordination environments of 29Si nuclei, which provides the condensation degree of the silica network. The MEA-C without Pt/C was cut into very small fragments that loaded onto a 7 mm rotor. Solid-state NMR spectra were recorded on a 400 MHz Bruker Avance spectrometer operating at a frequency of 80 MHz for the 29Si nucleus and using the magic-angle spinning technique. The sample spinning rate was 10 kHz.
The morphologies of the silica particles and Pt/C were examined using a transmission electron microscope (TEM) (FEI Tecnai G2-20 S-TWIN) and a field emission scanning electron microscope (FE-SEM) (Hitachi S-4700). The Si in the catalyst layer was measured by energy dispersive X-ray spectroscopy (EDS) using an FE-TEM (JEM-2100F, Jeol, Japan, Installed at Korea Basic Science Institute) instrument. X-Ray diffraction (XRD) patterns were recorded on a Rigaku D-max-2500 X-ray diffractometer (Cu-Kα radiation, λ = 1.5406 Å) in the 2θ angular range of 10–80° with a velocity of 0.02° in 4 s.
The size distribution of the ionomer in the Nafion solution was measured with a dynamic light scattering (DLS) spectrometer (Zetasizer Nano ZS, Malvern Instruments). The distributions of the pore sizes of the catalyst layers were obtained by mercury porosimetry (Autopore IV 9500, Micromeritics). Specific surface areas were determined by the Brunauer–Emmett–Teller (BET) method with Micromeritics ASAP 2010 using liquid N2 at 77 K. The total pore volume was calculated from the amount of vapor adsorbed at a relative pressure (P/P0) close to unity, where P and P0 are the measured and the equilibrium pressures, respectively. This calculation assumes that all the pores are filled with condensed N2 in the normal liquid state. Once the relative pressure at the beginning of the hysteresis was obtained, the pore size distribution was established using the Barrett–Joyner–Halenda (BJH) method.
A humidity sensor (Viasensor HS-1000) was used to measure the vapor pressure of water at a constant current density of 400 mA cm−2. A humidity sensor was connected at the outlet of the anode in order to compare the water permeation via the polymer membrane.
Results and discussion
A Nafion binder solution with TEOS, which consists of carbon black (Vulcan XC-72) without Pt, was sprayed onto an NRE 212 membrane in order to observe the silica nanoparticles more closely, as shown in Fig. 2. As a result, we observed amorphous silica particles that were smaller than 5 nm. Thus, the XRD results showed that no peaks associated with silica were observable, which also indicated that silica exists in the amorphous state (ESI, Fig. S1†). As shown in Fig. 3, TEM micrographs of MEA-N and MEA-C showed that the Pt catalyst and silica could not be distinguished easily. However, the bimodal particle size distribution showed that the amorphous silica particles, which were <4.0 nm, existed in the catalyst layer of MEA-C. The TGA measurement indicated that the total amount of silica in the MEA-C without Pt/C was 0.9 wt%, while the percentage of the residual mass of MEA-N without Pt/C was 0.8 wt% (ESI, Fig. S2†). Thus, it was difficult to find distinct silica nanoparticles everywhere in the prepared sample due to low silica content. To obtain more specific information about the two MEAs with and without SiO2 nanoparticles, we measured the pore structure using Hg porosimetry and the BJH method, as shown in Fig. 4. It is well known that the pores formed by the Pt/C catalyst layers can be classified into primary pores (i.e., pores formed between the primary carbon particles) and secondary pores (i.e., pores formed between the carbon agglomerates). Although the boundary between the two regions of the pores depends extensively on the materials that are used and the process used to prepare the catalyst layer,7 the porosimetry results for the two MEAs suggested that the primary pores in the MEA with SiO2 nanoparticles were fewer in number than the primary pores in the MEA without SiO2 nanoparticles. These results indicate that the SiO2, which was synthesized by the in situ sol–gel reaction of TEOS, exists as very small nanoparticles in the primary pores of the catalyst layer.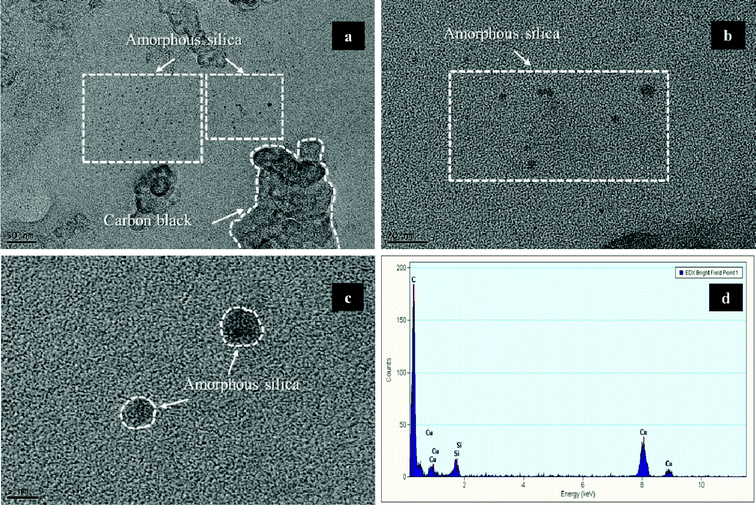 | ||
| Fig. 2 (a–c) Bright field TEM images of amorphous silica particles synthesized by the in situ sol–gel reaction of tetraethoxysilane (TEOS) in a Nafion ionomer solution without Pt. (d) An EDS spectrum of a selected amorphous silica particle. | ||
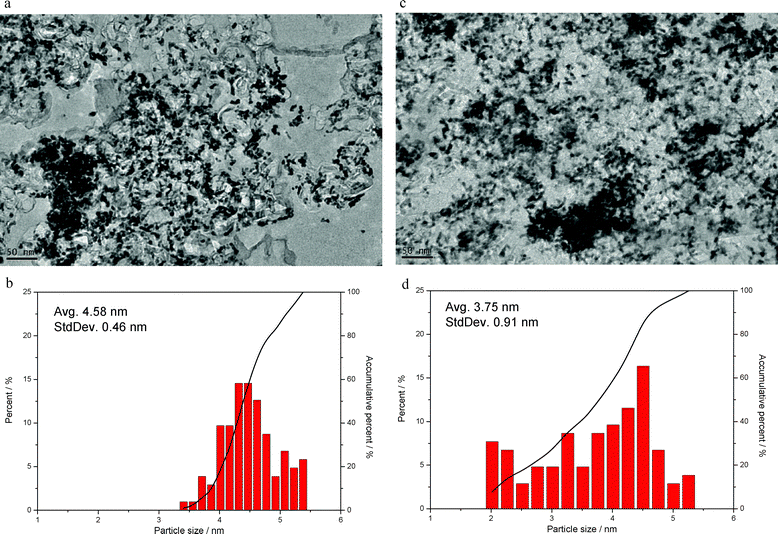 | ||
| Fig. 3 (a) TEM image of MEA-N, (b) particle size distribution of MEA-N without silica nanoparticles, (c) TEM image of MEA-C and (d) particle size distribution of MEA-C with silica nanoparticles. | ||
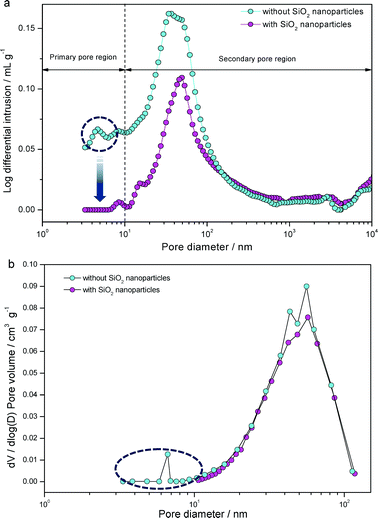 | ||
| Fig. 4 (a) Pore size distributions in membrane electrode assemblies (MEAs) with and without SiO2 nanoparticles analyzed by mercury porosimetry (Autopore IV 9500, Micrometrics). (b) Pore size distributions in MEAs calculated from nitrogen adsorption data using the BJH method. | ||
Additional analyses of the catalyst layer in MEA-C using scanning TEM–EDS showed that the Si was distributed uniformly in the vicinity of the graphitic carbons and the Pt catalysts without significant particle aggregation, as shown in Fig. 5. However, this result could be attributed to TEOS with either ethyl groups or Si–OH groups. It is generally known that the residual ethyl groups of TEOS have a negative influence on the proton conductivity. A low number of Si–OH groups decreases the amount of water adsorbed by the silica nanoparticles and the large volume occupied by the ethyl groups compared with hydroxyl groups blocks the proton channels between the sulfonate acid groups (–SO3H) in Nafion.8 Thus, it is important to confirm the coordination environments of the 29Si nuclei of the silica nanoparticles within the MEA. Solid-state 29Si NMR is a well-established means of determining the coordination environments of 29Si nuclei. As shown in Fig. 6, there was no Si resonance observed at ∼ −80 ppm in the 29Si spectra, confirming that there was no unreacted TEOS with ethyl groups. This indicates that full hydrolysis of TEOS can be achieved in a mixture of a Nafion ionomer and a TEOS solution. Therefore, we can conclude that the uniform distribution of Si in the TEM–EDS image of MEA-C is attributable to the Si–OH groups instead of the ethyl groups of TEOS. Additionally, we will discuss the change in the proton resistance of the catalyst layer following the addition of TEOS. A silicon atom, which is bonded to three other silicon atoms through oxygen, can be depicted as HO–Si–(O–Si)3 and is generally denoted as Q3, with a chemical shift of approximately −100 ppm. Similarly, Si–(O–Si)4, denoted as Q4, has a chemical shift of approximately −110 ppm.8,9 As shown in Fig. 6, the greater the Q3/Q4 ratio becomes, the greater the surface area becomes and the larger the number of surface hydroxyl groups there are. Therefore, a smaller average size of silica particles exists for the same total amount of SiO2. Furthermore, higher Q3/Q4 ratios are desirable because additional surface hydroxyl groups help to retain water via hydrogen bonding.
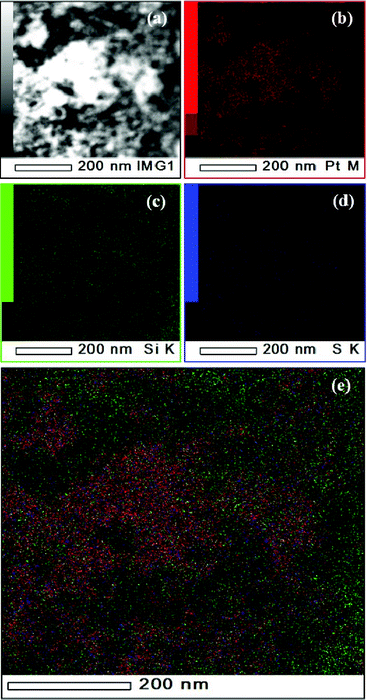 | ||
| Fig. 5 (a) Dark-field TEM image of catalyst layer in MEA-C. (b-e) Corresponding EDS Elemental mapping of the same catalyst layer region shown in Fig. 5(a), indicating spatial distribution of (b) Pt (red), (c) Si (green), (d) S (blue), and (e) combined image of elements consisted of (b-d) respectively. The images were obtained on FE-TEM (JEM 2100F, JEOL) at an accelerating voltage of 200 kV. | ||
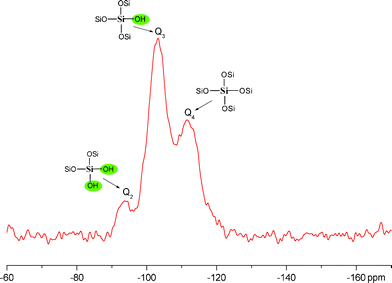 | ||
Fig. 6 Solid-state 29Si MAS NMR spectra of the silica nanoparticles within MEA-C (59.7 MHz, MAS rate = 5 kHz): Q2![[thin space (1/6-em)]](https://www.rsc.org/images/entities/char_2009.gif) :Q3:Q4 = 10:57:33 (−93.5, −103.2, −111.5 ppm). :Q3:Q4 = 10:57:33 (−93.5, −103.2, −111.5 ppm). | ||
Amorphous silica has two types of surface groups, i.e., singly Si-coordinated and doubly Si-coordinated functionalities. The estimated affinity constant for the protonation of doubly-coordinated Si2–O0 is extremely low, which means that these groups can be considered as inert, as is generally accepted.10 It is well known that the surfaces of singly-coordinated groups (i.e., silanol groups) in aqueous environments have electric charges that are dependent on pH. In the presence of water, the silanol groups ionize, producing mobile protons that associate and dissociate from the silica surface. The equilibrium of the proton adsorption/desorption reactions for singly-coordinated surface Si groups can be written as a two-step reaction: 11
| Si–O− + H3O+ ↔ SiOH0 | (1) |
| Si–OH0 + H3O+ ↔ SiOH2+ | (2) |
The protonation of the oxo groups on the left hand side of eqn 1 occurs at about log K = −7.2 and the association constant for eqn 2 is at about log K = −1.9.10 Pettersson and Rosenholm showed that the rate of the proton adsorption reaction of SiOH was increased significantly in the low pH range (<pH 3.5), which leads to a rapid increase of the ζ potential and the formation of positively-charged SiOH2+.11 Since the pKa value of sulfonate acid groups (–SO3H) in Nafion is around −6, the sulfonate acid groups are fully dissociated at pH < 2, which leads to negatively-charged sulfonate groups (–SO3−) in Nafion.12 Thus, it can be assumed that the Nafion ionomer will self-assemble on the surface of the silica nanoparticles through electrostatic interactions under low pH conditions, which will prevent further growth of the silica nanoparticles that were initially formed.13
In order to offer a concrete explanation of changes in the microstructure of the Nafion ionomer with in situ-formed silica nanoparticles, we prepared a specific Nafion solution under low pH conditions as follows: the Nafion DE 521 solution (5 wt%, DuPont) and TEOS solution in isopropyl alcohol (IPA)/DI water was dispersed to form a mixture and to facilitate the hydrolysis of TEOS, whereby the mixture was sprayed directly onto each side of a Nafion NRE 212 membrane at 80 °C. Subsequently, the Nafion membrane with the silica nanoparticles was dissolved in IPA for 140 h at 25 °C to form 1 wt% solutions. After the solutions were adjusted to pH 1.90 ± 0.02 with 0.5 M HCl, the solutions were continuously stirred for 15 h. The Nafion solution with the silica nanoparticles was more opaque than the Nafion solution without silica, as shown in Fig. S3 in the ESI†. The ζ potential of the Nafion ionomer solution without silica in IPA was around −26.8 ± 0.8 mV, whereas the ζ potential of the Nafion ionomer solution with silica was −33.4 ± 0.9 mV. The ζ potential of the Nafion ionomer solution with silica was greater than that without silica. Furthermore, it can be seen in Fig. 7a, which was obtained from dynamic light scattering (DLS) measurements, that the Nafion ionomer solution with silica has larger particles, i.e., a hydrodynamic diameter of ∼930 nm, as compared to the Nafion ionomer solution without silica. When the negatively charged sulfonate groups (–SO3−) in Nafion assembled on the positively charged SiOH2+ groups, due to an electrostatic attraction (Fig. 7b), the concentration of Nafion in the vicinity of SiO2 increased and the dangling chains in Nafion became incorporated into other Nafion ionomers via hydrophobic interactions with the Nafion backbone, which led to a greater negative charge than that of the individual Nafion ionomer. This is consistent with results presented by Zhang et al.13 In addition to the Nafion ionomer with a hydrodynamic diameter of ∼930 nm, the agglomeration of the inorganic particles in the solvent was also detected to be ∼20 nm.
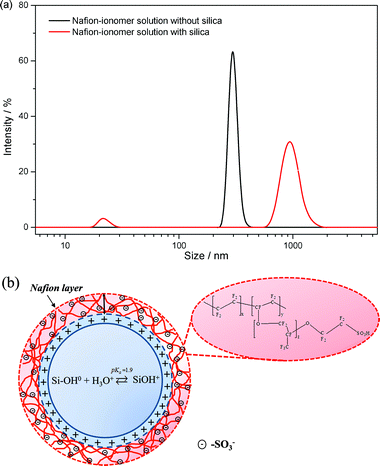 | ||
| Fig. 7 (a) Size distribution curves of a Nafion ionomer dissolved in IPA. (b) An illustration of self-assembly between negatively charged Nafion ionomers and positively charged silica nanoparticles. | ||
From the results of the ζ potential and the DLS measurements, it can be concluded that the size of the Nafion ionomer assembled on SiOH2+ increases due to the electrostatic attraction between negatively charged –SO3− groups and positively charged SiOH2+ groups at around pH 1.90. From what has been stated thus far, it follows that self-assembly is one of the crucial aspects in the performance of PEFCs. We can assume that the self-assembly process between positively charged SiOH2+ groups and negatively charged –SO3− groups in Nafion helps to counteract the effect of the specific adsorption of –SO3− groups on Pt–O, which enhances the ORR in the catalyst layer of the cathode (i.e., both the anode and cathode of the PEFC operated at very low pH < 1 14).
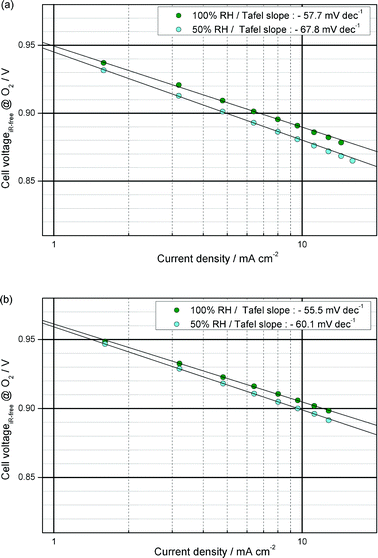
Wood et al. demonstrated the morphological rearrangement between the hydrophobic backbone and hydrophilic side chains in Nafion at the interface between Nafion and Pt using neutron reflectometry.15 They revealed that more –SO3− groups are present in the region of Pt–O and that the hydrophobic portion of Nafion is pushed away from the oxide interface during the ORR. However, the highly-aggregated –SO3H groups could suppress the ORR kinetics that occur on the surface of the Pt due to the specific adsorption of –SO3H groups on Pt.3b,16 In particular, the decrease in the number of water molecules per –SO3H group increases the concentration of –SO3H at the interface between the Pt and the ionomer, which results in a large decrease in mass activity (MA) at low RH.3b However, the self-assembly process between positively charged SiOH2+ groups and negatively charged –SO3− groups in Nafion may reduce the specific adsorption of –SO3H groups on the surface of Pt–O, which could enhance the ORR kinetics in the cathode catalyst layer at low RH. In the present work, Fig. 8 and 9a show that the MA values of MEA-C and MEA-N at 100% RH and 0.9 ViR-free were 23.8 and 11.4 A gPt−1, respectively. The Tafel slopes of MEA-C and MEA-N were −55.5 and −57.7 mV dec−1, respectively. (The MA and the Tafel slope were calculated from the iR-corrected I–V curve under O2 conditions and ambient pressure. The proton resistance in the ionomer binder of the catalyst layer was not corrected. At each current, there was a 18 min wait for the cell to stabilize and then the voltage of the cell was measured. The MA was defined as the current at 0.9 ViR-free per unit Pt mass.) Fig. 8 and 9a also show that the MA values of MEA-C and MEA-N at 50% RH were 18.9 and 8.3 A gPt−1, respectively. The Tafel slopes of MEA-C and MEA-N at 50% RH were −60.1 and −67.7 mV dec−1, respectively.
 | ||
| Fig. 8 Tafel slopes from corrected polarization curve data of (a) MEA-N and (b) MEA-C. Data are corrected by measured ohmic losses and crossover. | ||
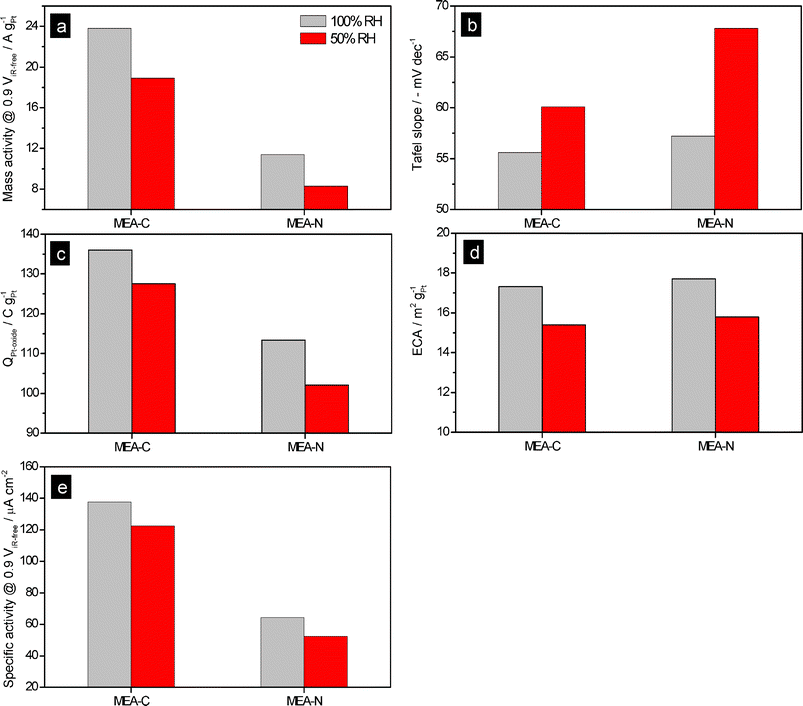 | ||
| Fig. 9 (a) Mass activity values of MEA-N and MEA-C; (b) Tafel slopes of MEA-N and MEA-C; (c) Pt oxide formation charge (QPt-oxide) values of MEA-N and MEA-C; (d) Electrochemical surface area (ECA) of MEA-N and MEA-C; (e) Specific activity values of MEA-N and MEA-C. In order to calculate the specific activity, we used the ECA values measured at 70 °C. | ||
As shown in Fig. 8 and 9b, there were no significant differences between the Tafel slopes of MEA-C and MEA-N at 100% RH. However, the value of the Tafel slope for MEA-N at 50% RH was greater than that of MEA-C, which means that the specific adsorption on Pt inhibits the ORR kinetics and protons are in insufficient supply for utilization by the Pt catalyst in the region of low current under low RH conditions, as shown in Fig. 10. In other words, this indicates that the specific adsorption of –SO3− groups on Pt in MEA-C was mitigated due to the self-assembly and there was no significant problem related to proton transport in the ionomer binder of the catalyst layer with silica nanoparticles because of the water molecules adsorbed on the silica nanoparticles under low RH conditions. These explanations were examined in more detail by analysing the water content in the polymer membrane as well as the proton resistance in the catalyst layer and the results are presented below. Generally, it has been reported that the MA has a significant dependence on the specific adsorption as compared to the Tafel slope and the electrochemical surface area (ECA).16a In this study, there is a very distinct difference between the MA of MEA-C and MEA-N at 50 and 100% RH as compared to the Tafel slopes. It is evident that the MA of MEA-C is twice as large as the MA of MEA-N under different RH conditions. Under high RH conditions, the difference in the MA between MEA-C and MEA-N means that the self-assembly process between positively charged SiOH2+ groups and negatively charged –SO3− groups in Nafion helps to counteract the specific adsorption of –SO3− groups on Pt. Under low RH conditions, the higher value of the MA of MEA-C also indicates that H2O molecules generated by the ORR on the Pt electrode can be adsorbed directly by the silanol groups, which may increase the number of water molecules per –SO3H group and mitigate a specific adsorption by the –SO3− groups on the Pt catalysts.
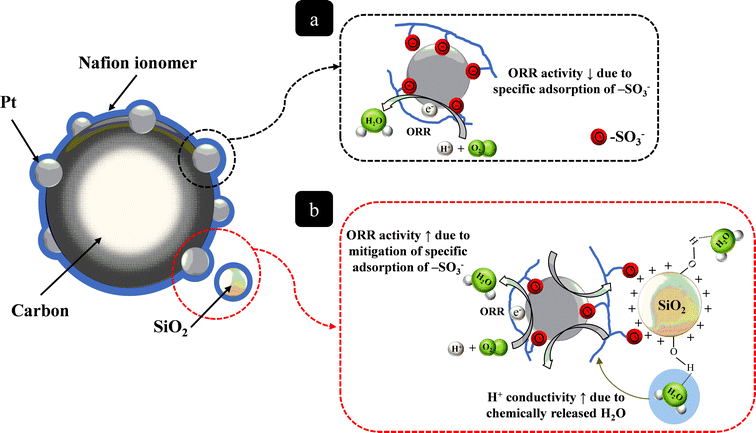 | ||
| Fig. 10 Schematic depiction of (a) specific adsorption of the sulfonate groups (–SO3−) on Pt; (b) mitigation of specific adsorption by the sulfonate groups (–SO3−) on Pt due to the self-assembly between positively charged silica particles and the negatively charged sulfonate groups. | ||
If there were a sufficient number of water molecules at the interface between the –SO3H groups and the Pt surface for the surface oxidation of Pt, the water molecules would increase the MA as well as Pt oxide formation at low RH. At a higher potential, i.e., more than 0.7 V versus the reversible hydrogen electrode (RHE), the electrochemical chemisorption of oxygen and Pt oxidation are initiated with the following reactions:
| Pt + H2O → Pt–OHad + H+ + e− | (3) |
| Pt–OHad + H2O → Pt–O + H3O+ + e− | (4) |
From the cyclic voltammetry (CV) positive potential scans, we obtained the Pt oxide formation charge (QPt-oxide) at different RH conditions. As shown in Fig. 9c, the QPt-oxide of MEA-C is much higher than that of MEA-N under 100 and 50% RH. Since H2O molecules are related directly to reactions (3) and (4), a low concentration of H2O on the surface of Pt could lead to the suppression of QPt-oxide at low RH conditions. The presence of silica nanoparticles in the vicinity of Pt nanoparticles may increase the water concentration on the surface of Pt, which could enhance the formation of Pt oxide at low RH.
Cyclic voltammetry (CV) was conducted in order to measure the electrochemical surface area (ECA) of Pt at 70 °C. As a result, we obtained results for the ECA, which, for MEA-C, decreased from 17.3 m2 gPt−1 at 100% RH to 15.4 m2 gPt−1 at 50% RH, as shown in Fig. 9d. For MEA-N, the ECA decreased from 17.7 m2 gPt−1 at 100% RH to 15.8 m2 gPt−1 at 50% RH. It is well known that the ECA for hydrogen adsorption/desorption in the CV profile depends on the size of the Pt particles, the binder structure, the cell temperature, the technique used to prepare the electrode and the flow rate of the reactant during the CV measurement. In this work, the theoretical ECA of the Pt nanoparticles that we used was 65.5 m2 gPt−1. The diameter of the Pt nanoparticles calculated from the TEM images was 4.58 ± 0.46 nm (Fig. 3). In this study, the diameters of the Pt nanoparticles were unchanged when the TEOS solution was added. Hydrolyzed alkoxysilanes may migrate to the negatively charged sulfonate groups (–SO3−) due to the rapid increase in the zeta potential (ζ) at pH < 2 and a core–shell structure can be formed. Thus, the Nafion ionomer with a core–shell structure can not penetrate deeply into the primary pores of the electrode and the utilization of Pt in unaffected. As shown in Fig. 4, the significant reduction of the primary pores in the electrode is attributed to the silica nanoparticles. Considering the ECA values of MEA-N and MEA-C, we calculated the specific activity of Pt. As a consequence, the specific activity of Pt in MEA-C was found to be much greater than that of MEA-N, as shown in Fig. 9e.
Polarization experiments were conducted in a galvano-static mode. An electronic load was used to maintain a constant current. At each current, the cell was allowed to stabilize for 18 min, after which the voltage of the cell was measured. Four significant observations can be made from Fig. 11: 1) the performance of the MEA-C cell at 50% RH does not decrease significantly in comparison to that at 100% RH, i.e., the current densities of MEA-C and MEA-N at 50% RH and 0.6 V were 655 mA cm−2 and 476 mA cm−2, respectively (Fig. 11a); 2) the high frequency resistance (HFR) of MEA-C was lower than those of other types of MEA due to proton transport in the polymer membrane (Fig. 11c and d); 3) the cell performance of MEA-N and MEA-C/A were similar at 50% RH (Fig. 11a); and 4) there was a detrimental effect on the cell performances of MEA-C/A and MEA-A at 50% RH (Fig. 11a). These results indicate that the novel composite catalyst layer has a remarkable ability to retain water and that the chemically adsorbed water in SiO2 may be released into the electrode and polymer membrane. In general, the water transport inside the polymer membrane is determined mainly by the electro-osmotic drag (i.e., the dragging of water molecules from the anode to the cathode by the current-carrier protons), back-diffusion (i.e., the transfer of water into the membrane due to the concentration gradient of the water from the cathode to the anode) and convection (i.e., water movement that occurs due to pressure gradients between the cathode and the anode). However, the convection effect is generally negligible compared to the effects of electro-osmotic drag and back diffusion because there is no pressure difference between the anode and the cathode. Thus, electro-osmotic drag and back diffusion dominate the water transport inside the polymer membrane of a PEFC.17
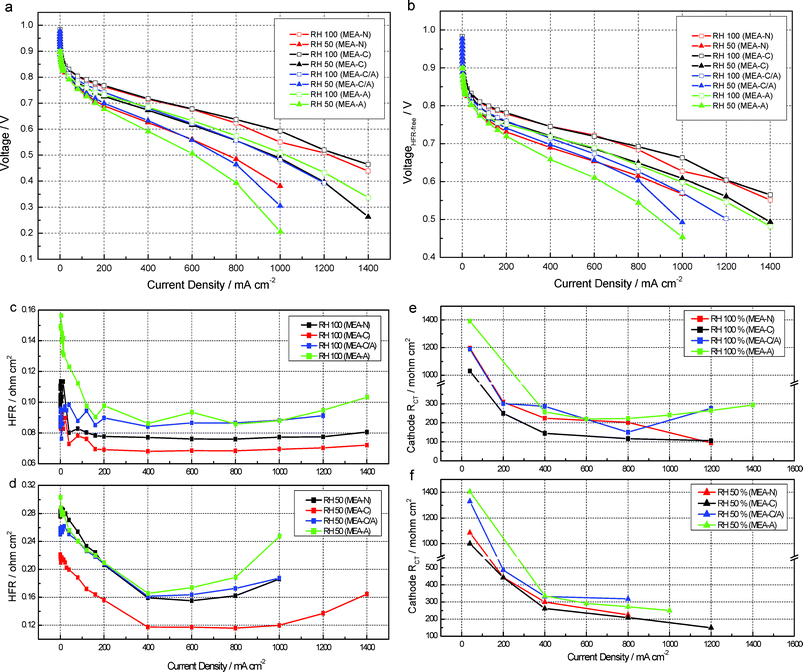 | ||
| Fig. 11 Electrochemical characterization of MEAs. (a) High frequency resistance (HFR)-uncorrected polarization curves; (b) HFR-corrected polarization curves; (c) HFR values at 100% RH; (d) HFR values at 50% RH; the cathode charge-transfer resistance (RCT) of MEAs at 100% RH (e) and 50% RH 50 (f). | ||
As shown in Fig. 11c and 11d, MEA-C has a lower HFR value as compared to the other MEAs. Furthermore, the HFR values of MEA-C are much lower than the others at 50% RH. This may be attributed to the enhanced back diffusion. When the catalyst layers of the anode and the cathode are dehydrated under conditions of low humidity, the catalyst layer on the cathode is more easily dehydrated than the catalyst layer on the anode due to excessive water loss caused by the high stoichiometric air flow.17 This phenomenon has a detrimental effect on back diffusion in the PEFC due to the low concentration of water in the catalyst layer of the cathode. Thus, if the back diffusion of water from the cathode to the anode through the polymer membrane is sufficient to maintain an adequate water content in the polymer membrane and the binder, the performance of the cell may be increased significantly due to sufficient water transport from the cathode to the anode. Consequently, it is important to maintain a high concentration of water in the catalyst layer of the cathode under conditions of low humidity. When the electrode is dehydrated, the chemically adsorbed water in SiO2 is released into the electrode, which increases the concentration of water at the cathode as compared to the anode. A higher concentration of water at the cathode enhances back diffusion via the polymer membrane and then the advantage of water transport from the cathode side to the anode side offers excellent proton conductivity to the polymer membrane under dehydration conditions. However, if the anode has SiO2 nanoparticles, the amount of water transported by back diffusion decreases due to the small difference between the concentrations of water at the cathode and the anode. As shown in Fig. 11c and 11d, the HFR values of MEA-A and MEA-C/A at 50% and 100% RH were greater than the other HFR values. In order to compare the water transport via the polymer membrane according to the different types of MEA, a humidity sensor (Viasensor HS-1000) was connected to the outlet of the anode to measure the vapor pressure of the water at a constant current density of 400 mA cm−2 at 50% RH. As shown in Fig. 12, the dew point of the anode`s exhaust gas in MEA-C is greater than the dew points of the exhaust gases from the other MEAs. Specifically, the dew points of MEA-C, MEA-A, MEA-C/A and MEA-N were 53.6 ± 0.3, 49.7 ± 0.2, 52.2 ± 0.2, and 52.2 ± 0.4 °C, respectively. The dew points were in the following increasing order: MEA-A < MEA-N < MEA-C/A < MEA-C. The dew point of the inlet gas at the anode was 55.2 ± 0.1 °C.
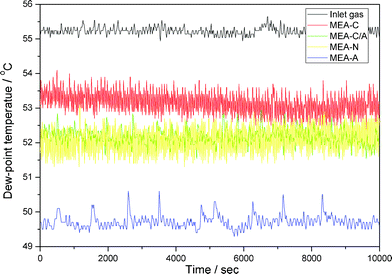 | ||
| Fig. 12 Dew-point temperatures of the exhaust gas at the anode as a function of time. The cell temperature was set to 70 °C and the anode was fed humidified H2 gas of 50% RH at a flow rate of 100 mL min−1 and the cathode was fed with humidified air of 50% RH at a flow rate of 410 mL min−1 with a constant current density of 400 mA cm−2 under ambient pressure. | ||
Considering the dew points obtained experimentally, the water transport caused by electro-osmotic drag was greater than that caused by back diffusion. However, these results are based on the assumption that water transport from the cathode side to the anode side is enhanced by the addition of a TEOS solution to only the catalyst layer of the cathode as it enhances back diffusion. As mentioned earlier, a further increase in the concentration of water in the catalyst layer at the anode may be responsible for the decrease in the difference between the concentrations of water in the catalyst layers of the anode and cathode, resulting in reduced water transport from the cathode to the anode and severe water flooding at the catalyst layer of the cathode under conditions of high RH. This indicated that the addition of TEOS to the catalyst layer of the anode was inadequate for providing higher cell performance at conditions of high RH.
Fig. S4† shows the differences in the cell potential (δE) between an initial time and 280 s as a function of the current density. For MEA-A at 50% RH, the δE increased slightly with increasing current densities less than 600 mA cm−2, but it increased more rapidly at current densities greater than 800 mA cm−2 as compared to the others. Fig. S5† also shows the variation of voltage as a function of time for various RH conditions and various current density conditions. As shown in Fig. S5 d–f,† the performance of MEA-A was strongly dependent on the applied current density and operation time at 50% RH. As the current density increased, the voltage increased between the initial time and 25 s for MEA-A, which was greater than the others at 50% RH. This may be attributed to the change in the water transport through the polymer membrane. (See the ESI, Fig. S6.†) For MEA-A at 50% RH, the concentration of water at the catalyst layer of the anode (CLa) was greater than that at the catalyst layer of the cathode (CLc) due to the high flow rate on the cathode side and the chemically adsorbed water in the SiO2. Thus, the water molecules were transported from the anode side to the cathode side through the polymer membrane via to back diffusion caused by the difference in the concentration of water. When the cell operated at constant current density, the water molecules were also transported from the anode side to the cathode side due to electro-osmotic drag. Under this condition, the water content of the polymer membrane decreased significantly in the vicinity of the catalyst layer on the anode, which resulted in a higher overpotential due to the increase in the resistance to proton transfer in the polymer membrane. However, at the same time, the concentration of water at the CLc increased over time because water molecules were produced by the ORR and water transport from the cathode side to the anode side increased. For these reasons, the water content of the polymer membrane increased due to back diffusion caused by an increase in water molecules at the cathode side at low RH, which led to a decreased resistance to proton transfer in the polymer membrane. For MEA-C at 50% RH, the water transport from the cathode side to the anode side may not change due to the high concentration of water at the CLc. During the operation of the cell at a constant current density, the amount of water at the CLc increased over time, which enhanced back diffusion from the cathode side to the anode side. It can be noted that the direction of water transport via the polymer membrane did not change as compared to the MEA-N. For MEA-N and MEA-C/A, the difference in the voltage between the two MEAs was not significantly different. Although the concentration of water in the catalyst layers of MEA-C/A was greater than that in MEA-N, the difference in the water concentration between the CLa and CLc of MEA-C/A was similar to that of MEA-N. This phenomenon had little influence on the water transport through the polymer membrane.
During the fabrication of the Nafion-based catalyst layer with silica, phase separation occurred between the hydrophilic sulfonic acid groups and the hydrophobic backbone in the Nafion ionomer, resulting in a spherical ionic cluster structure interconnected by narrow channels of sulfonic acid groups. Potentially, the SiO2 nanoparticles can be impregnated into the negatively charged, spherical −SO3− groups due to the high ζ potential of the silica surface at low pH, which results in a core–shell structure in the electrode. Doping silica in the Nafion ionomer will have two opposing effects on proton transport in the catalyst layer. A desirable effect is that the concentration of water will be increased by the formation of hydrogen bonds between water and the hydroxyl groups of the silica. An undesirable effect is that the proton pathway will be blocked by silica particles due to the high silica content, as well as the large size of the silica particles and the residual ethyl groups on the surface of the silica.8 However, in this work, the Nafion-based catalyst layer, with approximately 0.9 wt% SiO2 nanoparticles, has smaller sized silica particles and there are no residual ethyl groups to hinder the transfer of protons in the catalyst layer. When the catalyst layer was fully saturated at high RH, the R–SO3H–SiO2 was disassociated fully to form R–SO3H and HO–Si–O in the catalyst layer, which do not have a detrimental effect on the proton conductivity of the Nafion ionomer at high RH.18 In this work, the proton resistance in the Nafion ionomer-based catalyst layer on the cathode for MEA-N and MEA-C at 100% RH was 8.6 and 7.3 mΩ cm2, respectively. (The average thicknesses of the catalyst layers of MEA-N and MEA-C on the cathode were 24.4 ± 0.7 and 24.7 ± 0.8 μm, respectively.) Furthermore, Fig. 11e shows the cathode charge transfer resistance, which consists of electron and proton transfer resistance, at the interface between the Pt catalyst and the binder as a function of current density. At 100% RH, the cathode charge transfer resistance of MEA-C was much lower than the resistance of the others. These results are very impressive because the addition of excessive quantities of oxide particles may decrease the charge transfer dynamics (proton and/or electron) of the electrodes due to the insulating properties of the oxide particles. Vulcan carbon contains heterocyclic sulfur that associates preferentially with colloidal particles and, therefore, strongly binds the silica colloids.19 If the SiO2 nanoparticles are associated closely with Vulcan carbon, the interfacial contact between the Vulcan carbons decreases, resulting in a significant increase of the resistance to electron charge transfer. However, we used graphitic carbon as the supporting material for Pt in this work. Consequently, we can decrease the effect of heterocyclic sulfur on the aggregation of silica colloids. Furthermore, the core–shell structure of the SiO2 nanoparticles and Nafion ionomer does not restrict the interfacial contact between the graphitic carbons. Consequently, this indicates that self-assembled Nafion–SiO2 does not deteriorate the interfacial contact between graphitic carbon particles due to the very small size distribution of the SiO2 nanoparticles and the core–shell structure. In the present study, the self-assembled Nafion ionomers with small silica particles exist in the catalyst layer in which there are well connected pathways for proton hopping at high RH, which contributes toward a reduction of the charge transfer resistance in the catalyst layer.
For 50% RH, the proton resistance values in the catalyst layers for MEA-N and MEA-C were 119.3 and 91.2 mΩ cm2, respectively. Furthermore, at 50% RH, the cathode charge transfer resistance of MEA-C was much lower than the resistance of the others, indicating that the chemically adsorbed water molecules in the SiO2 nanoparticles were released into the Nafion binder, thereby increasing proton hopping through the hydrogen bond network of the water molecules in the catalyst layer.
Conclusions
We have developed a novel, composite catalyst layer synthesized by a in situ sol–gel process with TEOS in a Nafion solution with Pt/C for PEFCs under low humidity conditions. This method does not need extensive reaction times or the use of additional solvents to accomplish the sol–gel reaction of TEOS at a high temperature, as compared to other ex situ sol–gel methods. In the in situ sol–gel process, –SO3H groups attached to the Nafion polymer conveniently serve as catalysts for the hydrolysis reaction thanks to their very high acidity. Hydrolyzed alkoxysilane molecules migrate to the negatively charged sulfonate group (–SO3−) due to the rapid increase in the ζ potential of the SiO2 nanoparticles at pH < 2. Potentially, the SiO2 nanoparticles are impregnated into the spherical –SO3− groups due to the high ζ potential of the surface of the silica at low pH and the core–shell structure, which is formed in the electrode. SiO2 nanoparticles are distributed uniformly in the catalyst layer without significant particle aggregation. The core–shell structure decreased the specific adsorption of the –SO3− groups on the surface of Pt, which increased the ORR activity in the catalyst layer at the cathode as compared to the MEAs without the TEOS solution. The most important point of this study is that MEAs with the TEOS solution do not deteriorate the interfacial contact between the graphitic carbon particles due to the very small size distribution of the SiO2 nanoparticles and the core–shell structure. The novel, composite catalyst layer that we developed enhanced the water content in the polymer membrane at low humidity. This is attributed to higher a water concentration at the cathode catalyst layer, which leads to enhanced back diffusion and decreases the ohmic resistance in the polymer membrane at 50% RH. These results lead us to the conclusion that the remarkable increase in the performance of the cell at low humidity shows the promising potential of a novel, composite catalyst layer for high-temperature PEFCs at conditions of low humidity.Acknowledgements
This work was supported by New & Renewable Energy R&D program (20113020030020) under the Ministry of Knowledge Economy, Republic of Korea. We would like to thank Il-Kwon Sung, Min-Young Kim, Jun-Yong Kim and Sang-Kyun Kim for their expert help in making all the MEAs tested in this study. We want to acknowledge Jae Hyun Park for providing the BET results of the MEAs.References
- T. Kim, Y. Choi, C. Kim, T. Yang and M. Kim, J. Mater. Chem., 2011, 21, 7612–7621 RSC.
- (a) C. Morin, D. Simon and P. Sauter, J. Phys. Chem. B, 2004, 108, 12084–12091 CrossRef CAS; (b) T. Yoda, T. Shimura, B. Bae, K. Miyatake, M. Uchida and M. Watanabe, Electrochim. Acta, 2010, 55, 3464–3470 CrossRef CAS; (c) A. B. Beleke, K. Miyatake, H. Uchida and M. Watanabe, Electrochim. Acta, 2007, 53, 1972–1978 CrossRef CAS; (d) J. Peron, Z. Shi and S. Holdcroft, Energy Environ. Sci., 2011, 4, 1575–1591 RSC.
- (a) K. Kidena, T. Ohkubo, N. Takimoto and A. Ohira, Eur. Polym. J., 2010, 46, 450–455 CrossRef CAS; (b) T. Yoda, T. Shimura, B. Bae, K. Miyatake, M. Uchida, H. Uchida and M. Watanabe, Electrochim. Acta, 2009, 54, 4328–4333 CrossRef CAS; (c) T. Kim, S. Yim, Y. Choi, T. Yang, Y. Yoon, S. Park, C. Kim and I. Sung, Electrochem. Commun., 2011, 13, 1313–1316 CrossRef CAS; (d) Y. Takamura, E. Nakashima, H. Yamada, A. Tasaka and M. Inaba, ECS Trans., 2008, 16, 881–889 CrossRef CAS; (e) L. Zhang, C. Ma and S. Mukerjee, Electrochim. Acta, 2003, 48, 1845–1859 CrossRef CAS; (f) L. Zhang, C. Hampel and S. Mukerjee, J. Electrochem. Soc., 2005, 152, A1208–A1216 CrossRef CAS; (g) M. B. Ji, Z. D. Wei, S. G. Chen and L. Li, J. Phys. Chem. C, 2009, 113, 765–771 CrossRef CAS.
- (a) U. H. Jung, K. T. Park, E. H. Park and S. H. Kim, J. Power Sources, 2006, 159, 529–533 CrossRef CAS; (b) U. H. Jung, S. U. Jeong, K. T. Park, H. M. Lee, K. Chun, D. W. Choi and S. H. Kim, Int. J. Hydrogen Energy, 2007, 32, 4459–4465 CrossRef CAS; (c) S. Vengatesan, H. Kim, S. Lee, E. Cho, H. Y. Ha, I. Oh, S. Hong and T. Lim, Int. J. Hydrogen Energy, 2008, 33, 171–178 CrossRef CAS; (d) H. Su, L. Xu, H. Zhu, Y. Wu, L. Yang, S. Liao, H. Song, Z. Liang and V. Birss, Int. J. Hydrogen Energy, 2010, 35, 7874–7880 CrossRef CAS; (e) J. H. Tian, P. F. Gao, Z. Y. Zhang, W. H. Luo and Z. Q. Shan, Int. J. Hydrogen Energy, 2008, 33, 5686–5690 CrossRef CAS; (f) H. Su, L. Yang, S. Liao and Q. Zeng, Electrochim. Acta, 2010, 55, 8894–8900 CrossRef CAS.
- T. Kim, S. Lee and H. Park, Int. J. Hydrogen Energy, 2010, 35, 8631–8643 CrossRef CAS.
- (a) Y. Liu, M. W. Murphy, D. R. Baker, W. Gu, C. Ji, J. Jorne and H. A. Gasteiger, J. Electrochem. Soc., 2009, 156, B970–B980 CrossRef CAS; (b) Y. Liu, C. Ji, W. Gu, D. R. Baker, J. Jorne and H. A. Gasteiger, J. Electrochem. Soc., 2010, 157, B1151–B1162 Search PubMed; (c) D. L. Wood and R. L. Borup, J. Electrochem. Soc., 2010, 157, B1251–B1262 CrossRef CAS.
- (a) S. D. Yim, Y. J. Sohn, S. H. Park, Y. G. Yoon, G. G. Park, T. H. Yang and C. S. Kim, Electrochim. Acta, 2011, 56, 9064–9073 CrossRef CAS; (b) R. Fernández, P. Ferreira-Aparicio and L. Daza, J. Power Sources, 2005, 151, 18–24 CrossRef; (c) T. Soboleva, K. Malek, Z. Xie, T. Navessin and S. Holdcroft, ACS Appl. Mater. Interfaces, 2011, 3, 1827–1837 CrossRef CAS.
- G. Ye, C. A. Hayden and G. R. Goward, Macromolecules, 2007, 40, 1529–1537 CrossRef CAS.
- (a) F. Babonneau, K. Thorne and J. D. Mackenzie, Chem. Mater., 1989, 1, 554–558 CrossRef CAS; (b) C. G. Wu, D. C. DeGroot, H. O. Marcy, J. L. Schindler, C. R. Kannewurf, Y. J. Liu, W. Hirpo and M. G. Kanatzidis, Chem. Mater., 1996, 8, 1992–2004 CrossRef CAS; (c) S. K. Young, W. L. Jarrett and K. A. Mauritz, Polymer, 2002, 43, 2311–2320 CrossRef CAS.
- T. Hiemstra, J. C. M. D Wit and W. H. V Riemsdijk, J. Colloid Interface Sci., 1989, 133, 105–117 CrossRef CAS.
- A. Pettersson and J. B. Rosenholm, Langmuir, 2002, 18, 8447–8454 CrossRef CAS.
- K. D. Kreuer, J. Membr. Sci., 2001, 185, 29–39 CrossRef CAS.
- J. Pan, H. Zhang and M. Pan, J. Colloid Interface Sci., 2008, 326, 55–60 CrossRef CAS.
- Y. Shao, G. Yin and Y. Gao, J. Power Sources, 2007, 171, 558–566 CrossRef CAS.
- D. L. Wood, J. Chlistunoff, J. Majewski and R. L. Borup, J. Am. Chem. Soc., 2009, 131, 18096–18104 CrossRef CAS.
- (a) A. Kabasawa, H. Uchida and M. Watanabe, Electrochem. Solid-State Lett., 2008, 11, B190–B192 CrossRef CAS; (b) B. Bae, T. Yoda, K. Miyatake, M. Uchida and M. Watanabe, J. Phys. Chem. B, 2010, 114, 10481–10487 CrossRef CAS; (c) A. Ohma, K. Fushinobu and K. Okazaki, Electrochim. Acta, 2010, 55, 8829–8838 CrossRef CAS.
- T. Kim, S. Lee and H. Park, Renewable Sustainable Energy Rev., 2011, 15, 3676–3689 CrossRef CAS.
- H. L. Tang and M. Pan, J. Phys. Chem. C, 2008, 112, 11556–11568 CAS.
- (a) K. E. Swider and D. R. Rolison, J. Electrochem. Soc., 1996, 143, 813–819 CrossRef CAS; (b) M. L. Anderson, R. M. Stroud and D. R. Rolison, Nano Lett., 2002, 2, 235–240 CrossRef CAS.
Footnotes |
| † Electronic Supplementary Information (ESI) available: XRD patterns, TG traces of MEA-N without Pt/C and MEA-C without Pt/C, photographs of 1 wt% Nafion solutions dissolved in IPA solvent, cell voltage variation as a function of current density and time at 50% RH and schematic diagrams of water transport via polymer membrane. See DOI: 10.1039/c2ra20796f/ |
| ‡ These authors contributed equally to this work. |
| This journal is © The Royal Society of Chemistry 2012 |