3D anatase TiO2 hollow microspheres assembled with high-energy {001} facets for lithium-ion batteries†
Yanlong
Yu
a,
Xiaoliang
Wang
b,
Hongyu
Sun
*c and
Mashkoor
Ahmad
*d
aA Department of Petrochemical, Northeast Petroleum University at Qinhuangdao, Qinhuangdao 066004, P. R. China
bState Key Laboratory of Metastable Materials Science and Technology, Yanshan University, Qinhuangdao 066004, P. R. China
cDepartment of Material Science and Engineering, Tsinghua University, Beijing 100084, China. E-mail: hysun.2008@yahoo.com.cn
dNanomaterials Research Group, Physics Division PINSTECH, P. O. Nilore, Islamabad 44000, Pakistan. E-mail: mashkoorahmad2003@yahoo.com
First published on 2nd August 2012
Abstract
3D anatase TiO2 hollow microspheres assembled with high-energy {001} facets have been synthesized by a one-pot solution method and their lithium storage capacity are investigated. The structural and compositional analysis of the mesoporous TiO2 product has been performed by X-ray diffraction (XRD), scanning electron microscopy (SEM) and high-resolution transmission electron microscopy (HRTEM) along with selected area electron diffraction (SAED). The Bruauer–Emmett–Teller (BET) specific surface area has been calculated by the nitrogen isotherm curve and pore size distribution of TiO2 microspheres has been determined by the Barret–Joyner–Halenda (BJH) method. It has been found that the as-prepared TiO2 electrodes delivered high capacity, good cycling stability and rate capability. The improved electrochemical performance is attributed to the hollow nature and exposed high-energy {001} facets of the 3D assembled structure. Therefore, such a structure can be considered to be an attractive candidate as an electrode material for LIBs.
1. Introduction
Rechargeable lithium-ion batteries (LIBs) are one of the most important energy storage devices for portable electronics and electric vehicles due to their advantages of high energy density, long cycling life and environmental benignity.1–3 It is widely accepted that the overall performance of LIBs is highly dependent on the inherent properties of the electrode materials.4 For nanostructured electrode materials, hollow interiors generally leads to improved energy density, better capacity retention and superior rate capability, which are due to the large surface area, numerous active sites, short mass and charge diffusion distance, and efficient accommodation of volume changes during the charging and discharging process.5Anatase titania (TiO2) is of great importance for both fundamental studies and technological applications in the field of energy storage.6–9 Although anatase TiO2 delivers a lower capacity (∼170 mA h g−1vs. ∼372 mA h g−1 for commercial LIB anodes, graphite) at a higher potential of about 1.7 V vs. Li+/Li, the ease of structural tailoring, the low volume expansion upon cycling, good stability and absence of lithium plating, endow it with great potential to be charged/discharged at high current rates for extended cycling, which can hardly be achieved by other types of anodes.9 The size, shape and assembly of various anatase TiO2 nanostructures have been intensively investigated to optimize the Li-ion storage properties.10–19 It was found that Li-ion insertion was favored on the {001} surface of anatase TiO2, which has a more open structure and short path for lithium ion diffusion along this direction.16–20 It is thus believed that the synthesis of anatase TiO2 exposed with {001} facets is beneficial for improvement the performance of LIBs. Theoretical calculations21 show that the surface energies of {001} and {101} facets of anatase TiO2 are 0.90 and 0.44 J m−2, respectively. Therefore, anatase TiO2 crystals are dominantly bound by thermodynamically stable and less chemically reactive {101} facets. Thus, growth of nano/microanatase TiO2 crystals with exposed high-energy {001} facets is highly challenging. An important breakthrough in preparation of anatase TiO2 single crystals with exposed {001} facets was achieved by Yang et al.22 Following their work, numerous studies have been reported on the synthesis of TiO2 crystals with exposed {001} facets for photocatalytic and lithium-ion batteries applications.23–26 However, most of these anatase TiO2 are crystals with two-dimensional sheetlike structures, which make the sheets easily overlap with each other to reduce the overall surface energy. Preventing the aggregation of these crystals with large amount of exposed {001} facets is a big challenge. One promising way to obtain stable TiO2 sheets is to assemble them into a self-ordered three-dimensional (3D) architecture.27
In this work, we describe a one-pot synthesis of 3D anatase TiO2 hollow microspheres with exposed high-energy {001} facets. The excellent lithium-storage properties of the as-prepared TiO2 products have been demonstrated.
2. Experimental section
2.1 Materials synthesis
All the chemicals are of analytical grade and used as received without further purification. Deionized water was used throughout and Ti powder was used as titanium source. In a typical synthesis, 20 mg of Ti powder was dispersed into a solution containing 27 ml of H2O, 3 ml of H2O2 (30%, A.R.) and 0.1 ml of hydrofluoric acid (40 wt%) by ultrasonicaiton for 10 min giving a transparent yellow solution. The reaction solution was then transferred to a 50 mL Teflon-lined stainless steel autoclave and kept in an electric oven at 180 °C for 12 h. The autoclave was then taken out from the oven and left to cool down to room temperature. The white precipitate obtained was washed thoroughly with distilled water and ethanol three times and then dried at 80 °C for 12 h.2.2 Materials characterization
The product morphology and crystal structure was examined using field-emission scanning electron microscopy (FESEM; Hitachi, S4800, 5 kV), transmission electron microscopy (TEM; JEOL, JEM-2011, 200 kV; FEI, Tecnai G20, 200 kV) and high-resolution TEM (HRTEM, FEI, Titan 80–300, 300 kV). Crystallographic information for the samples was collected using a Bruker Model D8 Advance X-ray powder diffractometer (XRD) Cu-Kα irradiation (λ = 1.5418 Å). The Barret–Joyner–Halender (BET) surface area of the powders was analyzed by nitrogen adsorption–desorption isotherm measurement at 77 K in a Micromeritics ASAP 2010 system. The sample was degassed at 180 °C before nitrogen adsorption measurements. The BET surface area was determined by a multipoint BET method. A desorption isotherm was used to determine the pore size distribution via the Barret–Joyner–Halender (BJH) method, assuming a cylindrical pore model. The nitrogen adsorption volume at the relative pressure (P/P0) of 0.994 was used to determine the pore volume and average pore size.2.3 Assembly of electrochemical cells
To measure the electrochemical performance, composite electrodes were constructed by mixing the active materials, conductive carbon black and polyvinylidene fluoride (PVDF), in a weight ratio of 70![[thin space (1/6-em)]](https://www.rsc.org/images/entities/char_2009.gif) :
:![[thin space (1/6-em)]](https://www.rsc.org/images/entities/char_2009.gif) 20
20![[thin space (1/6-em)]](https://www.rsc.org/images/entities/char_2009.gif) :
:![[thin space (1/6-em)]](https://www.rsc.org/images/entities/char_2009.gif) 10. The mixture was prepared as a slurry in N-methylpyrrolidinone and spread onto copper foil by using the doctor-blade technique. The electrode was dried under vacuum at 120 °C for 5 h to remove the solvent before pressing. Then the electrodes were cut into disks (12 mm in diameter) and dried at 100 °C for 24 h in vacuum. The cells were assembled inside an Ar-filled glove box by using a lithium-metal foil as the counter electrode and the reference electrode and microporous polypropylene as the separator. The electrolyte used was 1 M LiPF6 in ethylene carbonate (EC)–dimethyl carbonate (DMC) solvent (1
10. The mixture was prepared as a slurry in N-methylpyrrolidinone and spread onto copper foil by using the doctor-blade technique. The electrode was dried under vacuum at 120 °C for 5 h to remove the solvent before pressing. Then the electrodes were cut into disks (12 mm in diameter) and dried at 100 °C for 24 h in vacuum. The cells were assembled inside an Ar-filled glove box by using a lithium-metal foil as the counter electrode and the reference electrode and microporous polypropylene as the separator. The electrolyte used was 1 M LiPF6 in ethylene carbonate (EC)–dimethyl carbonate (DMC) solvent (1![[thin space (1/6-em)]](https://www.rsc.org/images/entities/char_2009.gif) :
:![[thin space (1/6-em)]](https://www.rsc.org/images/entities/char_2009.gif) 1 w/w). Assembled cells were allowed to soak overnight, and then electrochemical tests on a LAND battery testing unit were performed. Galvanostatic charge and discharge of the assembled cells were performed at different current rates (1 C = 170 mA g−1) between voltage limits of 1 and 3 V (vs. Li) at room temperature.
1 w/w). Assembled cells were allowed to soak overnight, and then electrochemical tests on a LAND battery testing unit were performed. Galvanostatic charge and discharge of the assembled cells were performed at different current rates (1 C = 170 mA g−1) between voltage limits of 1 and 3 V (vs. Li) at room temperature.
3. Results and discussion
3.1 Structure, morphology and BET surface area
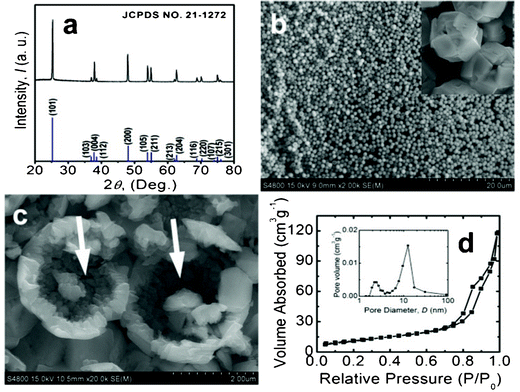
The crystal structure of the resulting product was confirmed by XRD as shown in Fig. 1a. All of the identified peaks can be perfectly indexed to anatase TiO2 (JCPDS No. 21-1272), and no peaks of impurities are observed, indicating the phase-pure nature of the product. Moreover, the relatively high peak intensities imply that the products are highly crystalline. The relative ratio of the (004) peak intensity to that of the (101) peak of anatase TiO2 is ca. 30%, which is larger than that of the standard pattern (20%), implying the oriented growth of the sample along the (001) direction. This is further confirmed by HRTEM characterization as discussed later. | ||
| Fig. 1 (a) XRD pattern and (b and inset) FESEM images of as-synthesized 3D anatase TiO2 microspheres. (c) High-magnification FESEM image of broken microspheres, demonstrating the hollow nature. (d and inset) Nitrogen adsorption–desorption isotherms and corresponding pore size distribution curves of the sample. | ||
Fig. 1b shows the low-magnification FESEM image of the product which consists of hollow TiO2 microspheres uniformly distributed on the substrate. The average diameter of the microsphere is ∼1 μm. The high-magnification image of the particles is shown in the inset of Fig. 1b, and it is interesting to find that the surfaces of these microspheres are covered by many square-shaped crystalline facets. The FESEM image of broken microspheres reveals the hollow nature of these microspheres (indicated by white arrows in Fig. 1c). The contrast between the edge and center further confirms the hollow interior. Furthermore, it can be seen that the interior of the hollow spheres is not as flat as the exposed exterior surface, thus, it can be determined that the interior surface is not constituted by high-energy {001} facets. Nitrogen adsorption–desorption isotherms were measured to determine the specific surface areas and pore size distribution of the TiO2 hollow microspheres with exposed {001} facets (Fig. 1d). The BET specific surface area of the product is ca. 43.3 m2 g−1 which is slightly smaller than that of P25 (55.1 m2 g−1).28 The isotherm corresponding to the product is of type IV with two capillary condensation steps, implying bimodal pore size distributions in the mesoporous and macroporous regions.29 The pore size distributions are calculated from the desorption branch of the nitrogen isotherm by the BJH method. The bimodal mesopore size distribution is further confirmed by the corresponding pore size distributions (inset in Fig. 1d).
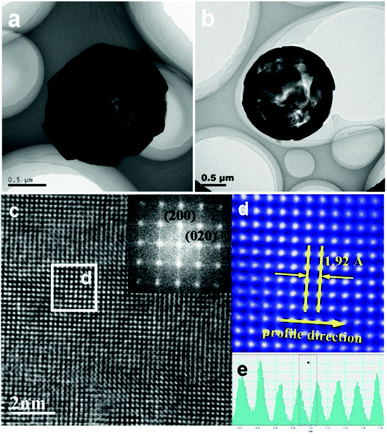
Two typical TEM images of a single TiO2 microsphere are displayed in Fig. 2a and b. The contrast between the dark edge and pale center further confirms the hollow interior and surrounding crystalline shell, which is in good agreement with the FESEM observations and BET surface analysis. More detailed structural information of the TiO2 microsphere is obtained by aberration-corrected TEM, which was operated at 300 kV with spherical aberration close to zero with near Gaussian focus being used. The HRTEM image of an individual TiO2 plate from the microsphere shows perpendicular lattice spacing of 0.192 nm representing the (200) and (020) atomic planes of the anatase TiO2 (Fig. 2c). The corresponding fast-Fourier transform (FFT) pattern (inset in Fig. 2c) confirms the single-crystal nature of a square-shaped crystallite with the zone axis being [001]. A corresponding FFT-filtered TEM image of the tetragonal atomic arrangement on the (001) surface is shown in Fig. 2d, which is similar with Yang's report.22 The line profile through the direction shown in Fig. 2d further demonstrates the exposed surfaces are high-energy {001} facets (Fig. 2e). The above results reveal that 3D anatase TiO2 hollow microspheres assembled with high-energy {001} facets have been successfully synthesized by a facile one-pot method, which is anticipated to show good lithium-storage properties.
 | ||
| Fig. 2 (a, b) TEM images and (c) HRTEM image of TiO2 microspheres (inset: corresponding FFT pattern). (d) FFT-filtered TEM image recorded from the area indicated by white box in (c). (e) Intensity plot of profile along the direction indicated by the yellow arrow in (d). | ||
3.2 Formation of TiO2 hollow microspheres
The formation process and formation mechanism of the TiO2 hollow microspheres have been investigated in our recent work.30 The formation mechanism of the hollow TiO2 structures was investigated by time-dependent evolution experiments.Briefly, HF reacts with metallic Ti at the first stage, leading to the formation of titanium fluoride complexes, then the Ti4+ reacts with H2O2 to form yellow peroxotitanium acid, Ti2O5(OH)x(x−2)− (x = 1–6). Under solvothermal conditions, the water in the reaction promoted the hydrolysis of peroxotitanium acid to form anatase TiO2 particles. These particles quickly aggregated to form solid spheres because of their high surface energy. With time hollow spheres were formed via Ostwald ripening. During the transformation to the hollow spheres, the inner part of the solid spheres gradually dissolved and was recrystallized on the shell of the spheres to finally form hollow spheres. Meanwhile, the surface fluorination via dissociative adsorption of HF makes the [001] direction a preferential crystal growth direction due to the reduced {001} facet surface energy. This leads to the formation of TiO2 microspheres having protrusive square-shaped surface structures with exposed plane {001} facets. Finally, the oriented plates further increased in thickness by consuming the central part of the spheres.
3.3 Electrochemical measurements
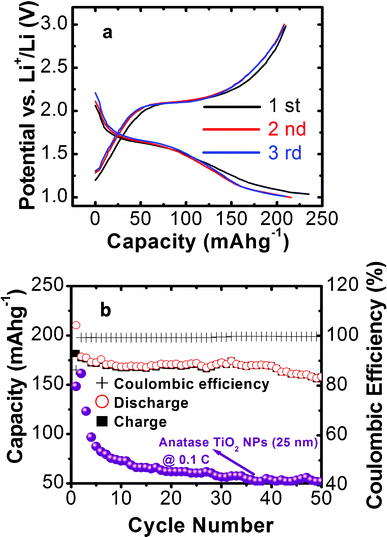
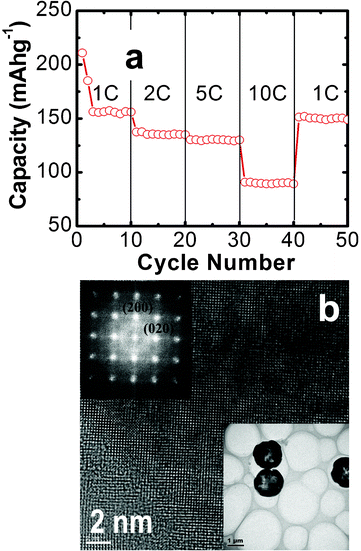
The electrochemical properties of the as prepared sample as the anode material for lithium-ion batteries are investigated. Fig. 3a shows the charge–discharge voltage profiles for the first three cycles at a current rate of 1C (170 mA h g−1). Two dominant voltage plateaus appear at ∼1.65 and ∼2.10 V during the discharge and charge processes, which correspond to the lithium insertion and deinsertion, respectively. This is in good agreement with previous reports.16–18,31 The first discharge capacity is 235 mA h g−1 and the charge capacity is 208 mA h g−1, yielding an irreversible capacity loss of 11.5%. Such a low initial irreversible capacity loss might be attributed to the exposed high-energy {001} facets. The subsequent Coulombic efficiency (the ratio of charge capacity to discharge capacity) quickly increases to 96.2% and 99% in the second and third cycles, respectively, which is mainly due to that the trapping of Li+ ions inside the TiO2 structure decreases rapidly upon the following cycles.9Fig. 3b shows the charge/discharge capacity and Coulombic efficiency vs. cycle numbers between 1 and 3 V at a constant current density of 1C. It can be seen that the as-prepared material shows good cyclic capacity retention during cycling. A reversible capacity of 157 mA h g−1 can be retained after 50 cycles with about 75% retention as compared with the first reversible capacity. The Coulombic efficiency reached 99% at the second cycle and remained steady thereafter. The charge–discharge capacity of the TiO2 hollow microspheres electrode was also compared with reported anatase TiO2 nanoparticles (25 nm in diameter),23 as shown in Fig. 3b. The experimental conditions for TiO2 NPs are similar to our case except that they were cycled with a low current rate of 0.1 C. It can be seen that the first discharge capacity of the anatase nanoparticles reaches 151 mA h g−1 but further cycling leads to a drastic capacity decay to 57 mA h g−1 after 50 cycles. The compared results further confirm the superior lithium storage performance of our sample. The rate capability is an important parameter for the applications of LIBs in the fields of electric vehicles and portable power tools. Fig. 4a shows the cycling performance of the anatase TiO2 hollow microspheres electrode at various current rates. It can be found that after the first 10 cycles at the rate of 1 C, the discharge capacity reaches about 156 mA h g−1, and then it slightly reduces to 135 and 130 mA h g−1 at rates of 2 and 5 C, respectively. Even for a rate as high as 10 C, the electrode can deliver a reversible capacity of 90 mA h g−1. More interestingly, when the current rate is returned to the initial value of 1 C, the electrode resumes its original capacity of about 150 mA h g−1 after 10 cycles, indicating that the anatase TiO2 hollow microspheres assembled with high-energy {001} facets possess good cycling stability. The performance of LIBs is similar with the reported values by Lou et al. under the same testing conditions.16 The bottom inset in Fig. 4b shows the TEM image of the anatase TiO2 hollow microspheres electrode after rate capability testing (50 cycles). The cycled sample still maintains the morphology with 3D hollow microspheres, which is constituted by square-shaped crystalline facets. It can be seen that the sample still maintains the initial intact spherical morphology after cycling testing except for a small fraction of incomplete hollow spheres (Fig. S1, ESI†). HRTEM and corresponding FFT patterns demonstrate that the exposed square-shaped facets are high-energy {001} surfaces of anatase TiO2 (Fig. 4b and top inset). The results reveal the good structural and morphological stabilities of anatase TiO2 hollow microspheres during charge/discharge cycling. | ||
| Fig. 3 (a) Charge/discharge curves of the first three cycles of the TiO2 electrodes at a charge/discharge rate of 1 C. (b) The cycling performance and corresponding Coulombic efficiency of the TiO2 electrodes at a charge/discharge rate of 1 C and cycling performance of reported anatase TiO2 nanoparticles at a rate of 0.1 C for comparison.27 | ||
 | ||
| Fig. 4 (a) Cycling performance of the TiO2 electrodes at various current rates. (b) HRTEM image of the TiO2 electrodes after rate capability testing (50 cycles). The top and bottom insets in (b) show the corresponding FFT pattern and TEM image, respectively. | ||
The high capacity and good rate capability and cycling stability can be attributed to the following reasons. (1) The hollow nature of the product. Firstly, the interior of TiO2 hollow microspheres can provide extra active sites for the storage of lithium ions, which is beneficial for enhancing the specific capacity. Secondly, the hollow structures can accommodate the local volume change upon charge/discharge cycling and is able to alleviate the problem of pulverization and aggregation of the electrode material, hence improving the cycling performance. Moreover, the hollow structure can reduce the effective diffusion distance for lithium ions and electrons, resulting in good rate capabilities. (2) Exposed high-energy {001} facets. Anatase TiO2 crystals with exposed {001} facets exhibit an enhanced Li-ion insertion/extraction kinetics, including better reversibility and excellent rate capabilities. (3) 3D assembled structure. The 3D hierarchical architecture assembled with high-energy facets is favored for preventing the aggregation of these nano/microcrystals, which is of importance for the cycling stability.
4. Conclusions
In conclusion, 3D anatase TiO2 hollow microspheres assembled with high-energy {001} facets were successfully synthesized by a one-pot solution method. When used as the anode materials of Li-ion batteries, the as-prepared TiO2 sample delivered high capacity, good cycling stability and rate capability. It is believed that the excellent electrochemical performance can be attributed to the hollow nature and exposed high-energy {001} facets of the 3D assembled electrode structure.Acknowledgements
This work is financially supported by China Postdoctoral Science Foundation (20110490024).References
- F. Y. Cheng, J. Liang, Z. L. Tao and J. Chen, Adv. Mater., 2011, 23, 1695 CrossRef CAS.
- C. Liu, F. Li, L. P. Ma and H. M. Cheng, Adv. Mater., 2010, 22, E28 CrossRef CAS.
- M. Winter and R. J. Brodd, Chem. Rev., 2004, 104, 4245 CrossRef CAS.
- M. K. Song, S. Park, F. M. Alamgir, J. Cho and M. L. Liu, Mater. Sci. Eng., R, 2011, 72, 203 CrossRef.
- Z. Y. Wang, L. Zhou and X. W. Lou, Adv. Mater., 2012, 24, 1903 CrossRef CAS.
- M. Wagemaker, A. P. M. Kentgens and F. M. Mulder, Nature, 2002, 418, 397 CrossRef CAS.
- A. V. Subramanian, A. Karki, K. I. Gnanasekar, F. P. Eddy and B. Rambabu, J. Power Sources, 2006, 159, 186 CrossRef.
- X. W. Lou and L. A. Archer, Adv. Mater., 2008, 20, 1853 CrossRef CAS.
- H. B. Wu, J. S. Chen, H. H. Hng and X. W. Lou, Nanoscale, 2012, 4, 2526 RSC.
- H. B. Wu, J. S. Chen, X. W. Lou and H. H. Hng, Nanoscale, 2011, 3, 4082 RSC.
- J. Wang, Y. K. Zhou, Y. Y. Hu, R. Hayre and Z. P. Shao, J. Phys. Chem. C, 2011, 115, 2529 CAS.
- J. F. Ye, W. Liu, J. G. Cai, S. Chen, X. W. Zhao, H. H. Zhou and L. M. Qi, J. Am. Chem. Soc., 2011, 133, 933 CrossRef CAS.
- Y. Wang, X. W. Su and S. Lu, J. Mater. Chem., 2012, 22, 1969 RSC.
- Z. X. Yang, G. D. Du, Q. Meng, Z. P. Guo, X. B. Yu, Z. X. Chen, T. L. Guo and R. Zeng, J. Mater. Chem., 2012, 22, 5848 RSC.
- S. Myung, N. Takahashi, S. Komaba, C. S. Yoon, Y. Sun, K. Amine and H. Yashiro, Adv. Funct. Mater., 2011, 21, 3231–3241 CrossRef CAS.
- S. J. Ding, J. S. Chen, Z. Y. Wang, Y. L. Cheah, S. Madhavi, X. Hu and X. W. Lou, J. Mater. Chem., 2011, 21, 1677 RSC.
- J. S. Chen, Y. L. Tan, C. M. Li, Y. L. Cheah, D. Luan, S. Madhavi, F. Y. C. Boey, L. A. Archer and X. W. Lou, J. Am. Chem. Soc., 2010, 132, 6124 CrossRef CAS.
- J. H. Liu, J. S. Chen, X. F. Wei, X. W. Lou and X. W. Liu, Adv. Mater., 2011, 23, 998 CrossRef CAS.
- C. H. Sun, X. H. Yang, J. S. Chen, Z. Li, X. W. Lou, C. Z. Li, S. C. Smith, G. Q. Lu and H. G. Yang, Chem. Commun., 2010, 46, 6129 RSC.
- S. W. Liu, J. G. Yu and M. Jaroniec, Chem. Mater., 2011, 23, 4085 CAS.
- U. Diebold, Surf. Sci. Rep., 2003, 48, 53–229 CrossRef CAS.
- H. G. Yang, C. H. Sun, S. Z. Qiao, J. Zou, G. Liu, S. C. Smith, H. M. Cheng and G. Q. Lu, Nature, 2008, 453, 638 CrossRef CAS.
- S. W. Liu, J. G. Yu and M. Jaroniec, J. Am. Chem. Soc., 2010, 132, 11914 CrossRef CAS.
- Q. J. Xiang, J. G. Yu and M. Jaroniec, Chem. Commun., 2011, 47, 4532–4534 RSC.
- K. L. Lv, B. Cheng, J. G. Yu and G. Liu, Phys. Chem. Chem. Phys., 2012, 14, 5349 RSC.
- Q. J. Xiang and J. G. Yu, Chin. J. Catal., 2011, 32, 525–531 CrossRef CAS.
- Z. Q. Sun, J. H. Kim, Y. Zhao, F. Bijarbooneh, V. Malgras, Y. Lee, Y. Kang and S. X. Dou, J. Am. Chem. Soc., 2011, 133, 19314 CrossRef CAS.
- J. G. Yu, Q. J. Xiang, J. R. Ran and S. Mann, CrystEngComm, 2010, 12, 872 RSC.
- K. S. W. Sing, D. H. Everett, R. A. W. Haul, L. Moscou, R. A. Pierotti, J. Rouquerol and T. Siemieniewska, Pure Appl. Chem., 1985, 57, 603 CrossRef CAS.
- X. Wang, H. He, Y. Chen, J. Zhao and X. Zhang, Appl. Surf. Sci., 2012, 258, 5863 CrossRef CAS.
- H. Ogihara, M. Sadakane, Y. Nodasaka and W. Ueda, Chem. Mater., 2006, 18, 4981 CrossRef CAS.
Footnote |
| † Electronic supplementary information (ESI) available. See DOI: 10.1039/c2ra20718d/ |
| This journal is © The Royal Society of Chemistry 2012 |
