Characterization study on the promoting effect of F-doping V2O5/TiO2 SCR catalysts
Wei
Zhao
,
Qin
Zhong
*,
Tianjiao
Zhang
and
Yanxiao
Pan
School of Chemical Engineering, Nanjing University of Science and Technology, Nanjing, 210094, PR China. E-mail: zq304@mail.njust.edu.cn; Fax: +86 025 8431 5517; Tel: +86 025 8431 5517
First published on 3rd July 2012
Abstract
V2O5/TiO2 catalysts were prepared in the presence of (NH4)2TiF6 with controlled fluorine to titanium molar ratios (RF/Ti × 100) (0, 0.5, 1, 1.35 and 2) for selective catalytic reduction of nitrogen oxides (NOx) by NH3 (SCR process). It was found that the NOx conversion over F-doping V2O5/TiO2 was greatly improved compared with pure V2O5/TiO2. The effects of F-doping on the structure of the catalysts were systematically examined using XRD, Raman spectrum, BET, TEM, H2-TPR,NO-TPD, XPS and EPR. The XPS results showed that F ions were incorporated into the TiO2 lattice. The high catalytic activity was ascribed to several beneficial effects produced by F-doping – preventing of grain growth, inhibiting of phase transformation from anatase to rutile, higher reducibility of good dispersion of vanadia species, creation of oxygen vacancies, and increasing active sites. It was interesting to point out that the better catalytic activity of F-doped V2O5/TiO2 was achieved by the creation of surface oxygen vacancies.
1. Introduction
In recent years, nitrogen oxides emissions from coal-fired power plants and industrial boilers have been taken into consideration. This is because they can result in acid rain, low visibility, photochemical smog and fine particulates, and in particular, are a health hazard to the human body.1 Therefore, several measures to reduce nitrogen oxides emissions have been reported. Among them, selective catalytic reduction (SCR) has been shown as an effective post-treatment process to eliminate nitrogen oxides. One of the major issues of this technology is to achieve high conversion of nitric oxide and high activity of the catalyst. The titania-supporting vanadia (V2O5/TiO2) catalyst is commercially the most widely used material among heterogeneous catalysts for NH3-SCR of nitrogen oxides in flue gases from stationary sources due to high selectivity. Nevertheless, the operating temperature of the V2O5/TiO2 catalyst used in the SCR process was typically high at 573–673 K.2 Due to this high reaction temperature, the catalyst must be moved upstream of the desulfurizer to avoid reheating of the flue gas. Another limitation is that sulfur dioxide and dust will make the catalyst deactivate. Thus, the development of a low-temperature SCR catalyst working below 573 K has attracted great attention in the past few decades. The SCR reactor with this type of catalyst can be located downstream of desulfurization, where the contents of sulfur dioxide and dust are weakened. So, extensive efforts have been made to improve the activity of the V2O5/TiO2 catalyst at low temperatures.Vanadia has been used as the active element in the reduction of nitrogen oxides of the SCR reaction for some time. However, during its industrial applications, several issues have arisen, such as a narrow active temperature window, toxicity to the environment and human health due to the loss of vanadium during preparation and operation processes,3 and the high loading V-based catalyst could oxidize SO2 to SO3.4 SO3 would further react with H2O and NH3 to form NH4HSO4, (NH4)2S2O7 and H2SO4, which could corrode downstream equipment and plug the catalyst pore stucture.5 Considering these disadvantages, in this work, the amount of V2O5 is generally very small (1 wt%), in order to limit the oxidation of SO2 to SO3 as much as possible in industrial practice.
The performance of the catalyst for certain technical applications can be influenced by its preparation methods, chemical composition, treating temperature, crystallite size, surface area, phase structure, and doping type and concentration.6 Doping methods have become an area of growing interest since they can enhance the selectivity or activity of catalysts. Kim et al.7 reported the high DeNOx activity of an Fe-doped Mn/TiO2 catalyst prepared by a sol–gel method, including a higher reactor space velocity and wider operating temperature window. At 523 K, 90% of the NO conversion was achieved under a (gas hourly space velocity) GHSV of 100![[thin space (1/6-em)]](https://www.rsc.org/images/entities/char_2009.gif) 000 h−1. Li et al.8 prepared a superior catalyst by adding carbon nanotubes to V2O5/TiO2 used for NOx reduction with NH3, where the NOx conversion was 89% at 573 K under a GHSV of 22
000 h−1. Li et al.8 prepared a superior catalyst by adding carbon nanotubes to V2O5/TiO2 used for NOx reduction with NH3, where the NOx conversion was 89% at 573 K under a GHSV of 22![[thin space (1/6-em)]](https://www.rsc.org/images/entities/char_2009.gif) 500 h−1. Shen et al.9 developed an Fe-doped Mn–Ce/TiO2 catalyst which had high activity at 353–533 K and enhanced its resistance to H2O and SO2. Wu et al.10 found that MnOx/TiO2 catalysts yielded more than 90% NOx conversion at a temperature of 423 K, which is under the optimal operating conditions. The Fe–Ti based catalysts were prepared and showed good SCR activity in the medium temperature range with remarkable H2O and SO2 durability, such as Fe/TiO2 and Mn–Fe/TiO2.11 Xu et al.12 developed Ce–TiO2 and found that the catalyst had high activity in the range of 548–673 K at a space velocity of 50
500 h−1. Shen et al.9 developed an Fe-doped Mn–Ce/TiO2 catalyst which had high activity at 353–533 K and enhanced its resistance to H2O and SO2. Wu et al.10 found that MnOx/TiO2 catalysts yielded more than 90% NOx conversion at a temperature of 423 K, which is under the optimal operating conditions. The Fe–Ti based catalysts were prepared and showed good SCR activity in the medium temperature range with remarkable H2O and SO2 durability, such as Fe/TiO2 and Mn–Fe/TiO2.11 Xu et al.12 developed Ce–TiO2 and found that the catalyst had high activity in the range of 548–673 K at a space velocity of 50![[thin space (1/6-em)]](https://www.rsc.org/images/entities/char_2009.gif) 000 h−1. Shan et al.13 found that the addition of Ce could enhance the activity of the Ce–TiO2 catalyst, where the catalyst presented over 90% NOx conversion in a broad temperature range from 548 to 673 K under a GHSV of 500
000 h−1. Shan et al.13 found that the addition of Ce could enhance the activity of the Ce–TiO2 catalyst, where the catalyst presented over 90% NOx conversion in a broad temperature range from 548 to 673 K under a GHSV of 500![[thin space (1/6-em)]](https://www.rsc.org/images/entities/char_2009.gif) 000 h−1.
000 h−1.
Nevertheless, a substantial amount of research on non-metal doping catalysts which can be applied in the SCR reaction has not been made. In our previous study,14 it was found that the F-doped V2O5/TiO2 had a higher catalytic activity than undoped V2O5/TiO2, for removing NO at low temperatures. This work follows up our preliminary findings and provides a detailed investigation of the effects of fluorine introduction on the intrinsic characteristics of V2O5/TiO2, and the changes caused by these effects in relation to the catalytic performance. The mechanisms of the F-doping effect on the high catalytic performance of the catalysts were proposed based on the results obtained by EPR.
2. Experimental
2.1 Catalysts preparation
The titanium dioxide support was prepared by a sol–gel method. Under continuous stirring, 0.064 mol of tetrabutyl titanate (C16H36O4Ti) was added to 0.128 mol of acetylacetone (C5H8O2). Then the solution was diluted with ammonium fluotitatanate ((NH4)2TiF6) ethanol solution (50 mL). Pure catalysts were prepared without addition of (NH4)2TiF6. After vigorous stirring for 2 h at room temperature the solution was heated at 333 K in a water bath for 4 h and dried at 393 K for 6 h. Then the dried material was calcined for 3 h at 773 K. A requisite amount of NH4VO3 was dissolved in distilled water at about 323–333 K, and the pH of the solution was adjusted to 1.0 by the addition of nitric acid solution and was impregnated by contacting with the titanium dioxide support. The mixture was heated to 333 K in a water bath and refluxed for 4 h. Then the mixture was dried at 393 K for 6 h and calcined at 623 K for 4 h. The catalysts contained 1 wt% vanadium. In this work, (NH4)2TiF6 is used as the fluorine source because it obtained the best activity compared with NH4F and HF (results not shown here). The sample is denoted as VTiFX where X represents the calculated initial molar ratio of F to Ti (RF/Ti × 100). In this way, five different samples were prepared, i.e., X = 0, 0.5, 1, 1.35 and 2, which are denoted as VTiF0, VTiF0.5, VTiF1, VTiF1.35, VTiF2, respectively.152.2 Catalyst activity tests
Catalyst activity measurements were operated in a fixed-bed flow reactor at 393–513 K containing 0.3 g catalyst with a gas hourly space velocity (GHSV) of 41![[thin space (1/6-em)]](https://www.rsc.org/images/entities/char_2009.gif) 324 h−1. The total gas flow rate was 150 mL min−1. Four gas streams, 0.05% NO, 0.05% NH3, 5% O2 and N2, as the balance gas were used to simulate the flue gas. The reactants were mixed and pre-heated in a gas mixer before entering the reactor. The catalytic activities for NO oxidation to NO2 were also measured. The SCR activity of the catalysts for NO removal was monitored by a Flue Gas Analyzer (Vario Plus, German MRU Ltd.).
324 h−1. The total gas flow rate was 150 mL min−1. Four gas streams, 0.05% NO, 0.05% NH3, 5% O2 and N2, as the balance gas were used to simulate the flue gas. The reactants were mixed and pre-heated in a gas mixer before entering the reactor. The catalytic activities for NO oxidation to NO2 were also measured. The SCR activity of the catalysts for NO removal was monitored by a Flue Gas Analyzer (Vario Plus, German MRU Ltd.).
2.3 Catalytic characterization
X-Ray diffraction (XRD) patterns of all samples were recorded on a XD-3 diffractometer with Cu-Kα radiation (λ = 0.15418 nm) (Beijing Purkinje General Instrument Co., Ltd, China).Raman spectra were recorded on a Renishaw Invia Raman Microscope with Ar+ radiation (514 nm). The laser light was focused onto the samples by using a microscope equipped with a ×100 objective lens.
The surface properties consisting of the specific surface area, total pore volume (VP) and mean pore radius (r) were determined by N2 adsorption at 77 K by the Brunauer–Emmett–Teller (BET) method in a V-Sorb 2800 series. The samples were pretreated at 473 K for 5 h. The BET surface area was measured using the multipoint BET method. The pore size distribution was determined by the Barret–Joyner–Halender (BJH) method.
The micromorphology of the catalysts were examined on a JEM-2100 transmission electron microscope (TEM), the samples was deposited on a copper mesh by means of dipcoating.
Temperature-programmed reduction (TPR) was carried out on automated chemisorption analyzer (Quantachrome Instruments). About 200 mg of sample was used. The H2–N2 mixer (10% H2 by volume) was switched on at a flowing rate of 70 mL min−1 and the temperature was increased linearly at a rate of 20 K min−1. The consumption of H2 was detected by a thermal conductivity detector (TCD).
Temperature-programmed desorption of NO (NO-TPD) was carried out on an automated chemisorption analyzer (Quantachrome Instruments). About 400 mg sample was used. The NO–He mixer was switched on at a flowing rate of 60 mL min−1 and the temperature was increased linearly at a rate of 15 K min−1. The desorption amount of NO in N2 was detected by a TCD.
The X-ray photoelectron spectroscopy (XPS) measurements were carried out using a PHI Quantera II (ULVAC-PHI, Japan) XPS System with monochromatic Al-Kα excitation. All the bonding energies were calibrated to the C1s peak at 284.8 eV of the surface adventitious carbon.
Electron paramagnetic resonance (EPR) spectra were recorded on a Bruker EMX-10/12 X-band (∼9.7 GHz) spectrometer at ambient temperature.
3. Results and discussion
3.1 Catalytic activity
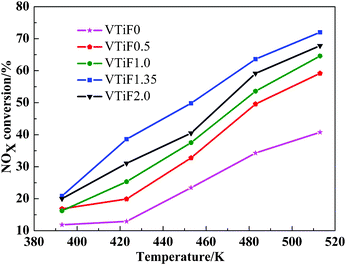
![[thin space (1/6-em)]](https://www.rsc.org/images/entities/char_2009.gif) 324 h−1. Based on the results shown in Fig. 1, it should be noted that the performance of the catalysts could be improved by F-doping. The best catalytic activity was achieved with VTiF1.35 over the whole temperature range. So we can conclude that F-doping has a positive effect on the activity of the V2O5/TiO2 catalyst for low temperature SCR of NOx with NH3. The N2O concentration was lower than 3 ppm for samples in our experiment that were analyzed by the GHX-510 IR gas analyzer (China), which shows that the selectivities to N2 of the catalysts were very high.
324 h−1. Based on the results shown in Fig. 1, it should be noted that the performance of the catalysts could be improved by F-doping. The best catalytic activity was achieved with VTiF1.35 over the whole temperature range. So we can conclude that F-doping has a positive effect on the activity of the V2O5/TiO2 catalyst for low temperature SCR of NOx with NH3. The N2O concentration was lower than 3 ppm for samples in our experiment that were analyzed by the GHX-510 IR gas analyzer (China), which shows that the selectivities to N2 of the catalysts were very high.
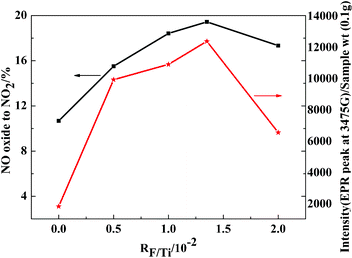 | ||
| Fig. 2 NO oxidation activity (■) (the total flow rate was 100 mL min−1; 0.05% NO, 5% O2 with N2 as the balance gas, GHSV = 15557 h−1) and EPR intensity (★) of the 3475 G band (superoxide radical) as a function of F-doping. | ||
During preparation of the metal oxide, the lattice transport activity at the metal oxides is quenched, however, the electronic transitions may be activated. The physically adsorbed species (molecules and/or atoms) become ionized, leading to the formation of several chemisorbed species, such as O− and O2−.17 Catalytic and photocatalytic properties of these oxides are closely related to the concentration of these species. 17 Therefore, the concentration of these species toward different fluorine dopant contents (RF/Ti) in these catalysts was studied. As shown in Fig. 2, the amounts of superoxide radicals (O2−) increased with increasing RF/Ti. When RF/Ti = 1.35, the amount of O2− was at a maximum. This change tendency agreed with the change in the activity of the samples. In this situation, NO and active oxygen were more likely to form NO2 and cause a positive effect on the catalytic activity.
3.2 Effect of F-doping on the phase formation (XRD and Raman)
The maximum activity of the F-doped catalysts was observed when their supports were calcined at 773 K (results not shown here). Fig. 3 shows the XRD patterns of the catalysts with different F-doped contents when the calcination temperature was 773 K. For all catalysts, only TiO2 was detected. No other phases, except anatase and rutile, were identified in these samples. However, no diffraction peaks of V2O5 were detected, which may be due to the low V2O5 content or good dispersion. Typical diffraction peaks, as attributive indicators of TiO2 anatase phase, were 2θ = 25.2°,38.0°, 48.1°, 54.5°, 62.8°, 70.3° and 75.3°, and for the rutile phase were 2θ = 27.4°,36.0° and 41.2°. From Fig. 3, it was shown that the mixed phases of anatase and rutile coexist in pure V2O5/TiO2. For the F-doped catalysts, no diffraction peaks of the rutile phase were observed, indicating that F-doping inhibited the appearance of the rutile phase in the XRD pattern. Although the ionic radius of F− (0.136 nm) was close to that of O2− (0.140 nm), the substitution of the former for the latter in the unit cell caused lattice distortion and accumulated energy, consequently inhibiting the anatase–rutile phase transition.22 The intensity of all peaks corresponding to the anatase phase became weak with the increase in fluorine content. This revealed that some interactions exist between F and TiO2, such as the possible F− anion being doped into the anatase structure.
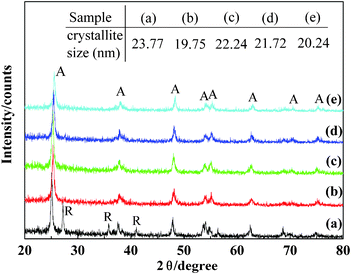 | ||
| Fig. 3 XRD patterns of the catalysts prepared with different F-doping concentrations. VTiF0 (line a),VTiF0.5 (line b),VTiF1 (line c),VTiF1.35 (line d),VTiF2 (line e); A: anatase; R: rutile. | ||
Moreover, the average crystallite sizes of the catalysts were calculated using the Scherer's formula, eqn (1),
 | (1) |
Where D is the average crystallite size; K is a constant; λ is the wavelength of the X-ray radiation (Cu-Kα = 0.1541 nm); β is the full width at half-maximum (FWHM) of the diffraction peak; θ is the diffraction angle. After correction, the formula is as shown in eqn (2):
 | (2) |
The average crystallite sizes of the catalysts are listed in Fig. 3. It can be seen that the crystallite sizes of the catalysts decreased with increasing fluorine content, because doping F ions into the TiO2 crystal lattice might be beneficial for inhibiting the growth of TiO2 nanoparticles.
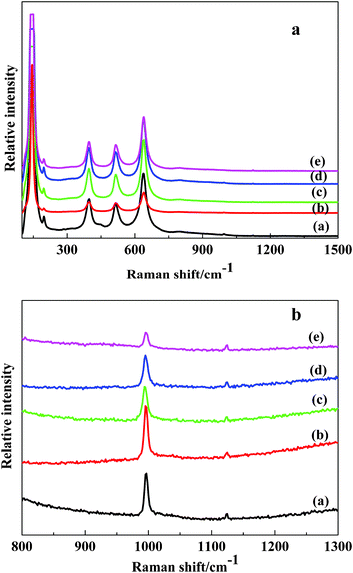 | ||
| Fig. 4 Raman spectra in the range 100–1500 cm-1 (a) and 800–1300 cm-1 (b) collected on VTiF0 (line a), VTiF0.5 (line b), VTiF1 (line c), VTiF1.35 (line d), VTiF2 (line e). | ||
From Fig. 4b, the peak at 995 cm−1 was assigned to the symmetrical stretching vibrations of the extreme oxygen atoms, υ(V5+![[double bond, length as m-dash]](https://www.rsc.org/images/entities/char_e001.gif) O). The presence of this peak suggested that vanadia was dispersed as an isolate VOx species on the support with low V2O5 loadings.26
O). The presence of this peak suggested that vanadia was dispersed as an isolate VOx species on the support with low V2O5 loadings.26
It was noteworthy, that oxygen vacancies could be formed on the surface of the catalysts, as evidenced by the band (1123 cm−1) shown in Fig. 4b, which is assigned to superoxides.27
3.3 BET surface area measurements
Some studies discovered that improving the texture properties of the catalyst was beneficial for improving the catalytic activity. The N2 adsorption–desorption isotherms of the V2O5/TiO2 powders prepared with different F-doping contents were shown in Fig. 5. All powders showed isotherms of type IV (BDDT classification), which exhibited hysteresis loops mostly of type H3, indicating that all powders contained mesopores (2–50 nm) with narrow slitlike shapes.28 The corresponding pore size distributions in the mesoporous region are shown in Fig. 6, which were calculated by the BJH method. It can be seen that the pore size distributions of the powders consist of small particle pores (2–10 nm), where the average pore diameter was 7–10 nm (as shown in Table 1). With increasing amounts of fluorine, the size of the pore volume decreased somewhat and the range of the pore size distribution gradually increased. The formation of the mesoporous structure was related to the aggregation of TiO2 crystallites.29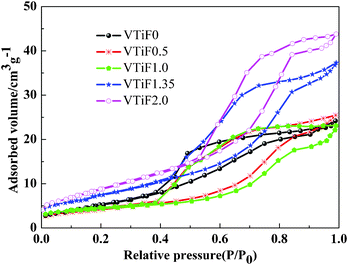 | ||
| Fig. 5 N2 adsorption–desorption isotherms of different F-doping contents. V2O5/TiO2 catalysts. (1) VTiF0; (2) VTiF0.5; (3) VTiF1; (4) VTiF1.35; (5) VTiF2. | ||
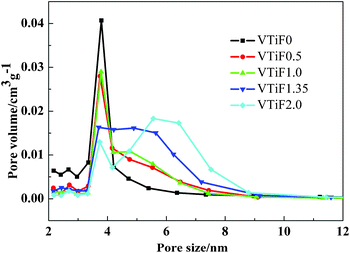 | ||
| Fig. 6 Pore size distributions of different F-doped content V2O5/TiO2 catalysts. | ||
| Sample | S BET (m2 g−1) | Pore volume (mm3 g−1) | Average pore diameter (nm) |
|---|---|---|---|
| VTiF0 | 20.84 | 37.44 | 7.19 |
| VTiF0.5 | 14.94 | 39.40 | 10.55 |
| VTiF1 | 15.24 | 35.77 | 9.39 |
| VTiF1.35 | 26.94 | 57.73 | 8.57 |
| VTiF2 | 32.68 | 67.75 | 8.29 |
The BET surface areas, total pore volumes and average pore diameters of all catalysts are summarized in Table 1. The pure V2O5/TiO2 had a BET surface area of 20.84 m2 g−1. When doping with a small amount of fluorine, the surface areas of VTiF0.5 and VTiF1.0 decreased to 14.94 m2 g−1 and 15.24 m2 g−1, respectively. However, further increasing the fluorine concentration made the surface area increase rapidly. This elucidated that a certain amount of F-doping could hinder the growth of TiO2 and increase the surface area. The main mechanism behind this was that non-mental doping could cause a few aberrations, accumulate energy and increase the grain diffusion barrier. Furthermore, the total pore volume of VTiF1.35 was about 1.5 times that of VTiF0. Large pore volumes and high surface areas could facilitate the spread of the reactant molecules (NO) or reaction intermediates in the role of the catalyst. However, the texture properties of the catalysts were not entirely proportional to their reactivity. According to the above phenomena, we inferred that the texture of the catalyst was not the most important factor which affects its activity in this catalytic reaction system.
3.4 TEM
Fig. 7 shows the TEM images of VTiF0 and VTiF1.35. It was observed that the morphology of the VTiF0 crystal was a rod-like particle with a length of about 70–150 nm. For VTiF1.35, the average grain size decreased to about 12–30 nm. This indicated that the grain size of VTiF1.35 was largely decreased when the F ions were used to modify V2O5/TiO2. The TEM images of VTiF0.5, VTiF1.0 and VTiF2.0 were nearly the same as that of VTiF1.35.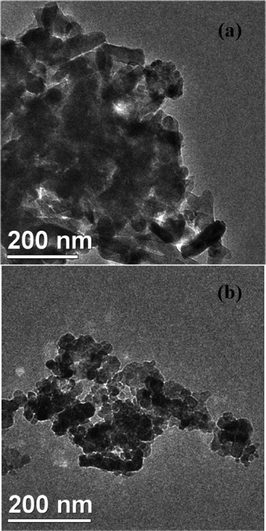 | ||
| Fig. 7 The TEM images of (a) VTiF0 and (b) VTiF1.35. | ||
3.5 H2-TPR
The redox ability of the vanadium species was considered as another key catalytic factor of the SCR. Here H2-TPR was carried out to investigate the effect that the doping F ions has on the interactions of the dispersed vanadia species with the TiO2 support, and the reduction behaviors of the dispersed vanadia species. As shown in Fig. 8, both VTiF0 (Fig. 8a) and VTiF1.35 (Fig. 8b) showed two redox peaks. The redox peaks located between 720 K and 860 K were assigned to the reduction of the VOx monolayer species from V5+ to V3+.30 The redox peaks shifted to the lower temperature side with F addition and the two peaks were observed below 873 K, which could be attributed to good dispersion of the vanadia and interactions between vanadia and the TiO2 support.31 It was found that the reduction peaks of VTiF1.35 (Fig. 8b) had obviously shifted to the lower temperature region compared with VTiF0 (Fig. 8a). This meant that the supported vanadia were easier to reduce, namely, the oxygen species on the F-doping V2O5/TiO2 were more reactive. Thus the supported vanadia species had superior catalytic properties for selective oxidation. Meanwhile, the H2 consumption of VTiF1.35 was larger than that of VTiF0, as shown in Fig. 8. This indicated that doping F ions into the V2O5/TiO2 catalyst increased the reduction degree of the vanadium ions,32 which was also correlated to the SCR activity.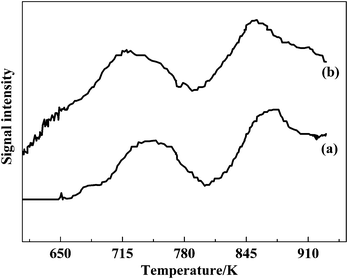 | ||
| Fig. 8 H2-TPR profiles of VTiF0 (a) and VTiF1.35 (b). | ||
3.6 NO adsorption
Fig. 9 presents the NO-TPD profiles of the catalysts. From Fig. 9, it was evident that the NO-TPD area of VTiF1.35 was significantly larger than that of VTiF0. In addition, the desorption temperature of VTiF1.35 had some shifts toward lower temperatures in the TPD profiles compared with VTiF0. According to the analysis of Chen et al.,33 this indicates that the unstable nitrate species appears at low temperature, and that the stable nitrates occupying the active sites over the catalyst were bad for the SCR reaction at low temperatures. The adsorption sites of NO on this catalyst might be the surface oxygen species of varying coordination environments (i.e., oxygen vacancies).34 The surface of the F-doped catalysts exhibited more oxygen vacancies, which could increase the capacity of NO adsorption. This indicated that the F-doped catalysts could adsorb more NO. This was conducive to the adsorption of NO to form NO2 by oxidation on the catalyst surface. Thus it would facilitate to improve the NO2/NOx ratio, which was beneficial for the NH3-SCR.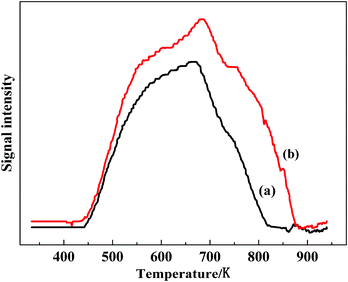 | ||
| Fig. 9 NO-TPD profiles of VTiF0 (a) and VTiF1.35 (b). The catalysts were treated in an He atmosphere prior to NO adsorption. | ||
3.7 XPS
Determination of the oxidation state of the doped F was carried out by measuring F 1s binding energies (EB) from the high-resolution XPS spectra, as shown in Fig. 10. The peak at 685.4 eV could be related to the TiOF2 structure, while the peak at 686.6 eV was assigned to F atoms occupying oxygen sites in the TiO2 crystal lattice, which means the formation of Ti–O–F. The peak at 689.4 eV originates from the nonstoichiometric solid solution of F in TiO2, of the type TiO2−xFx.35 The atomic size of F was closer to the size of O, rather than Ti. This indicated that F was a high substitutional component in TiO2, especially at low concentrations, as in our case. In contrast, the F 1s peak was not observed in the undoped catalyst.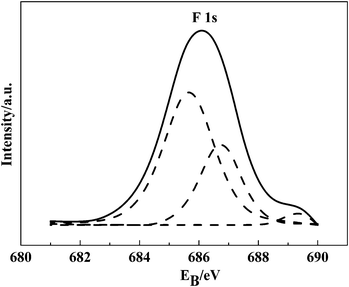 | ||
| Fig. 10 F 1s XPS spectra of VTiF1.35. | ||
3.8 EPR spectroscopy
Doping of TiO2 with heteroatoms introduced defects. The defects generally gave rise to the oxygen vacancies. Shannon and Pask proposed that these heteroatom additives were promoters if they could increase the oxygen vacancy concentration.36 EPR was recorded to explore the formation of oxygen vacancies on the surface of the V2O5/TiO2 catalysts before and after F-doping.EPR spectra were measured at atmospheric pressure and room temperature for the samples. As shown in Fig. 11, significant EPR signals (∼3475 G) could be observed, which were assigned to superoxide radicals. Notably, the effect of this signal intensity caused by the fluorine dopant was clearly seen from Fig. 11. The maximum intensity was observed when RF/Ti = 1.35%. Surface chemisorbed oxygen was the most active oxygen and played an important role in the oxidation reaction. A correlation was found between the NO conversion, the relative intensity of the superoxide radicals, and the fluorine dopant content (RF/Ti) in these catalysts (Fig. 2). These results indicated that increasing fluorine content could enhance the number of surface superoxide radicals and improve NOx conversion. Further, we shall discuss the role of superoxide radicals in catalysis.
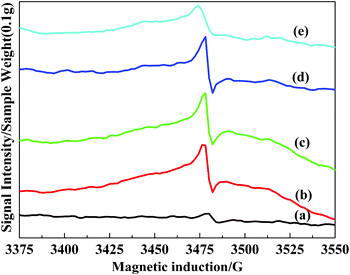 | ||
| Fig. 11 ESR spectra for the different F-doped content V2O5/TiO2 catalysts. (a) VTiF0, (b) VTiF0.5, (c) VTiF1, (d) VTiF1.35, (e) VTiF2. | ||
3.9 Discussion and the proposed mechanism
As NOx exhaust gas passes over the catalyst in the presence of ammonia or urea (a nitrogenous reductant), chemical reactions occur that reduce NOx emissions to nitrogen according to the so-called standard SCR reaction, eqn (3). Increasing the NO2/NO molar ratio (NO2 accounts only for few percent of total NOx in exhaust gas) can boost the DeNOx activity of the SCR catalysts at low temperature, named the fast SCR reaction, eqn (4). The highest DeNOx efficiencies are achieved when the NO2/NO molar ratio is 1/1 associated with the reaction in eqn (4).37 The conversion of NO and NO2 is an important step. Oxygen molecules can be chemisorbed by oxygen vacancies, as superoxide radical ions, O2−. Researchers have observed that NO molecules can react with O2−, eqn (5). As part of NO is adsorbed as NO+, the ion pair NO+NO3− can decompose to two NO2 molecules, eqn (6).38| 2NH3 + 2NO = 1/2O2→2N2 + 3H2O | (3) |
| 2NH3 + NO + NO2→2N2 + 3H2O | (4) |
| NO + O2−→NO3− | (5) |
| NO+ + NO3−→2NO2 | (6) |
The amount of O2 chemisorbed on the catalyst surface mainly depends on the concentration of surface defects.39 This suggests that the activity improvement of the catalyst might be contributed to the increase in surface defects after F-doping, which formed more reactive oxygen species, such as superoxide radicals O2−.
To gain further insight into the reactivity of superoxide radicals on the catalyst surface, the experimental investigation was preformed by bringing these catalysts into contact with flowing NO (20 mL min−1) at 513 K and atmospheric pressure. In Fig. 12, it can be clearly seen that the signal at 3475 G sharply weakens after flowing NO gas. This phenomena illustrates that O2− possesses chemical reaction activity towards NO.
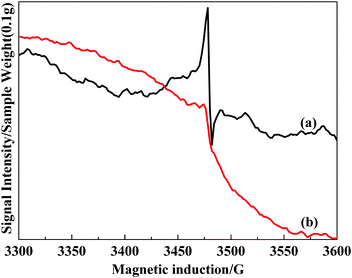 | ||
| Fig. 12 ESR spectra for VTiF1.35, (a) un-adsorbed NO; (b) pre-adsorbed NO for 2 h at 513 K. | ||
The catalysts were exposed to the flow gas containing 0.05% NO, 0.05% NH3, and 5% O2 in N2 as the balance gas at a flow rate of 150 mL min−1 for 3 h at 513 K and atmospheric pressure. The EPR spectra of VTiF0 and VTiF1.35 were shown in Fig. 12. After contacting the catalysts with the reaction gas at 513 K, the band assigned to superoxide radicals still existed (Fig. 13). This meant that, in the presence of O2, O2 could be chemisorbed on the catalyst surface, which is associated with the surface defects. This phenomenon was in agreement with the “standard model” for this surface.40
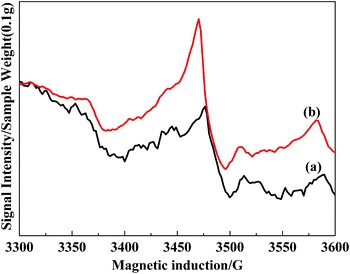 | ||
| Fig. 13 ESR spectra of 0.1 g VTiF0(a) and VTiF1.35(b) in reaction conditions at 513 K. The total flow rate was 150 mL min−1. 0.05% NO, 0.05% NH3, 5% O2 with N2 as the balance gas. | ||
All of the above results suggested that superoxide radicals had a positive effect on the SCR reaction and F-doping was an effective way to increase the number of superoxide radicals on the surface of the catalysts.
4. Conclusions
This study presents a detailed analysis of the effect of F-doping on the catalytic activity of the V2O5/TiO2 catalyst toward the selective catalytic reduction of NOx. This high catalytic activity is ascribed to several beneficial effects produced by F-doping. The addition of fluorine accelerates the oxidation of NO to NO2, which is more active than NO towards the SCR reaction. XPS analysis demonstrates that fluorine ions are doped into the TiO2 lattice, while the TEM results show that F-doping influenced the surface morphology of the catalyst. From the results of XRD and Raman analysis, we conclude that F-doping could inhibit the transformation of anatase TiO2 to the rutile phase, where the anatase form has superior catalytic performance to rutile. H2-TPR results indicate that the addition of fluorine could enhance the redox activity of V2O5/TiO2. Moreover, the NO adsorption capacity was increased by F-doping, as seen in the NO-TPD results. The ESR spectra of the catalysts indicated that F-doping facilitates the formation of oxygen vacancies. Superoxide radical ions can be formed on the oxygen vacancies upon O2 adsorption. In summary, the anatase structure, texture properties, hydrogen reduction performance and oxygen vacancies (with subsequent superoxide radical formation), could explain the enhanced catalytic activity of the catalyst for the removal of NOx. Further, ESR experiments confirmed that the most important influence of F-doping, in terms of overall performance, on the catalyst was the amount of oxygen species on the catalyst surface.Acknowledgements
This work was financially supported by the National Natural Science Foundation of China (51078185) and (U1162119), the research fund of the Key Laboratory for Advanced Technology in Environmental Protection of Jiangsu Province (AE201001) and Research Fund for the Doctoral Program of Higher Education of China (20113219110009). Special thanks are given to Prof. Y. X. Sui (Nanjing University) for ESR measurements.References
- L. D. Smoot, S. C. Hill and H. Xu, Prog, Energy Combust. Sci., 1998, 24, 385 CrossRef CAS.
- L. Chen, J. H. Li, M. F. Ge and R.H. Zhu, Catal. Today., 2010, 15, 377 Search PubMed.
- X. Gao, X. S. Du, L. W. Cui, Y. C. Fu, Z. Y. Luo and K. F. Cen, Catal. Commun., 2010, 12, 255 CrossRef CAS.
- X. D. Wu, Z. C. Si, G. Li, D. Weng and Z. R. Ma, J. Rare Earths, 2011, 29, 64 CrossRef CAS.
- G. S. Qi and R. T. Yang, Appl. Catal., B, 2003, 44, 217 CrossRef CAS.
- (a) G. B. Song, J. K. Liang, F. S. Liu, T. J. Peng and G. H. Rao, Thin Solid Films, 2005, 491, 110 CrossRef CAS; (b) D. P. Macwan, P. N. Dave and S. Chaturvedi, J. Mater. Sci., 2011, 46, 3669 CrossRef CAS.
- Y. J. Kim, H. J. Kwon, In-Sik Nam, J. W. Choung and J. K. Kil, Catal. Today, 2010, 151, 244 CrossRef CAS.
- Q. Li, H. S. Yang, F. M. Qiu and X. B Zhang, J. Hazard. Mater., 2011, 192, 915 CrossRef CAS.
- B. X. Shen, T. Liu, N. Zhao, X. Y. Yang and L. D. Deng, J. Environ. Sci., 2010, 22, 1447 CrossRef CAS.
- Z. B. Wu, B. Q. Jiang, Y. Liu, W. R. Zhao and B. H. Guan, J. Hazard. Mater., 2007, 145, 488 CrossRef CAS.
- (a) F. D. Liu, H. He and C. B. Zhang, Chem. Commun., 2008, 2043 RSC; (b) F. D. Liu, H. He and C. B. Zhang, Appl. Catal., B, 2009, 93, 194 CrossRef CAS.
- W. Q. Xu, Y. B. Yu, C. B. Zhang and H. He, Catal. Commun., 2008, 9, 1453 CrossRef CAS.
- W. P. Shan, F. D. Liu, H. He, X. Y. Shi and C. B. Zhang, Appl. Catal., B, 2012, 115–116, 100 CrossRef CAS.
- Y. T. Li and Q. Zhong, J. Hazard. Mater., 2009, 172, 635 CrossRef CAS.
- A. Hattori, M. Yamamoto, H. Tada and S. Ito, Chem. Lett., 1998, 707 CrossRef CAS.
- (a) J. H. Goo, M. F. Irfan, S. D. Kim and S. C. Hong, Chemosphere, 2007, 67, 718 CrossRef CAS; (b) M. Koebel, G. Madia, F. Raimondi and A. Wokaun, J. Catal., 2002, 209, 159 CrossRef CAS; (c) M. Koebel, M. Elsener and M. Kleemann, Catal. Today, 2000, 59, 335 CrossRef CAS.
- J. Nowotny, T. Bak, L. R. Sheppard and M. K. Nowotny, J. Am. Chem. Soc., 2008, 130, 9984 CrossRef CAS.
- E. C. Bucharsky, G. Schell, R. Obseracker and M. J. J. Hoffmann, J. Eur. Ceram. Soc., 2009, 29, 1955 CrossRef CAS.
- P. Forzatti, Appl. Catal., A, 2001, 222, 221 CrossRef CAS.
- J. M. G. Amores, V. S. Escribano, G. Ramis and G. Busca, Appl. Catal., B, 1997, 13, 45 CrossRef.
- (a) S. M. Chang and W. S. Liu, Appl. Catal., B, 2011, 101, 333 CrossRef CAS; (b) M. A. Barakat, G. Hayes and S. I. J. Shah, Nanosci, Nanotechnol., 2005, 10, 1 Search PubMed; (c) B. Grzmil, M. Rabe, B. Kic and K. Lubkowski, Ind. Eng. Chem. Res., 2007, 46, 1018 CrossRef CAS; (d) M. L. Picquart, E. Escobar-Alarcon, T. Torres and E. Lopez, Haro-Poniatowski, J. Mater. Sci., 2002, 37, 3241 CrossRef CAS.
- A. P. Singh, S. Kumari, R. Shrivastav, S. Dass and V. R. Satsang, Int. J. Hydrogen Energy, 2008, 33, 5363 CrossRef CAS.
- (a) J. Lin and J. C. Yu, Photochem, J. Photochem. Photobiol., A, 1998, 116, 63 CrossRef CAS; (b) J. G. Li, H. Kamiyama, X. H. Wang, Y. Moriyoshi and T. Ishigaki, J. Eur. Ceram. Soc., 2006, 26, 423 CrossRef CAS.
- M. Ocana, J. V. Garcia-Ramos and C. J. Serna, J. Am. Ceram. Soc., 1992, 75, 2010 CrossRef CAS.
- R. Suryanarayanan, V. M. Naik, P. Kharel, P. Talagala and R. Naik, Solid State Commun., 2005, 133, 439 CrossRef CAS.
- (a) Q. Sun, Y. C. Fu, J. W. Liu, A. Auroxux and J. Y. Shen, Appl. Catal., A, 2008, 334, 26 CrossRef CAS; (b) N. Magg, B. Immaraporn, J. B. Giorgi and T. Schroeder, J. Catal., 2004, 226, 88 CrossRef CAS.
- S. Carrettin, Y. Hao, V. Aguilar-Guerrero, B. C. Gates, S. Trasobares, J. J. Calvino and A. Corma, Chem.–Eur. J., 2007, 13, 7771 CrossRef CAS.
- J. G. Yu, J. C. Yu, B. Cheng, S. K. Hark and K. Iu, J. Solid State Chem., 2003, 174, 372 CrossRef CAS.
- M. Zhou, J. G. Yu and B. Cheng, J. Hazard. Mater., 2006, 137, 1838 CrossRef CAS.
- (a) G. C. Bond, Appl. Catal., A, 1997, 157, 91 CrossRef CAS; (b) A. M. Nie, H. S. Yang and X. B. Zhang, Ind. Eng. Chem. Res., 2011, 50, 9944 CrossRef CAS.
- H. Y. Zhao, S. Bennici, J. Y. Shen and A. Auroux, J. Catal., 2010, 272, 176 CrossRef CAS.
- (a) L. Chen, J. H. Li and M. F. Ge, Chem. Eng. J., 2011, 170, 531 CrossRef CAS; (b) F. S. Tang, B. L. Xu, H. H. Shi, J. H. Qiu and Y. N. Fan, Appl. Catal., B, 2010, 94, 71 CrossRef CAS.
- L. Chen, J. H. Li, M. F. Ge, M. Lei and H. Z. Chang, Chin. J. Catal., 2011, 32, 836 CrossRef CAS.
- V. C. Belessi, T. V. Bakas, C. N. Costa, A. M. Efstathiou and P. J. Pomonis, Appl. Catal., B, 2000, 28, 13 CrossRef CAS.
- J. C. Yu, J. G. Yu, W. K. Ho, Z. T. Jiang and L. Z. Zhang, Chem. Mater., 2002, 14, 3808 CrossRef CAS.
- R. D. Shannon and J. A. Pask, J. Am. Ceram. Soc., 1965, 48, 391 CrossRef CAS.
- P. Forzatti, I. Nova and E. Tronconi, Angew, Angew. Chem., Int. Ed., 2009, 48, 8366 CrossRef CAS.
- X. Wang, H. Y. Chen and W. M. H Sachtler, J. Catal., 2001, 197, 281 CrossRef CAS.
- N. G. Petrik, Z. R. Zhang, Y. G. Du, Z. Dohnalek, I. Lyubinetsky and G. A. Kimmel, J. Phys. Chem. C, 2009, 113, 12407 CAS.
- U. Diebold, Surf. Sci. Rep., 2003, 48, 53 CrossRef CAS.
| This journal is © The Royal Society of Chemistry 2012 |

