DOI:
10.1039/C2RA20716H
(Paper)
RSC Adv., 2012,
2, 6424-6437
Biorefining of perennial ryegrass for the production of nanofibrillated cellulose†
Received
19th April 2012
, Accepted 19th April 2012
First published on 27th April 2012
Abstract
This study has demonstrated biorefining steps for ryegrass and silage at a pilot scale to extrude fibre cake for the production of nanofibrillated cellulose (NFC), a potentially green biomaterial for replacing conventional fillers in the manufacture of polymer composites. Further treatments of processed ryegrass fibres with mechanical shearing, microfluidising, hydrochloric acid (HCl)/sulphuric acid and a four stage {ethylenediaminetetra-acetic acid, sodium hydroxide, sodium hypochlorite and HCl} hydrolysis yielded 43.8, 36.1, 25.6 and 39.8 kg t−1 DM of NFCs respectively. The NFCs were characterised using microscopy, X-ray diffraction, dynamic light scattering, spectroscopy and thermogravimetry. The NFC had diameters from 3.0–9.1 nm and length 308 nm–4.6 μm. NFC-polyvinyl alcohol composites containing NFC (5 wt%) exhibited enhanced Young's modulus and thermal stability by factors of 2.5 and 2 respectively compared with control. The mass, energy, water and chemical balances of the four process steps were assessed to evaluate technical feasibility and also to provide baseline production data for scaling up. The microfluidised product has been identified as the best NFC product, but production cost needs to be reduced.
1. Introduction
There has been considerable interest in the use of grass biomass for biorefining in the UK and Ireland.1–4 However the majority of the studies have been based on modelling biorefining data derived from work carried out in Europe.5–7 This approach has been driven by the need to develop sustainable production technologies for bioenergy6 and nano-fibrillated (NFC) cellulose,2 which can be used as replacement for conventional fillers e.g. glass, aramid and carbon fibres for manufacturing high strength polymer composites.8–10
Although NFC has yet to make a significant industrial breakthrough, international research into its production and application is continuing due to its large surface area-to-volume ratio, high aspect ratio and exceptional optical and mechanical properties.8 NFC is predicted to have many potential applications in electronics, high performance composites and medical products. 9–11 As a result of their size, a suspension of cellulose microfibrils in low concentration is gel-like and transparent. NFC has been extracted from lignocellulosic raw materials by a variety of processes, including steam explosion, mechanical shearing and crushing, chemo-mechanical processing and acid hydrolysis.10–13 Sulphuric acid hydrolysis has been the most straight forward protocol to isolate NFC from lignocellulosic sources.10 It has been shown that the hydrolysis conditions, including reaction time, acid-to-pulp ratio and acid type (H2SO4 and HCl) have a great influence on the dimensions and surface charge of the cellulose nanofibres. For example, a long reaction time and high acid-to-pulp ratio resulted in the formation of shorter and finer fibres.14 Sulphuric acid provided a highly stable aqueous suspension with the introduction of sulphate groups on the surface of crystallites, whereas hydrochloric acid showed minimal surface charge on the cellulose nanofibres.15
NFC can be made from a variety of plant sources such as, corn, cotton, flax, ramie, softwood pulp and sugar beet.10,12,16–19 Currently, the energy consumption of biorefining lignocellulosic materials to NFC is high, due to the dominating hydrogen bonding between the cellulose microfibrils and additional cross-links with hemicellulose, pectin, lignin and lipids. This interfibrillar hydrogen bonding energy (20 MJ kg−1 mol) has to be disrupted in order to hydrolyse the cellulose.20
Previous biorefining research has largely focused on the use of ensiled feedstock for anaerobic digestion of the grass fibre fraction for biogas generation,3–6 the hydrolysis of pressed fibre cakes to recover sugars21 and the fractionation of silage juice for lactic acid and high value amino acids.3,6 In this study we have focused on the utilization of fibre cake resulting from pilot scale ryegrass biorefining trials, as feedstock for the production of NFC by employing a range of treatment methods, including a green chemical/mechanical protocol. The quality of NFC was assessed as reinforcement for polyvinyl alcohol composites. Overall mass, water, chemical and energy balances were also evaluated to assess technical feasibility of NFC production.
2. Experimental
2.1 Materials
Batches of fresh ryegrass and silage samples were obtained from ensiling trials using experimental plots in Hillsborough and Loughgall, Northern Ireland.22 Four batches each of ryegrass and silage (4 × 250 kg samples = 1 tonne fresh weight for each) were processed. The ryegrass (fresh) samples were stored in a cold room (−5 °C) before processing. The reference standards: cellulose (C-6429) and polyvinyl alcohol (363138-1; 99% hydrolysed; molecular weight 31![[thin space (1/6-em)]](https://www.rsc.org/images/entities/char_2009.gif) 000–50000 Daltons) were obtained from Sigma (UK).
000–50000 Daltons) were obtained from Sigma (UK).
2.2 Separation of fibre and juice
The batches of ensiled and fresh ryegrasses underwent primary processing using a pilot scale screw press (Model PP-7RL-S, Ponndorf Maschinenfabrik, Germany, Fig. 1). The screw was rotated at 11–14 revolutions per minute with the pitch set at 1:7.5 using the protocol described by Sharma et al.22 In the primary process step, the feedstock was fed to the screw-press at a rate of 3 kg min−1 and the extruded pressed cake and juice fractions were separated and collected in a plastic bag and container tanks respectively (Fig. 1). The samples of juice were taken and frozen for further evaluation (results not presented). Samples (5 kg) were taken pre and post juice separation for the evaluation of dry matter (DM) content and fibre yield. The DM content was estimated after drying overnight (80 °C). In the secondary process step, the extruded pressed cake was collected and further refined with the aid of a blender (Model no 35BL59, Waring, USA) using a previously reported protocol.22 The resulting wet samples were pressed to remove excess water and air dried for 48–72 h under ambient conditions (12–30 °C) to minimise dryback. All determinations were performed in triplicate. The mass balance of the two input materials were measured to show differences in the yield of extruded fibre at primary and secondary processing steps.
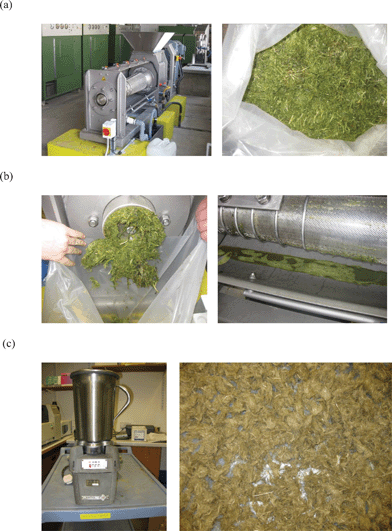 |
| | Fig. 1 Biorefining of ryegrass biomass, (a) an example of primary processing ryegrass (fresh material) using screw press (b) pressed fibre cake and juice and (c) Secondary processing—processing of pressed grass with water using a mechanical blender to remove non-cellulosic components and dried fibre. | |
Other test results reported in the following sections were carried out using ryegrass only (i.e. not silage) as input material for NFC production. The processing experiments, including monitoring input of water and energy were repeated twice with mean results reported.
2.3 Processing of ryegrass fibre
Samples of the fibre (500 g wet weight) after secondary processing of ryegrass fibre cake were dried in an oven at 80 °C for 16 h and then milled (Model 1093, Tecator/Foss, Denmark) with a mesh screen size of 0.5 mm. The milled samples were stored in plastic jars for further analyses. Sample (50 g milled fibre) was refluxed with NaOH (1 M, 500 ml) for 1 h, to remove hemicelluloses, pigments and other water soluble fractions. The residue was repeatedly washed with distilled water until neutral pH was achieved, followed by centrifuging at 28 000 rpm for 10 min and the resulting pellet was freeze dried. This residue was used as a starting material for the preparation of NFC products A, B and C (Fig. 2). The NaOH treated material (1 wt% in 400 ml water) was fibrillated by high speed mechanical shearing (T 25, Ultra Turrax, S25N-PG dispersing tool, IKA, Germany) at 24 000 rpm for 30 min (Fig. 2) to obtain product A. The sample was cooled with crushed ice to minimise damage by heat generated during high speed shearing of the fibres. A sub-sample of product A (0.5 wt% 200 ml) was subjected to high pressure shearing (M110-P, Microfluidics Corp., USA) of the fibre with a pair of Z-shaped interaction chambers (200 μm, ceramic and 85 μm diamond) under an operating pressure of 30 000 psi and a flow rate of 100 ml min−1. This treatment resulted in the reduction of particles to NFC (product B, Fig. 2).
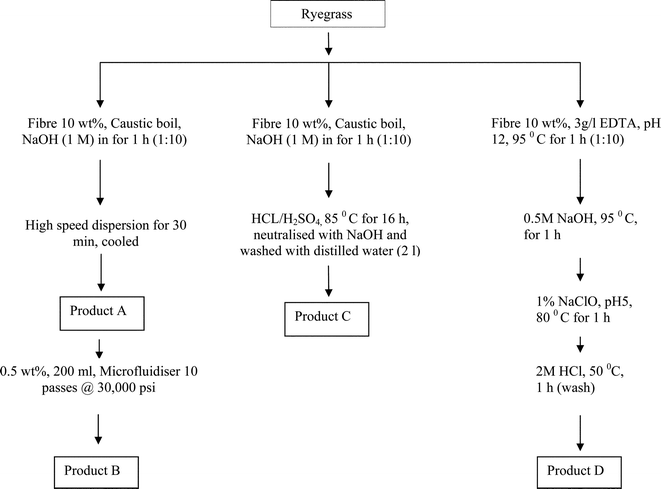 |
| | Fig. 2 Scheme for the fractionation of NFC (nanofibrillated cellulose) from fibre samples of ryegrass (fresh material). | |
Product C was prepared by hydrolysing the NaOH treated fibres with a mixture of H2SO4 and HCl (Fig. 2). The four treatment steps employed for preparing product D (e.g. EDTA, NaOH, NaClO bleaching and HCl wash) were aimed at removing the non-cellulosic components, such as hemicellulose, lignin and minerals (Fig. 2). The experimental protocols used in this study were adapted from published methods.10,14,15,20 The NFC suspensions (A, B, C and D) were finally placed in cellulose dialysis tubing (D9652, Sigma, UK) and dialysed against tap water for 3 days to remove residual salts. The NFC content was prepared at 1 wt% aqueous suspension and refrigerated at 4 °C. Each NFC product was prepared in duplicate. The changes in the composition of cellulose, hemicellulose and lignin were monitored by estimating acid detergent fibre (ADF), neutral detergent fibre (NDF) and lignin content of the samples.23,24 The mass, water, chemical and energy balances of the treatment steps were calculated on the basis of the total fibre fraction obtained from the initial 1 tonne of fresh ryegrass. Total energy used by the process equipment was determined during each of the mechanical and chemical treatment steps using a portable appliance power monitoring unit (Model 2000, Maplin, UK). Since drying of processed fibre samples was carried out in ambient conditions to minimise dry-back, drying cost was not included in the overall energy input. All experimental stages were repeated at least 2 times using milled ryegrass samples.
2.4 Particle size measurement, zeta potential and viscosity
The zeta potential of the four NFC suspensions in a wide pH range was measured, to determine mobility of the particles undergoing electrophoresis.10 Aqueous suspensions of the samples (1 mg cm−3) at acidic and alkaline pH (pH 3, 5, 7, 9 and 11) were prepared using the freeze dried materials and filtered using a 0.2 μm filter (Whatman, UK). The particle sizes of the filtered samples were measured at room temperature (25 ± 2 °C), with a Zetasizer Nano ZS (Malvern Instruments, UK) equipped with a He–Ne laser (λ = 633 nm) and a backscatter detector at an angle of 173°, using a disposable plastic cuvette. The instrument recorded the intensity autocorrelation function, which was transformed into volume functions to obtain information on particle size. Viscosity of the samples was measured by a viscometer (SV10, AND viscometer, Japan).
2.5 Morphology
The NFC samples prepared from ryegrass were evaluated for size distribution using a transmission electron (TEM) microscope (Philips, Tecnai, F20) at an acceleration voltage of 120 kV. One drop of NFC suspension, at 1 wt% concentration, was placed on a copper TEM grid which had been coated with a thin carbon film. The drop was gently drawn off using a small triangle of filter paper (Watman Grade 1) leaving a monolayer on the grid. The grid was then stained with 2% uranyl acetate by placing one drop of the stain on the grid and leaving it to stand for 30 s before gently drawing it off as above. This was repeated for each of the four different NFC sample preparations.9 The experiments were repeated using at least a minimum of two replicate samples. The mineral composition of the samples was determined, using a semi-quantitative protocol, by energy dispersive X-ray microanalysis (EDX) (Inca 300, Oxford Instruments, UK), ancillary to a scanning electron microscope (SEM, Quanta 200, FEI, The Netherlands). All samples were analysed under the same instrument conditions.25 The dried samples were distributed on adhesive carbon discs on SEM sample support stubs. Each sample was imaged at 200 times magnification and from five different regions. Ten particles were selected from each region and analysed in turn giving a total of 50 X-ray spectra per sample. The means of semi-quantitative data were obtained for each of the four products. Surface morphology of the NFC samples was also examined by SEM after sputter coating with gold. The diameter and length of nanofibres from images obtained from TEM and SEM micrographs were measured using image analysis software (XT docu, AnalySIS image processing, UK). At least 60–80 particles were measured to estimate mean diameter and length of the nanofibres.
2.6 Thermogravimetric analysis
Thermogravimetric (TG) analyses of the four NFC products, reference cellulose and control fibre sample (after secondary processing) were carried out by pyrolysis in nitrogen using a thermogravimetric analyser (TGA/DSC 1, Mettler Toledo, Switzerland). A typical sample mass of 3.1 mg was heated from 30–780 °C at a heating rate of 20 °C min−1 in a flow rate of 50 ml min−1 of nitrogen.25
2.7 Fourier transform infrared spectroscopy
The spectra of freeze dried NFC preparations, reference cellulose and the resulting fibre from secondary processing (i.e. control) were obtained using a Spectrum One FTIR spectrometer (Perkin Elmer Inc., USA) equipped with an attenuated total reflectance sampling device containing a diamond/ZnSe crystal. Spectra were scanned at room temperature over the wave number range 40 00–650 cm−1, with a scan speed of 0.20 cm s−1 and 60 accumulations at a resolution of 4 cm−1. Triplicate scans of each sample were used to obtain an average spectrum and the background spectrum was scanned under the same instrumental conditions. The spectra were acquired using Spectrum software version 5.01, base line corrected and normalised.25
2.8 Powder X-ray diffraction
NFC suspensions (10 ml) from the four products were freeze dried overnight and hand milled in a mortar and pestle to produce homogeneous samples. X-ray diffraction patterns of nanofibres were obtained at 40 kV and 40 mA using an X-ray diffractometer (X'pert, Pro Panalytical, The Netherlands) Multiple scans were carried out at a rate of 0.03 step/0.6 s using a Ni-filtered Cu-Kα beam wavelength, λ = 1.5406 Å. The degree of crystallinity was estimated using the equation {Ic = (I200 − Iam/I200) × 100} height of the 200 crystalline peak (at 2θ = 22.6°) and the minimum for amorphous material (Iam) between 200 and 110 peaks (at 2θ = 18°).10
2.9 Preparation of the PVA film containing NFC
The NFC products (Fig. 2) were prepared as 1% by weight aqueous suspension. Nanocellulose-reinforced PVA films were fabricated using a 10 wt% aqueous solution of PVA maintained at 90 °C for 1 h. The PVA solution was continuously stirred during cooling to room temperature. The solution was mixed with the NFC suspensions to yield 1 and 5 wt% concentrations for each of the four products and the preparations were incubated in an ultrasonic bath for 1 h. The suspensions were then cast onto a Petri dish and dried at ambient temperature for 3 days. The composite films were removed from the Petri dish and placed in desiccators for 2 days before storage at 23 °C and 50% relative humidity prior to characterisation.10
2.10 Mechanical analysis
The composite films were first cut into an American Society for Testing of Materials (ASTM) standard shape with a gauge length of 25 mm and 5 mm width. The tensile strength, modulus and elongation at break were measured at 23 °C with an Instron 5564, universal tensile testing machine (Instron, UK) using a 2 kN load cell and 50 mm min−1 crosshead speed according to ISO 527. The width and thickness of the samples were measured before each measurement. The Young's modulus values were determined from the initial slope of the tensile curves. A minimum of 10 samples were tested for each preparation.10
2.11 DMTA
Dynamic mechanical thermal analysis (DMTA) of the PVA nanocomposites was undertaken in the tensile mode with a DMA 2000 (Triton Technologies, Germany). The measurements were carried out at a constant frequency of 1 Hz with a 1 N preload, a strain amplitude of 0.1%, a temperature range of −30 to 120 °C, a heating rate of 5 °C min−1 and a gap distance of 5 mm. The samples were prepared by cutting strips from the films with a width of 5 mm. Two sets of films were prepared to evaluate the effect of water plasticisation on the PVA films from: (1) humidified film stored at 50% RH, 23 °C and (2) dried film, conditioned at 55 °C for 2 days prior to characterisation.10
2.12 Data analysis
The results from the ryegrass processing trials (fresh weight and DM content of the fibre samples), mineral composition and TG parameters (weight loss, peak temperature, rate of weight loss and residue) of the NFC products were analysed using ANOVA and standard error of means for each parameter was calculated and presented with levels of significance.
3. Results and discussion
3.1 Processing of fresh ryegrass and silage
Trials were performed with two grass feedstocks for comparison of fibre yields. The DM content of the pressed ryegrass (157.01 g kg−1) and silage (121.09 g kg−1) cakes were significantly different (P < 0.001) (Table 1, Fig. 3). The differences in yield between the two raw materials were due to higher juice content of silage (725.50 g kg−1) compared with the fresh ryegrass (638.80 g kg−1). However, following a secondary mechanical processing stage (Fig. 3), there was no significant difference in the fibre yield of silage (104.63 g kg−1 DM) and (113.11 g kg−1 DM, Table 1). The water soluble carbohydrates and hemicelluloses in grass are well broken down during the ensiling process to lactic acid5 which resulted in recovering proportionally less dry matter compared with un-degraded fresh ryegrass at the end of primary processing step. A large proportion of fine particles, soft tissues and water soluble fractions resulting from the mechanical processing of fresh ryegrass were lost during the final washing step (i.e. secondary process). Liu et al.26 reported a cellulose (fibre) yield of 328–368 g kg−1 DM from laboratory scale de-juicing of ryegrass leaves (100 g, fresh weight). The changes in fibre fractions at the start of the fresh grass biorefining and end of secondary processing were monitored and a proportional increase of cellulose (226 to 385 g kg−1 DM) and hemicellulose (196 to 380 g kg−1 DM) were observed but lignin content increased only marginally (31 to 37 g kg−1 DM; Fig. 3).
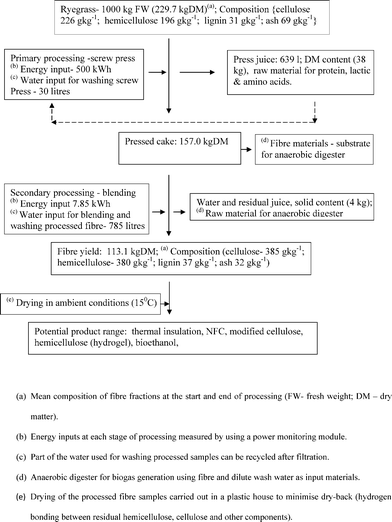 |
| | Fig. 3 Processing of ryegrass for the production of NFC. Mass, water and energy balances of ryegrass processing showing changes in major fractions and potential products; solid lines denote flow of material & broken lines denote flow of recycled water. | |
Table 1 Pilot scale biorefining of fresh ryegrass and silage showing yields of extruded cake (DM: dry matter) at the end of primary processing (screw press) and fibre yields following a secondary mechanical processing (blender) of the fibre cake
| Input materials |
Pressed cake (g kg−1 DM) after primary processing |
Fibre yield (g kg−1 DM) after secondary processing |
|
SEM = standard error of means
Significant at P < 0.001
not significant
|
| Ryegrass |
157.01 |
113.11 |
| Silage |
121.09 |
104.63 |
| SEMa |
1.47b |
2.56c |
3.2. Mass flow
The mass balance of input and output materials was calculated, as DM t−1 based on the trials for fresh and ensiled ryegrass samples. Examples of input material cost can range between £102 DM t−1 in Northern Ireland and €75 DM t−1 in the Republic of Ireland.2 The separated pressed cake was stored and weighed. The resulting juice was stored in 100 litre plastic containers for use, as input material for an anaerobic digester (result not presented). Previous reports have highlighted difficulties faced during processing, due to spoilage of fresh grass mainly caused by delays in biorefining3–5 and the use of ensiled grass during the summer and winter months would reduce the quality variations of feedstock material.
Electrically powered equipment involved in the processing, included screw press, macerators, microfluidiser, drying oven, pumps, hot plates and minor ancillary equipment. The electrical power used for processing, heating and drying has been measured and the energy used determined (3.6 MJ = 1 kWh). Furthermore the chemical reagents (i.e. commercial reagents) and volume of water (Fig. 3,Fig. 4) used at each step were also taken into account to estimate processing inputs.3,4 The calculations are based on idealised conditions, assuming a constant production rate at each of the steps listed in Fig. 3,Fig. 4. Labour costs were not included in the overall input analysis of the processes. Therefore interpretation of the results should be on the trends at each process step rather than on absolute values.
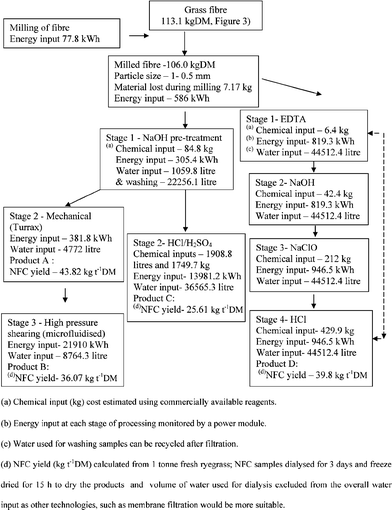 |
| | Fig. 4 Processing of ryegrass for the production of NFC. Mass, water, chemical and energy balances of NCF production using four physical and chemical process steps, yield of NFC (kg t−1 DM) as products A, B, C and D; solid lines denote flow of material & broken lines denote flow of recycled water. | |
3.3. Impact of extraction process on nanofibre yield and physical characteristics
The visual appearance of the four NFC preparations was different indicating particle size and compositional variations (Fig. 5a). For example the concentrated acid treated NFC (product C) was dark brown and not readily dispersed in the aqueous suspension, compared to the bleached product D which was gel like and almost transparent with a white tint. Products A and B retained a light greenish tint indicating residual chlorophyll content but sample B showed better dispersion of the materials compared to A probably due to the additional high pressure shearing treatment with the microfluidiser (Table 2b). The mean yield of nanofibres obtained from the four treatment protocols are presented in Table 2a. The yields of NFC were higher for products A (43.82 kg t−1), B (36.07 kg t−1) and D (39.8 kg t−1) compared to C (25.61 kg t−1). NFC yields from flax fibre, pulp and microcrystalline celluloses were in the range of 25–40%.8 One of the major challenges8,27 of using chemical hydrolysis to form NFC is the need for increasing yield, typically around 30 kg t−1 of initial weight and this study has successfully evaluated protocols which can maintain NFC yield above 30 kg t−1 (e.g. product A, B and D, Table 2a).8,27 The size, dimensions and yield of NFC depend on the treatment protocols.15,27,28
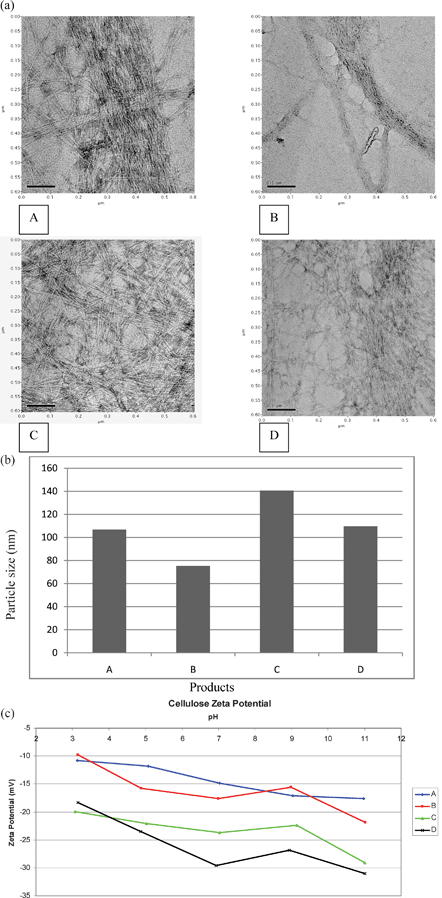 |
| | Fig. 5 Characterisation of products A, B, C and D for (a) the distribution of nano and microfibril size range 2.9–9.1 nm (diameter) and 308 nm–4.6 μm (length); (b) particle size (nm) presented as Z average (A: 106.8, B: 75.19, C: 140.6 and D: 109.6 nm); (c) comparison of zeta potential to show mobility of particles at acidic and alkaline pH. | |
Table 2 (a) Comparison of NFC yield (kg t−1 DM of the 1 tonne fresh ryegrass), processing time (h kg−1), inputs of water (litre), energy (kWh) and chemical reagents (kg and litre) for processing products A, B, C and D; energy and water inputs for the primary and secondary processing of ryegrass included in the estimates and (b) physical characteristics of the four products showing differences in colour, estimated diameter and length of the NFC from TEM and SEM micrographs
|
Table 2a
|
| Product |
NFC yield (kg t−1 DM) |
Processing time (h kg−1) |
Water (litre) |
Energy (kWh) |
Chemical reagents |
| A |
43.82 |
3.84 |
27843.2 |
1272.8 |
84.79 kg |
| B |
36.07 |
16.89 |
36607.5 |
23182.8 |
84.79 kg |
| C |
25.61 |
243.97 |
59636.5 |
14872.3 |
1834.59 kg & 1908.8 litre |
| D |
39.80 |
10.84 |
178864.6 |
4114.3 |
48.75 kg &641.82 litre |
|
Table 2b
|
| Product |
Colour |
Range of diameter |
Range of NFC length |
| A |
Light green tint |
3.8–8.4 nm (± 1.12) |
336 nm–3.3 μm (± 1.96 μm) |
| B |
Light green tint |
3.4–9.1 nm (± 1.19) |
324 nm–2.9 μm (± 1.32 μm) |
| C |
Dark brown |
2.9–7.2 nm (± 0.81) |
308 nm–2.4 μm (± 1.42 μm) |
| D |
Bleached white |
3.8–8.3 nm (± 0.90) |
492 nm–4.6 μm (± 2.78 μm) |
In this study key steps were an NaOH reflux, as a pre-treatment to remove amorphous non-cellulosic fractions, such as hemicelluloses, pectin, phenolic acids, lipids and minerals29 followed either by mechanical shearing of the products to smaller particles (products A and B) or a combined HCl and H2SO4 hydrolysis15 (product C) to reduce particle size. For product D the extracted fibres were pre-treated with EDTA and NaOH as two consecutive steps, followed by a hypochlorite bleaching step and warm HCl wash to generate NFC. The chemical inputs at each stage of the processes were estimated and collated (Fig. 4 and Table 2a). Viscosity of the four products (0.01 wt%) was in the range of 0.94–0.98 mPas. Total water, energy and chemical inputs required for processing the four products are presented in Table 2a. Comparisons, including time required for processing have shown that product A had the least and product C had the most inputs. From a processing view point, product B had been identified as the best, due to smaller NFC particle size range, lower volume of water/chemical inputs, shorter processing time and relatively high NFC yield (Table 2a). Furthermore, the high energy input required for high pressure shearing treatment of product B could be reduced by employing a pilot scale unit (MF-7250, pilot scale unit, Microfluidizer) equipped with a multi-slotted interaction chamber and dual intensifier pumps, leading to increased process efficiency.
Fig. 5a presents TEM micrographs of the four samples showing typical NFC size range of samples A, B, C and D (2.9–9.1 nm in diameter and 308 nm–4.6 μm in length, Table 2b). Images from the SEM micrographs were used for measuring mean maximum length of the nanofibres but micrographs are not presented. Since all NFC samples exhibited a wide minimum and maximum range, the aspect ratio was not calculated. Other researchers have reported nanofibre diameter range of 20–90 and 100 nm using high intensity grinding30 followed by Turrax and Microfluidiser treatments20 respectively.
The mineral composition of the NFC products are presented in Table 3 showing significant differences in Na and Cl concentrations on products B, C and D, possibly linked to the treatment steps. Significantly, the highest concentrations of Si (P < 0.001), S (P < 0.01) and Fe (P < 0.01) were detected in product A compared to the other three samples (Table 3). Products C and D which were treated with HCl/H2SO4 and the four process steps respectively, succeeded in significantly removing Si (P < 0.001), and S (P < 0.01) compared with the other two treatments (Table 3).
Table 3 Comparison of mineral fractions (%) present in the NFC products A, B, C and D prepared from ryegrass
| Product |
Na |
Mg |
Al |
Si |
S |
Cl |
K |
Ca |
Fe |
|
SEM = standard error of means
Significant at P < 0.01
Significant at P < 0.001
ns: not significant
|
| A |
0.144 |
0.088 |
0.054 |
0.162 |
0.302 |
0.156 |
0.142 |
0.032 |
0.670 |
| B |
0.358 |
0.066 |
0.066 |
0.084 |
0.152 |
0.346 |
0.136 |
0.032 |
0.416 |
| C |
0.324 |
0.084 |
0.042 |
0.068 |
0.014 |
0.446 |
0.218 |
0.034 |
0.408 |
| D |
0.232 |
0.054 |
0.032 |
0.058 |
0.014 |
0.222 |
0.520 |
0.030 |
0.306 |
| SEMa |
0.025c |
0.011c |
0.01d |
0.012c |
0.018b |
0.001c |
0.032b |
0.007d |
0.057b |
3.4. Particle size distribution
Dynamic light scattering (DLS) is a versatile instrument for determining the size of particles in colloidal suspensions.31 The morphology of the four samples was evaluated to assess the size distribution of NFC (Fig. 5b). The DLS utilizes time variation of scattered light from suspended particles under Brownian motion to measure hydrodynamic size distribution, using photon correlation spectroscopy.32 Results from DLS determinations are shown in Fig. 5b, in terms of Z average diameter showing a larger particle size for product C compared to the other three products within the range (0.1–10 000 nm). In addition the NFC particles in product C aggregated in aqueous suspension rapidly compared to the other 3 products. These observations could be explained by higher hydrophobic characteristics of the particles (i.e. lower number of OH groups) in product C compared to products A, B, and D, leading to aggregation. Consequently, the sizes obtained from DLS tests were different to those measured by image analysis.10 It is clear that the hydrolysis conditions including the type of acid used were significant factors and could influence the particle size distribution of NFC.15
3.5. Zeta potential
A previous report by Jiang et al.33 identified the zeta potential (ZP) as the main factor influencing repulsion between particles which determines stability of particle dispersion in water. ZP is defined as the mobility of a particle per electric field unit and is measured by applying an electric field in a homogeneous aqueous suspension using the Helmholtz–Smoluchowski equation34 (Fig. 5c). Among the four preparations, product D, gave a high ZP: 18.2 mV at pH 3 and increased to −29.0 mV at pH 7, the highest negative ZP value at this pH (Fig. 5c). However at pH 9 and 11 the ZP values changed to −26.4 and −31.5 mV, indicating the presence of acidic sites which can be dissociated in the alkaline pH. The ZP of products A, B and C was in the range of −9.8 to −19.8 mV at pH 3 and increased to a range of −18 to −28.5 mV at pH 11. ZP values of −15.57 to −21.73 mV have been reported for nanofibres prepared from cotton.35 A recent report by Satyamurthy et al.36 showed that a high ZP of −69.7 mV on the surface of cellulose nanowhiskers prepared by sulphuric acid hydrolysis indicated the presence of sulphate groups on its surface.36 In contrast, product C (Fig. 5c) exhibited a lower ZP value of −28.5 mV suggesting a lower level of sulphate groups on NFC, a conclusion supported by lack of bound sulphate groups in the FTIR spectra at 1210 cm−1 (Fig. 6). Consequently the short range van der Waals' forces were dominant on the particles of product C (Fig. 5c) leading to agglomeration.37 The differences in the ZP values of products B and C can be explained by the treatment conditions employed to reduce particle size.15
![FTIR spectra (4000–650 cm−1) of untreated fibre, products (A, B, C, and D) and reference cellulose showing changes as a result of the four extraction protocols [spectral correlation of test samples with reference cellulose: A: 0.9673; B: 0.9716; C: 0.7838; D: 0.9732].](/image/article/2012/RA/c2ra20716h/c2ra20716h-f6.gif) |
| | Fig. 6 FTIR spectra (4000–650 cm−1) of untreated fibre, products (A, B, C, and D) and reference cellulose showing changes as a result of the four extraction protocols [spectral correlation of test samples with reference cellulose: A: 0.9673; B: 0.9716; C: 0.7838; D: 0.9732]. | |
3.6. FTIR spectroscopy
Overlays of FTIR spectra of four NFC products, unextracted fibre and reference cellulose sample are presented in Fig. 6. The dominant spectral bands at 3340 and 1033 cm−1 were due to stretching vibrations of OH and C–O stretching from ether groups.10,38 The peak in the region of 2898–2819 cm−1 was a result of the antisymmetric and symmetric vibration of CH2 groups.16 The vibration at 2850 cm−1 originating from C–H stretching in lignin was not detected in the treated samples, indicating removal of that fraction.39 The minor peak at 1734 cm−1 in unextracted fibre can be attributed to acetyl and uronic ester (C![[double bond, length as m-dash]](https://www.rsc.org/images/entities/char_e001.gif) O) groups in hemicellulose along with the ester linkage of carboxylic group of ferulic and ρ-coumaric acids of lignin.16,38 However the four NFC products showed weak absorbance in this band indicating residual hemicellulose fractions after the chemical and physical treatment steps (Fig. 6). The peaks at 1646 cm−1 in the untreated sample corresponded to adsorbed water (H–O–H deformation) and the reduction in spectral intensity of the extracted and reference cellulose samples was also linked to the removal of hemicellulose fractions during processing. The shoulder/peak at 1545 cm−1 was also lost in the extracted NFC compared to the untreated sample due to the removal of aromatic compounds/CH bend.16 The band at 1429 cm−1 in the untreated sample represents C–H deformation in lignin and also deformation of this bond in carbohydrates in the presence of CO as it is shifted down from the normal position.38,40 The peaks at 1370 and 1318 cm−1 indicated C–H asymmetric deformation.38 The peaks at 1201, 1160, 1104, 1053, 1032 and 996 cm−1 were not well defined in the control sample (Fig. 6) but peak definition improved after the extraction treatments, due to pyranose ring stretching vibration of C–O–C in cellulose.40 Similarly the peak at 898 cm−1 showed improved sharpness after chemical and physical treatments and this band was linked to rocking vibrations of CH2 in the cellulose.16 The peaks at 715 and 660 cm−1 were due to out of plane deformation of OH⋯O hydrogen bonding. The acid extracted product C did not show bound sulphate groups at 1210 cm−1 as the treated material was first neutralised with NaOH before washing with distilled water but showed absorption peaks at 1103, 1030 and 992 cm−1, indicating enhanced asymmetric stretching of the ring and vibration of C–O in celluloses.40 The extracted NFC products were similar to the reference cellulose sample in a majority of spectral bands as shown by high correlation value (r = 0.9) for the four samples respectively.
O) groups in hemicellulose along with the ester linkage of carboxylic group of ferulic and ρ-coumaric acids of lignin.16,38 However the four NFC products showed weak absorbance in this band indicating residual hemicellulose fractions after the chemical and physical treatment steps (Fig. 6). The peaks at 1646 cm−1 in the untreated sample corresponded to adsorbed water (H–O–H deformation) and the reduction in spectral intensity of the extracted and reference cellulose samples was also linked to the removal of hemicellulose fractions during processing. The shoulder/peak at 1545 cm−1 was also lost in the extracted NFC compared to the untreated sample due to the removal of aromatic compounds/CH bend.16 The band at 1429 cm−1 in the untreated sample represents C–H deformation in lignin and also deformation of this bond in carbohydrates in the presence of CO as it is shifted down from the normal position.38,40 The peaks at 1370 and 1318 cm−1 indicated C–H asymmetric deformation.38 The peaks at 1201, 1160, 1104, 1053, 1032 and 996 cm−1 were not well defined in the control sample (Fig. 6) but peak definition improved after the extraction treatments, due to pyranose ring stretching vibration of C–O–C in cellulose.40 Similarly the peak at 898 cm−1 showed improved sharpness after chemical and physical treatments and this band was linked to rocking vibrations of CH2 in the cellulose.16 The peaks at 715 and 660 cm−1 were due to out of plane deformation of OH⋯O hydrogen bonding. The acid extracted product C did not show bound sulphate groups at 1210 cm−1 as the treated material was first neutralised with NaOH before washing with distilled water but showed absorption peaks at 1103, 1030 and 992 cm−1, indicating enhanced asymmetric stretching of the ring and vibration of C–O in celluloses.40 The extracted NFC products were similar to the reference cellulose sample in a majority of spectral bands as shown by high correlation value (r = 0.9) for the four samples respectively.
3.7. Thermogravimetric analysis
The thermal characteristics of NFC products resulting from the four treatment protocols are presented in Table 4. The differences in the peak pyrolysis temperatures, weight loss and rate of weight loss illustrated that the thermal stability of the products increased after chemical and physical treatments compared to untreated fibres (Table 4). The onset of degradation temperatures of the test samples were observed at 205, 196, 210, 213, 150 and 210 °C for A, B, C, D, untreated fibre and cellulose respectively, indicating compositional differences (Fig. 7a,b). The changes in weight loss, peak pyrolysis temperature, the maximum rate of decomposition and residue left in the crucible of A, B, C, D, untreated fibre and reference cellulose are presented in Table 4. The untreated fibre showed significantly the lowest weight loss (54.4%; P < 0.001), peak decomposition temperatures (336 °C; P < 0.001) and the maximum rate of weight loss (0.35 mg min−1; P < 0.001) compared to the other materials including the reference cellulose, indicating the presence of amorphous hemicellulose, lignin, water soluble fractions and minerals which caused weight loss initiation at 150 °C (Table 4). Product B showed significantly (P < 0.01) the lowest weight loss compared to the other three products (Table 4), possibly due to lower residual hemicellulose content, as indicated by the early onset of degradation (Fig. 7b). Many studies41,42 have reported that the major components pyrolyse at different temperature bands, e.g. for the reference cellulose and product D, decomposition initiated at 213 °C and continued until 370 °C42 with a peak decomposition at 355 °C. Table 4 shows maximum weight loss in the 140–490 °C range for cellulose (78.8%) and product D (74.8%). The onset of hemicellulose degradation started at 150 °C and persisted to 300 °C42 typically, as a shoulder in the unextracted grass (230 °C) and product C (280 °C), showing 26.0% and 16.4% of residue respectively. The low lignin (30–70 g kg−1)39,43 content in grass fibres would have degraded from 200 to 700 °C although most of the weight loss would have taken place at < 400 °C.42 However, lignin gives a broad degradation profile with a low rate of weight loss. Only product C exhibited a minor secondary weight loss peak at 660 °C (Fig. 7a), due to the breakdown of residual carbon-mineral complex left on the NFC samples. The residue left in the crucible was significantly (P < 0.001) the highest (26.0%) for the untreated fibre compared to the NFCs including product D with the lowest residue (14.5%, Table 4). This may be due to the extensive removal of S and Si by the four treatment steps. These results are consistent with the X-ray microanalysis (Table 3) and FTIR results (Fig. 6) showing similar characteristics of reference cellulose.
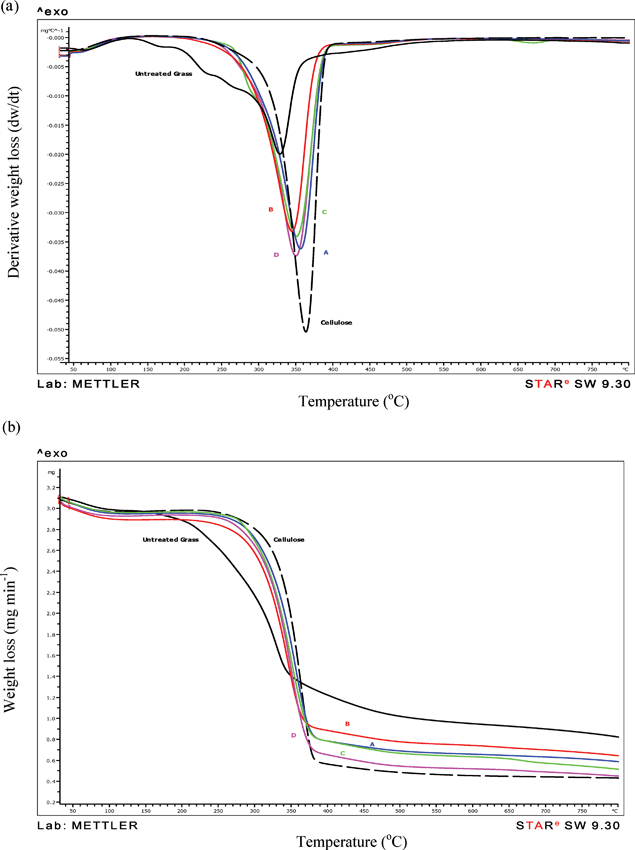 |
| | Fig. 7 Overlays of TG derivative curves of products A, B, C, D, untreated grass fibre and reference cellulose, showing gradual shift in the primary peak decomposition temperature of the samples compared to the reference cellulose; samples analysed in nitrogen; note the minor peak at 670 °C showing the breakdown of residual carbon/mineral complex for Product C, (b) Overlay of TG weight loss curves showing differences in the onset and rate of weight loss. | |
Table 4 Comparison of weight loss (%) and peak degradation temperature 140–490 °C, the rate of weight loss and residue of NFC products (mean of 3 replicate samples) prepared from ryegrass, untreated fibre and reference cellulose to show changes in the composition; a minor secondary decomposition peak was present at near 670 °C
| Product |
Weight Loss (%) |
Peak T °C |
Maximum rate of weight loss (mg min−1) |
Residue (%) |
|
SEM = standard error of means
Significant at P < 0.01
Significant at P < 0.001
|
| A |
70.0 |
361.4 |
0.72 |
18.7 |
| B |
65.6 |
349.9 |
0.65 |
20.9 |
| C |
70.6 |
356.6 |
0.68 |
16.4 |
| D |
74.8 |
355.4 |
0.74 |
14.5 |
| Untreated fibre |
54.4 |
336.5 |
0.35 |
26.0 |
| Cellulose |
78.8 |
371.7 |
0.99 |
13.7 |
| SEMa |
1.99 b |
2.29c |
0.01c |
0.96 c |
3.8. X-ray diffraction
Three main reflections at 2θ = 11.7°, 16.4° and 22.4° were observed for all the nanofibres corresponding to a cellulose I structure (Fig. 8). Pre-treatment of the fibre with NaOH, followed by a mixture of HCl/H2SO4 acids, increased the intensity of X-ray patterns of product C (71) compared to the physical and high pressure shearing treatments of products A (65) and B (70) respectively (Fig. 8). The crystallinity of product D was the lowest (59) due to the excessive breakdown of cellulose structure during the four chemical treatment steps. Crystallinity of grass nanocellulose increased with the microfluidisation treatment confirming earlier results.10
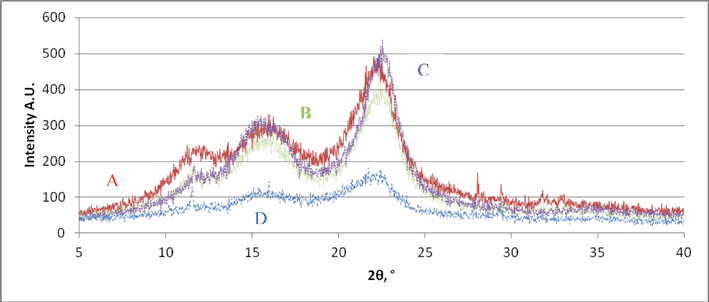 |
| | Fig. 8 X-ray diffraction patterns of the NFC products A (red), B (green), C (violet) and D (blue) showing differences at three main reflections at 2θ = 11.7°, 16.4° and 22.4° corresponding to cellulose I structure. | |
3.9. Mechanical properties of PVA-NFC composites
The mechanical properties of the pure PVA films prepared in this study were significantly different from reported values 12 of tensile strength (60–90 MPa) and modulus (2–4 GPa) possibly due to the type of PVA used, differences in molecular mass and variations in formulation of the proportion of plasticisers such as polypropylene glycol and glycerol contained in the PVA matrix.9 There were significant improvements in the modulus of PVA-NFC composites from all four NFC preparations at both 1 and 5 wt% content compared to the PVA control as shown in Table 5. The tensile stress at break for the nanocomposites prepared from products A and B at 5 wt% was also noticeably enhanced compared to PVA control, confirming previous reports.9,13,44,45 Tensile stress at yield increased markedly relative to the control at both fibre addition levels (Table 5), again demonstrating the high reinforcing efficiency of the cellulose nanofibres. This results from the high surface area of the NFC and extensive hydrogen bonding with the PVA matrix leading to the formation of a rigid network. There is a clear dependency of the mechanical properties on NFC addition level. However, the superior modulus performance of NFC preparation A at 5 wt% (Fig. 9) could be attributed to the residual hemicellulose present in this material which helped to maintain the suspension in the colloidal state,10 permitting a higher level of compatibility between NFC and matrix aided by the improved interfacial bonding.27,46
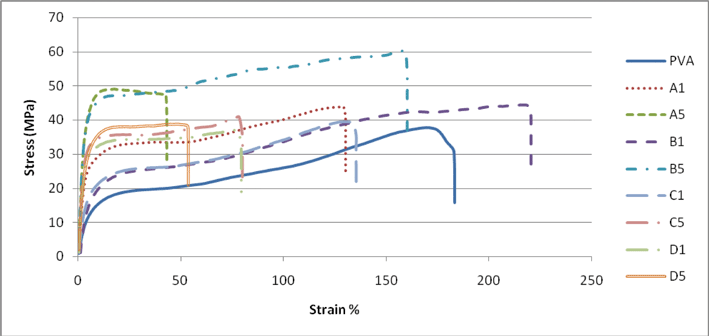 |
| | Fig. 9 Stress–strain curves for PVA and PVA nanocomposites containing NFC products A, B, C and D showing differences in performance at two concentrations 1 and 5%; note the performance of B1 and B5. | |
Table 5 Mechanical analysis of PVA and NFC-PVA composites containing 1 and 5 wt% of NFC products A, B, C and D
| Materials |
Modulus (MPa)a |
Tensile stress at yield (MPa) |
Tensile stress at break (MPa) |
|
Tangent to slope
|
| PVA |
322 ± 7 |
17 |
38 |
| PVA/A1 |
890 ± 10 |
32 |
44 |
| PVA/B1 |
370 ± 13 |
25 |
44 |
| PVA/C1 |
477 ± 16 |
24 |
40 |
| PVA/D1 |
1277 ± 114 |
34 |
38 |
| PVA/A5 |
1695 ± 36 |
46 |
48 |
| PVA/B5 |
819 ± 13 |
47 |
59 |
| PVA/C5 |
896 ± 43 |
35 |
41 |
| PVA/D5 |
1122 ± 157 |
36 |
39 |
This observation is supported by the low intensity (CO) peak/shoulder at 1732 nm for the three products (product B, C and D; Fig. 5), lower onset of degradation of product B (196 °C) and weight loss (65.6%) compared to the other three products (Table 4). The residual hemicelluloses and lignin fractions in products C and D would have been extensively hydrolysed by the acid treatments compared to A and B. The NFC composites prepared with products A, B and D were transparent, indicating uniform dispersion but aggregation of nanofibres resulted in a darker colour of the composites containing product C compared to the other 3 products (Fig. 10).
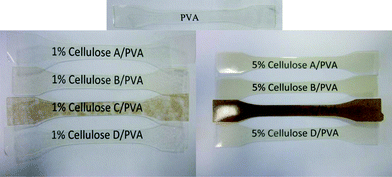 |
| | Fig. 10 Appearance of NFC-PVA composite test samples containing 1 and 5 wt% showing the extent of nanocellulose dispersion in the PVA matrix especially for product C at 5 wt%. | |
3.10. DMTA of PVA-NFC composites
The performance of pure PVA film compared to NFC reinforced composites is presented in Table 6, showing changes in storage modulus (MPa) and tan δ peaks in a temperature range of −20 to 70 °C prepared by conditioning at 50% RH and drying at 55 °C.9,47 The tan δ is defined as the ratio of loss modulus to storage modulus which is a measure of damping of a material.47
Table 6 DMTA results for PVA and NFC-PVA composites containing products A, B, C and D at 1 and 5 wt% NFC
| Materials |
Storage modulus (MPa) 50% RH |
Storage modulus (MPa) Dried at 55 °C |
| −20 °C |
35 °C |
70 °C |
Tan δ peak °C |
−20 °C |
35 °C |
70 °C |
Tan δ peak °C |
| PVA |
8828 |
793 |
168 |
31 |
7129 |
4115 |
448 |
48 |
| PVA/A1 |
7241 |
553 |
133 |
28 |
8276 |
5309 |
636 |
52 |
| PVA/B1 |
7372 |
391 |
129 |
24 |
6342 |
3909 |
545 |
52 |
| PVA/C1 |
8468 |
643 |
162 |
29 |
8353 |
4826 |
447 |
52 |
| PVA/D1 |
7545 |
731 |
165 |
30 |
8783 |
5543 |
559 |
53 |
| PVA/A5 |
7735 |
503 |
192 |
33.3 |
6562 |
4784 |
869 |
64 |
| PVA/B5 |
2842 |
433 |
164 |
19.0 |
9101 |
6620 |
1107 |
100 |
| PVA/C5 |
7986 |
835 |
260 |
32.8 |
7532 |
5590 |
1208 |
75 |
| PVA/D5 |
6668 |
874 |
254 |
34.1 |
8271 |
5515 |
859 |
56 |
There are clear differences in storage modulus for all the materials depending on whether or not water was present. In samples conditioned at 50% RH there was a strong plasticising effect from residual water, which appeared to mask the reinforcing effect of the NFC (Table 6). Storage modulus and tan δ were broadly similar for all the compositions except for products B, which were consistently lower at both fibre addition levels studied and over the 35–70 °C range (Table 6). The origins of this are not known. However, in materials dried at 55%, overall there was a large increase in both storage modulus and tan δ, the latter reflecting an increase in glass transition temperature (Tg) of the PVA. The enhancement in these materials was particularly pronounced at 5wt% fibre (products B and C) loading and at 70 °C, i.e. above the Tg of PVA (Table 6). The effect on storage modulus and large increase in tan δ observed, (Table 6), results from immobilisation of the PVA chains due to the strong fibre-matrix interactions and network formation as mentioned earlier, which is disrupted when water is present. Recently Qua et al.9 reported that improved performance in modulus of PVA nanocomposites was only detected at 5% level of NFC prepared from flax and microcrystalline cellulose. The average tan δ peak temperatures for NFC-PVA composite, product B was 52 °C higher at 5 wt% compared to pure PVA sheets (Table 6).
Previous studies have shown that the preparation method of nanocellulose will influence the aspect ratio of NFC and consequently the mechanical performance of a nanocomposite.8,20 Zimmermann et al.20 have studied the influence of a process employing mechanical defibrillation on the properties of nanocomposites filled with cellulose fibrils isolated from a sulphite pulp. The NFC with higher surface area and crystallinity resulted in stiffer material compared to materials at the same NFC content, due to higher contact surface area and structural integrity, allowing extensive network formation. This can significantly enhance the mechanical performance of the nanocomposite films. Their results have indicated that the Young's modulus of nanocomposites reinforced with mechanically isolated fibrils, increased up to a factor of 2.5 (fibril content 10 wt%) for the PVA-nanocomposites, and up to a factor of 3 (fibril content 20 wt%) for hydroxyl-propyl cellulose composites compared to the neat matrix.20 Our results have shown that similar rate of improvements in performance of NFC-PVA composites were achieved at a lower NFC content of 5 wt% (Tables 5 and 6) possibly due to small (2.9–9.1 nm) diameter and high (308 nm–4.6 μm) NFC length.
3.11. Green biorefining
Previous reports3–6 on the evaluation of sustainable green biorefineries of grass have shown that the concept was viable if the process structures are linked to multiple product ranges (i.e. high and low value) along with the conventional use of grass, as fodder for animals. Under various scenarios and economic assumptions, O'Keefe et al.4 have shown that farmers in Ireland could be offered more than the production cost to maintain biomass availability within the catchment area supplying the green biorefining plant. They concluded that the choice of product combinations was of crucial importance for the green biorefinery design. In the proposed scenario and processing assumptions, products, such as NFC, amino acids, lactic acid, bioethanol, biogas and fibre for insulation, can be manufactured using fresh and/or ensiled ryegrass with the possibility of shifting production from biogas to fibre fractionation depending on demand for NFC/reinforced products.1,2,22 The current bottleneck in the exploitation of NFC is the need for an environmentally friendly process suitable for large scale production.20 Although this objective has been the focus of several research groups and companies in Europe, this study is the first to report mass, energy and chemical balances of a green biorefinery for NFC production using ryegrass as an input material. The required inputs for NFC production could be reduced by adopting two pre-treatments of the fibre fraction with NaOH and polysaccharide degrading enzymes, followed by an efficient mechanical and high pressure process step.48–50 The overall processing cost of biorefining ryegrass silage or grass should take into account the utilisation of juice for either high value fractions or as feedstock for an anaerobic digester, and the processing of the fibre fraction for high and low value products.
4. Conclusion
This study has successfully demonstrated the process steps required for biorefining ryegrass to produce fibre cakes, as raw material for NFC production. The product B has been identified as the most promising material due to enhanced thermal and mechanical performance of the polymer matrix compared to the other three products. In addition, the NFC-PVA composite prepared with 5 wt% content of product B showed enhanced uniformity and filler dispersion compared with pure PVA sheets and other NFC-PVA composites. The chemical/mechanical/microfluidiser treatment of grass fibre is a relatively green process compared to the 2 and 4 stage chemical treatments, which required higher inputs of water for products C and D. Product B has a high energy requirement, however this could be significantly reduced by employing an enzyme processing stage followed by pilot scale microfluidiser unit.
The composites containing nanofillers i.e. fibrillated cellulose and residual hemicelluloses, could be used for manufacturing high strength/value products, such as packaging, drain pipes, gutters and flower pots. Large scale production of NFC could be carried out using a green biorefinery protocol. Preliminary assessments of the mass, water and energy balances along with required processing time of the biorefining protocol have been carried out, but the environmental impact of the processing steps will require further evaluation, along with a comprehensive economic analysis to determine the optimal and environmentally sustainable processing route based on a viable economy of scale.
Acknowledgements
We wish to acknowledge Department of Agriculture and Rural Development and Innovation Fund for Northern Ireland for financial support. We wish to thank Dr D. Cysneiros, Marie Curie researcher, Department of Microbiology, National University of Ireland, Galway for assistance during the development of protocols for pilot scale processing. In addition we wish to acknowledge Drs M. Camlin, T. Gilliland and Mr. G. Hoppe for comments, providing samples and Dr G. Brennan (QUB), Mr. S. McFarland (QUB) and Mr. M. Cleland for technical support.
References
- A. Charlton, R. Elias, S. Fish, P. Fowler and J. Gallagher, Chem. Eng. Res. Des., 2009, 87, 1147–1161 CrossRef CAS.
- H. S. S. Sharma, G. Lyons and C. McRoberts, Chem. Eng. Res. Des., 2011, 89, 2309–2321 CrossRef CAS.
- S. O'Keeffe, R. P. O. Schulte, J. P. M. Sanders and P. C. Struik, Biomass Bioenergy, 2011, 35, 4712–4723 CrossRef.
- S. O'Keeffe, R. P. O. Schulte, S. T. J. Lalor, P. O'Kiely and P. C. Struik, Biomass Bioenergy, 2011, 35, 4699–4711 CrossRef.
- L. Halasz, G. Povoden and M. Nardodoslawsky, Resour., Conserv. Recycl., 2005, 44, 293–307 CrossRef.
- S. Kromus, B. Wachter, W. Koschuha, M. Mandle, C. Krotschecka and M. Narodoslawsky, Chem. Biochem. Eng. Q., 2004, 18, 7–12 CAS.
-
J. J. M. H. Ketelaars and B. Rutgers, Bio-raffinage van gras: een verkenning van mogelijkheden en perspectieven. Nota 159, Plant Research International B.V., Wageningen, 2002 Search PubMed.
- G. Siqueira, J. Bras and A. Dufresne, Polymers, 2010, 2, 728–765 CrossRef CAS.
- E. H. Qua, P. R. Hornsby, H. S. S. Sharma, G. Lyons and R. D. McCall, J. Appl. Polym. Sci., 2009, 113, 2238 CrossRef CAS.
- E. H. Qua, P. R. Hornsby, H. S. S. Sharma and G. Lyons, J. Mater. Sci., 2011, 46, 6029–6045 CrossRef CAS.
- S. J. Eichhorn, A. Dufresne, M. Aranguren, N. E. Marcovich, J. R. Capadona, S. J. Rowan, C. Weder, W. Thielemans, M. Roman, S. Renneckar, W. Gindl, S. Veigel, J. Keckes, H. Yano, K. Abe, M. Nogi, A. N. Nakagaito, A. Mangalam, J. Simonsen, A. S. Benight, A. Bismarck, L. A. Berglund and T. Peijs, J. Mater. Sci., 2010, 45, 1–33 CrossRef CAS.
- A. Bhatnagar and M. Sain, J. Reinf. Plast. Compos., 2005, 24, 1259–1268 CrossRef CAS.
- B. Deepa, E. Abraham, B. M. Cherian, A. Bismarck, J. J. Blaker, L. A. Pothan, A. L. Leao, S. F. de Souza and M. Kottaisamy, Bioresour. Technol., 2011, 102, 1988–1997 CrossRef CAS.
- X. M. Dong, J-F Revol and D. G. Gray, Cellulose, 1998, 5, 19–32 CrossRef CAS.
- J. Zhang, T. J. Elder, Y. Pu and A. J. Ragauskas, Carbohydr. Polym., 2007, 69, 607–611 CrossRef CAS.
- A. Alemdar and M. Sain, Bioresour. Technol., 2008, 99, 1664–1671 CrossRef CAS.
- S. Azizi, S. My Ahmed, F. Alloin and A. Dufresne, Biomacromolecules, 2005, 6, 612–626 CrossRef.
- A. Dufresne, J. Caville and M. Vignon, J. Appl. Polym. Sci., 1997, 64, 1185–1194 CrossRef CAS.
- Y. Habibi, L. A. Lucia and O. J. Rojas, Chem. Rev., 2010, 110, 3479–3500 CrossRef CAS.
- T. Zimmermann, E. Pohler and T. Geiger, Adv. Eng. Mater., 2004, 6, 754–761 CrossRef.
- M. Neureiter, H. Danner, S. Fruhauf, S. Kromus, C. Thomasser, R. Braun and M. Narodoslawsky, Bioresour. Technol., 2004, 92, 21–29 CrossRef CAS.
- H. S. S. Sharma, D. McCall, F. Andrews, E. Carmichael, G. Lyons and C. McRoberts, J. Ind. Crop Prod., 2012, 36, 476–484 CrossRef CAS.
- P. J. Van Soest and R. H. Wine, J. Assoc. Off. Agric. Chem., 1967, 50, 50–55 CAS.
- K. R. Christian, Fld. Stn. Rec. Div. Pl. Ind. CSIRO (Aust.), 1971, 10, 29–34 CAS.
- H. S. S. Sharma, G. Lyons, C. McRoberts, D. McCall, E. Carmichael, F. Andrews and R. McCormack, J. Appl. Phycol., 2012 DOI:10.1007/s10811-011-9744-6.
- C. F. Liu, F. Xu, J. X. Sun, J. L. Ren, S. Curling, R. C. Sun, P. Fowler and M. S. Baird, Carbohydr. Res., 2006, 341, 2677–2687 CrossRef CAS.
- A. Dufresne, J. Nanosci. Nanotech., 2006, 6, 322–330 CAS.
- J. Araki, M. Wada, S. Kuga and T. Okano, Colloids Surf., A, 1998, 142, 75–82 CrossRef CAS.
- J. Bras, D. Viet, C. Bruzzese and A. Dufresne, Carbohydr. Polym., 2011, 84, 211–215 CrossRef CAS.
- T. Taniguchi and K. Okamura, Polym. Int., 1999, 47, 291–294 CrossRef.
-
B. J. Berne and R. Pecora, Dynamic light scattering with applications to chemistry, biology and physics, Wiley Interscience, New York, 1976 Search PubMed.
- R. Xu, Langmuir, 1998, 14, 2593–2597 CrossRef CAS.
- L. Jiang, L. Gao and J. Sun, J. Colloid Interface Sci., 2003, 260, 89–94 CrossRef CAS.
- H. E. Ries, Nature, 1970, 226, 72–73 CrossRef CAS.
- G. Buschle-Diller, M. K. Inglesby and Y. Wu, Colloids Surf., A, 2005, 260, 63–70 CrossRef CAS.
- P. Satyamurthy, P. Jain, R. H. Balasubramanya and N. Vigneshwaran, Carbohydr. Polym., 2011, 83, 122–129 CrossRef CAS.
-
A. Hebeish and J. T. Guthrie, The chemistry and technology of cellulosic copolymers, Springer-Verlag, New York, 1981 Search PubMed.
- X. F. Sun, F. Xu, R. C. Sun, P. Fowler and M. S. Baird, Carbohydr. Res., 2005, 340, 97–106 CrossRef CAS.
- F. Xu, Q. A. Zhou, J. X. Sun, C. F. Liu, J. L. Ren, R. C. Sun, S. Curling, P. Flowler and M. S. Baird, Process Biochem., 2007, 42, 913–918 CrossRef CAS.
- B. Xiao, X. F. Sun and R. C. Sun, Polym. Degrad. Stab., 2001, 74, 307–319 CrossRef CAS.
- T. Nguyen, E. Zavarin and E. M. Barrall, J. Macromol. Sci. R.M.C. 20, 1981, 1, 1–65 Search PubMed.
- H. Yang, R. Yan, H. Chen, D. H. Lee and C. Zheng, Fuel, 2007, 86, 1781–1788 CrossRef CAS.
-
W. Holmes, Grass its production and utilization. Blackwell Scientific Publications, England, 1980 Search PubMed.
-
Q. Cheng, D. DeVallance, J. Wang and S. Wang, Advanced Cellulosic Nanocomposites Materials. In: Advances in Composite Materials, INTECH, West Virginia, 2011 Search PubMed.
- M. A. Ibrahim, A. Dufresneb, W. K. El-Zawawya and F. A. Agblevor, Carbohydr. Polym., 2010, 81, 811–819 CrossRef CAS.
- E. Dinand, H. Chanzy and R. M. Vignon, Food Hydrocolloids, 1999, 13, 3275–3283 CrossRef.
- M-J. Chao and B-D. Park, J. Ind. Eng. Chem., 2011, 17, 36–40 CrossRef.
- G. Siqueira, S. Tapin-Lingua, J. Bras, D. da Silva Perez and A. Dufresne, Cellulose, 2010, 17, 1147–1158 CrossRef CAS.
- H. S. S. Sharma, Am. Ass. Text. Chem. Color. Rev., 2005, 5(43), 56–60 Search PubMed.
- K. Kernaghan, H. S. S. Sharma and L. Whiteside, Enzyme Microb. Technol., 2006, 39, 1373–1385 CrossRef CAS.
Footnote |
| † Electronic supplementary information (ESI) available. See DOI: 10.1039/c2ra20716h |
|
| This journal is © The Royal Society of Chemistry 2012 |
Click here to see how this site uses Cookies. View our privacy policy here.