Visible light driven photocatalytic evolution of hydrogen from water over CdS encapsulated MCM-48 materials
Rui
Peng
*a,
Dan
Zhao
b,
Jonas
Baltrusaitis
c,
Chia-Ming
Wu
a and
Ranjit T.
Koodali
*a
aDepartment of Chemistry, University of South Dakota, Vermillion, South Dakota 57069, USA. E-mail: Ranjit.Koodali@usd.edu; Fax: 1-605-677-6397; Tel: 1-605-677-6189
bDepartment of Chemical Engineering, Ningbo Institute of Technology, Ningbo 315211, China
cDepartment of Chemistry, University of Iowa, Iowa City, Iowa 52246, USA
First published on 26th April 2012
Abstract
CdS encapsulated cubic MCM-48 mesoporous photocatalysts were prepared by a post-impregnation method. Powder X-ray diffraction (XRD), transmission electron microscopy (TEM), nitrogen adsorption isotherm, UV-visible diffuse reflectance spectroscopy (DRS), FT-IR spectrometry, X-ray photoelectron spectroscopy (XPS), atomic absorption spectroscopy (AAS), and photoluminescence (PL) spectroscopy were employed for the characterization of the CdS incorporated MCM-48 siliceous materials. MCM-48 was loaded with different amounts of CdS. In the current study, all the samples showed photocatalytic activity under visible light (λ > 400 nm) irradiation for production of hydrogen from splitting of water in the absence of Pt, which is usually used in photocatalytic splitting of water. The photocatalytic activity of the CdS incorporated MCM-48 mesoporous photocatalysts was found to be dependent on the CdS loading and the pore size of MCM-48 siliceous support. The highest solar hydrogen evolution rate by visible light irradiation from the splitting of water was determined to be 1.81 mmol h−1 gCdS−1 and the apparent quantum yield was estimated to be 16.6%.
1. Introduction
To maintain the sustainable development of human beings, the shortage of the fossil energy sources and global environmental issues needs to be addressed.1 There is an urgent need to find a clean and non-polluting energy source. Hydrogen, which is completely carbon neutral, has been the subject of intense research.2 Since the ground breaking work of Fujishima and Honda,3 hydrogen generation from water has been extensively studied. A large number of semiconductors have been reported for their ability to split water by harnessing solar energy.4–8 However, most of the semiconductors that have been studied can be activated only by UV light. It is well known that UV light constitutes less than 5% of the solar spectrum. Compared with UV light, visible light contains ∼45% of the solar energy. Therefore, the development of efficient visible light absorbing photocatalysts is a holy grail in this research field. A number of visible light driven semiconductor photocatalysts have been developed.9–12 Among them, metal chalcogenides, particularly CdS, has attracted a wealth of research attention due to their versatile utilization in several photocatalytic reactions.8,13–17 Nevertheless, they have a tendency to undergo photocorrosion, which is partly prevented by the use of sacrificial agents, such as sulfide and/or sulfite salts.18 This is because the photogenerated holes have a higher potential to oxidize CdS and form Cd2+ and S than oxidize water to oxygen. The photocorrosion process is detrimental to the activity of CdS. First, the amount of CdS decreases as it forms Cd2+ ions in solution and second, in several instances S is deposited on the surface of CdS. S absorbs visible light and prevents the effective absorption of light by CdS. Thus, photocorrosion limits the widespread applicability of CdS-based photocatalysts.19,20 Immense efforts have been made to overcome the above mentioned pitfalls and to increase hydrogen production.21–23 It has been demonstrated that the coupling of two semiconductors,24 for instance TiO2/CdS,25 ZnO/CdS,26 and ZnS/CdS,27 can result in an enhancement of the photocatalytic activity by optimizing the band gap structure and increasing the lifetime of the photoexcited electrons and holes. CdS has been incorporated in microporous and mesoporous materials. The advantages of encapsulating CdS into micro- or mesoporous host materials are numerous. First, the large surface area and uniform pore size of the support material facilitate the high dispersion of the CdS species and in addition the pore channels may confine the particle size of CdS.28 The high dispersion and confinement of particle size of CdS in the host materials are widely recognized as positive factors in photocatalytic processes.29–31 In addition, the porous host materials may reduce the recombination of photogenerated electrons and holes.32 The photoinduced electrons within CdS can migrate to the adjacent pores and leave the holes behind. Thus, the effective separation of photogenerated electron–hole pairs was found to increase the photocatalytic efficiency. Furthermore, utilization of micro- or mesoporous frameworks may also provide a certain degree of protection for CdS species and prevent them from undergoing photocorrosion due to less exposed surface area.21,33 So far, a number of CdS embedded micro- and mesoporous photocatalysts have been examined for photocatalytic splitting of water. Hoffmann et al. incorporated CdS into microporous zeolite-Y, zeolite-L, and mesoporous SBA-15.32 Fox et al. loaded CdS into zeolite-A and reported their photocatalytic activity.33 Lunawat et al. embedded CdS into SBA-15 as a novel photocatalyst.34 Hirai et al. introduced CdS into MCM-41 and Zn-doped SBA-15 and their photocatalytic hydrogen evolution has been reported.35–37 Guan et al. intercalated CdS into microporous ETS-4 and ETS-10 to enhance their stability.23,38 Zhang et al. assembled CdS with Al-HMS and evaluated the hydrogen evolution from the photodegradation of formic acid.39,40 Guo and co-workers developed CdS modified Ti-MCM-41 and zirconia titanium phosphate (ZTP) materials to generate hydrogen from water.41,42 Among the various mesoporous materials reported, the cubic phase, MCM-48 is an interesting choice of material as a support. The synthesis of the cubic MCM-48 materials is challenging in comparison with other M41S class of materials, such as MCM-41, and this has precluded the wide applicability of MCM-48 based materials for photocatalytic applications.MCM-48 based mesoporous materials with a long range ordered array of mesoscaled pores,43 large surface area,44 and uniform pore size45 have been considered as promising candidates in catalysis, sensors, electronic devices, drug delivery, separation, etc.46 Ti-MCM-48 have been studied for the photocatalytic reduction of CO2 with H2O47 and the catalytic performance of Fe-MCM-48 have been examined for phenol hydroxylation and Baeyer–Villiger oxidation of ketones.48–50 Our group has been working extensively with MCM-48 materials. For instance, we have reported the facile synthesis of siliceous MCM-48 and the use of Ti-MCM-48 and W-MCM-48 mesoporous materials for photocatalytic performance for hydrogen evolution from the decomposition of water under UV radiation.51–53 Recent work from our group indicates that the MCM-48 material with its interconnected three dimensional pore structure favorable mass transfer kinetics compared with the uni-dimensional pores that exist in hexagonal form of MCM-41.54 The photocatalytic activity of Ti-MCM-48 was found to be superior to that of Ti-MCM-41. This was consistent with previous reports.55,56 It also has to be pointed out that the facile synthesis of MCM-48 materials is very challenging since the cubic phase is formed only under a very narrow range of compositions and experimental conditions. Furthermore, post-synthesis modification of MCM-48 often results in destruction of the cubic phase. These factors have limited the applicablity of MCM-48 materials in catalytic reactions and indeed literature abounds in the use of MCM-41 materials as supports in comparison with MCM-48 materials. A drawback of our previous reports using Ti-MCM-48, W-MCM-48, and Ti-MCM-41 was that these materials required near UV or UV light for excitation. Thus, it is important to explore the use of small bandgap semiconductors, such as CdS, and disperse them in the MCM-48 matrix and evaluate their performance for solar hydrogen production. To the best of our knowledge, thus far, no work on CdS encapsulated MCM-48 mesoporous materials for visible light driven photocatalytic hydrogen generation has been reported. In the present work, the effect of CdS loading and the effect of pore sizes of MCM-48 was examined for photocatalytic hydrogen evolution from the cleavage of water. Towards this purpose, two sets of CdS incorporated MCM-48 mesoporous materials were prepared. The first set includes four samples that contain different Si/CdS ratios but have similar pore sizes. The second set contains four samples that possess the same amount of CdS loading but contain different pore sizes of MCM-48 mesostructured silica.57 We have determined that both sets of samples are effective for photocatalytic hydrogen evolution from water under visible light irradiation without Pt. The physico-chemical properties of the two series of samples have been investigated using a wide selection of techniques, ranging from powder X-ray diffraction (XRD), BET surface area analysis, atomic absorption spectroscopy (AAS), UV-vis diffuse reflectance spectra (DRS), photoluminescence (PL), FT-IR spectroscopy, X-ray photoelectron spectroscopy (XPS), and transmission electron microscopy (TEM) and a structure–activity relationship was obtained.
2. Experimental
2.1 Materials
Tetraethyl orthosilicate (TEOS, 98%), methanol, and 1-butanol were obtained from Acros. Cetyltrimethylammonium bromide (CTAB, 98%) was purchased from Alfa Aesar. Pluronic (P123) was obtained from Aldrich. Ammonium hydroxide, hydrochloric acid, cadmium acetate dihydrate, and thiourea were obtained from Fisher Scientific. Ethanol was produced by Pharmo-AAPER. Deionized water was used throughout this study. All the chemicals were used without further purification unless otherwise noted.2.2 Synthesis
2.3 Structural characterization
Powder X-ray diffraction patterns (XRD) of the synthesized photocatalysts were recorded on a Rigaku Ultima IV X-ray diffractometer using Cu-Kα radiation of λ = 1.540806 Å. The diffractometer was operated at 40 kV and 40 mA and with a step width of 0.02° and the scan rate used was 0.24°/min. N2 adsorption-desorption isotherms of the photocatalysts were performed on a Quantachrome Nova 2200e gas adsorption analyzer at 77 K. Samples were dried in an air oven overnight and degassed at 100 °C for at least 60 min., prior to the adsorption measurements. Surface area was determined using the Brunauer–Emmett–Teller (BET) method in the relative pressure range of (P/P0) = 0.05–0.30. The pore sizes were calculated by applying the Barrett–Joyner–Halenda (BJH) equation to the desorption isotherm. The pore volume was calculated from the amount of nitrogen adsorbed at the highest relative pressure (P/P0) ∼0.98. CdS content in the final MCM-48 materials was measured by using a Varian SpectrAA-200 atomic absorption spectrophotometer equipped with Cd cathode lamp. The working current used was 4 mA and the wavelength of excitation was 228.8 nm. 5 mg of the sample was digested with a known volume of HNO3 and then diluted to 25 mL. The concentration of the Cd2+ ions in the sample was determined from a calibration plot made previously. UV-Vis diffuse reflectance spectra were acquired using a Cary 100 Bio UV-Visible spectrophotometer with praying mantis accessory (Harrick Scientific). The transmission electron microscopy (TEM) image of a representative CdS-MCM-48 sample was obtained using an FEI Tecnai G2−Spirit instrument at an acceleration voltage of 120 kV. TEM images were recorded by first sonicating a dispersion consisting of CdS-MCM-48 sample in ethanol and then by carefully placing a drop of the sonicated dispersion on a carbon-coated copper grid (mesh size = 200). This was allowed to air dry overnight before transferring to the vacuum chamber of the TEM instrument. A custom-designed Kratos Axis Ultra X-ray photoelectron spectroscopy (XPS) system was used in evaluating the oxidation state and chemical environment of the CdS species in the MCM-48 material. Briefly, the surface analysis chamber is equipped with monochromatic radiation at 1486.6 eV from an aluminum Kα source using a 500 mm Rowland circle silicon single crystal monochromator. The X-ray gun was operated using a 15 mA emission current at an accelerating voltage of 15 kV. Low energy electrons were used for charge compensation to neutralize the sample. Survey scans were collected using the following instrument parameters: energy scan range of 1200 to −5 eV; pass energy of 160 eV; step size of 1 eV; dwell time of 200 ms and an X-ray spot size of 700 × 300 μm. One sweep was used to acquire a survey spectrum of all binding regions. High resolution spectra were acquired in the region of interest using the following experimental parameters: 20–40 eV energy window; pass energy of 20 eV; step size of 0.1 eV and dwell time of 1000 ms. The absolute energy scale was calibrated to the Cu 2p3/2 peak binding energy of 932.6 eV using an etched copper plate. Samples were pressed into indium foil and mounted onto a copper stub. These samples were placed in a sample transfer ante-chamber chamber first and then placed into the surface analysis chamber. FT-IR analysis was carried out using Bruker Alpha type spectrometer, which was equipped with single reflection diamond crystal and an all reflective gold coated optics. The sample was previously dried in an oven overnight at 70 ± 10 °C to eliminate moisture. The spectroscopy software OPUS6.5 was used for IR studies and 24 scans were run for each sample.2.4 Photocatalytic H2 evolution
The photocatalytic activities of the samples were examined in a gas-closed system. A catalyst sample of 40 mg was dispersed in 10 mL of deionized water and 10 mL ethanol in a 30 mL glass reactor. Prior to light irradiation, the photoreaction system was purged with high-pure argon for 30 min. to remove oxygen. A 300-W Xe lamp equipped with an optical cutoff filter (λ > 400 nm) was used as the source of visible light radiation. The reaction proceeded under vigorous stirring using a magnetic stirring rod coated with polytetrafluoroethylene (PTFE). The evolved H2 gas was analyzed using gas chromatograph, SRI 8610C (molecular sieve column, TCD detector, and argon as carrier gas). A calibration plot was used to quantify the amount of hydrogen produced.3. Results and discussion
3.1 Powder XRD analysis
The preparation of the cubic MCM-48 material is very sensitive to small changes in compositions and experimental conditions. We initially attempted to prepare CdS-MCM-48 by attempting to ion-exchange the surfactant molecules in the as-synthesized samples with Cd(NO3)2 and then sulfiding with either Na2S or thiourea. Our powder XRD results (not shown) indicate that the cubic phase was destroyed by this method of preparation. This can be rationalized by the fact that the nitrate ions are known as chaotropic ions (water-structure-breakers). Chaotropic ions are usually large in size and are expected to have strong dispersion interactions with the charged surfactant molecules at the interface. Thus, they adsorb strongly with the cationic surfactant and modulate the charge at the surfactant–inorganic interface. This has an impact on the morphology of the silica product since the silica species has to restructure to balance the changes in the charge densities at the interface. As a consequence, the cubic phase is destroyed. In order to preserve the cubic phase, we calcined the MCM-48 mesoporous materials and then impregnated them with Cd(OAc)2 and subsequently sulfidation was accomplished by using thiourea as the source of S. In addition, the post-synthetic modification provides an opportunity to use a pre-formed high quality cubic phase to incorporate CdS in them.Powder X-ray diffraction analysis was conducted to evaluate the cubic phase in the CdS-MCM-48 mesoporous materials. The low-angle XRD patterns of the post-impregnated CdS-MCM-48 samples and one representative sample with its parent Si-MCM-48 sample for better illustration are shown in Fig. 1A and Fig. 1B, respectively.
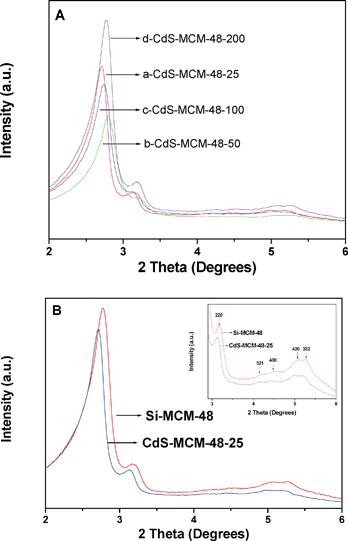 | ||
| Fig. 1 A) Low angle XRD patterns of (a) CdS-MCM-48-25, (b) CdS-MCM-48-50, (c) CdS-MCM-48-100, and (d) CdS-MCM-48-200. B) Low angle XRD patterns of CdS-MCM-48-25 sample and its parent Si-MCM-48 host. The inset shows data in the 2θ = 2.8–6°. | ||
It can be generally seen that the ordered arranged cubic phased mesopores were preserved in all of the CdS-MCM-48 samples after the incorporation of CdS species.
The plots of Si-MCM-48 and CdS-MCM-48 demonstrate the typical Bragg reflections of the mesopore MCM-48 materials with cubic Ia![[3 with combining macron]](https://www.rsc.org/images/entities/char_0033_0304.gif) d symmetry according to the diffraction peaks, which are indexed to [211], [220], [321], [400], [420], and [332] planes, respectively.58 The inset plots of Fig. 1B provide more visualized evidence for the typical XRD of MCM-48 mesoporous materials. After the incorporation of the CdS component, the characteristic Bragg reflections of the cubic phase were preserved in the CdS-MCM-48-25 sample. The strong d211 and weak d220 reflection peaks in the range of 2–3° indicate that the cubic phase of MCM-48 mesoporous materials was not affected by the incorporation of CdS species. Nevertheless, the intensity of peaks due to [211], [220], [321], [400], [420], and [332] planes decrease slightly. The decrease in intensity is attributed to a decrease in the scattering contrast between the pores and pore walls and is due to the loading of CdS species mainly into the pores of MCM-48 mesoporous materials. The high angle XRD patterns of the CdS-MCM-48 samples are depicted in Fig. 2.
d symmetry according to the diffraction peaks, which are indexed to [211], [220], [321], [400], [420], and [332] planes, respectively.58 The inset plots of Fig. 1B provide more visualized evidence for the typical XRD of MCM-48 mesoporous materials. After the incorporation of the CdS component, the characteristic Bragg reflections of the cubic phase were preserved in the CdS-MCM-48-25 sample. The strong d211 and weak d220 reflection peaks in the range of 2–3° indicate that the cubic phase of MCM-48 mesoporous materials was not affected by the incorporation of CdS species. Nevertheless, the intensity of peaks due to [211], [220], [321], [400], [420], and [332] planes decrease slightly. The decrease in intensity is attributed to a decrease in the scattering contrast between the pores and pore walls and is due to the loading of CdS species mainly into the pores of MCM-48 mesoporous materials. The high angle XRD patterns of the CdS-MCM-48 samples are depicted in Fig. 2.
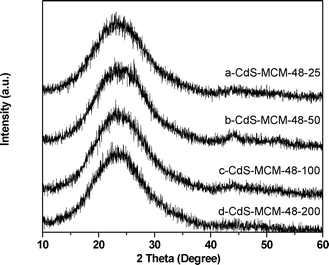 | ||
| Fig. 2 High angle XRD patterns of (a) CdS-MCM-48-25, (b) CdS-MCM-48-50, (c) CdS-MCM-48-100, and (d) CdS-MCM-48-200. | ||
The plots exhibit the characteristic peaks of amorphous SiO2 only, which is the main component of the host MCM-48 materials. This demonstrates that the CdS species are highly dispersed within the MCM-48 framework. The lack of observation of peaks due to CdS is attributed to a combination of factors that include high dispersion (due to large surface area of the MCM-48 support), very small particle sizes and amorphous nature of CdS.
We also prepared MCM-48 with various pore sizes. Fig. 3A and 3B depict the short range XRD patterns for the calcined MCM-48 mesostructured silica containing CdS with varying pore sizes.
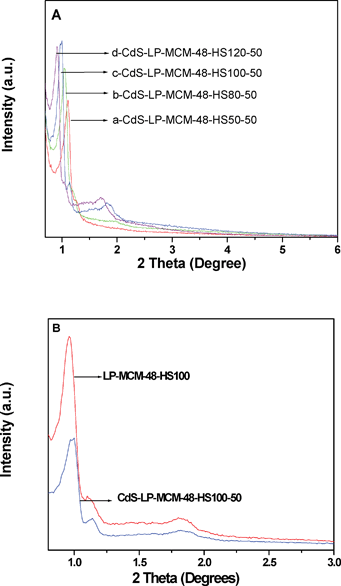 | ||
| Fig. 3 A) Low angle XRD patterns of (a) CdS-LP-MCM-48-HS50-50, (b) CdS-LP-MCM-48-HS80-50, (c) CdS-LP-MCM-48-HS100-50, and (d) CdS-LP-MCM-48-HS120-50. B) Low angle XRD patterns of CdS-LP-MCM-48-HS100-50 sample and LP-MCM-48-HS100 host. | ||
The four samples with varying pore sizes were prepared by hydrothermal treatment at various temperatures. Fig. 3A indicates that the highest intense peak due to d211 plane progressively shifts to lower angles. This indicates that the d values increases and hence the pore size increases (see discussion of pore size in next section) as the hydrothermal treatment temperature increases. It can be seen that the cubic Ia![[3 with combining macron]](https://www.rsc.org/images/entities/char_0033_0304.gif) d symmetry was preserved in the whole set of CdS-LP-MCM-48 samples from the presence of the d220 reflection peaks, which is characteristic of the cubic phase. However, in comparing the XRD pattern of the large pore MCM-48 with the regular MCM-48 samples, it is seen that the mesopore arrangement is less-ordered in the large pore samples. The decrease of periodicity is evident from the less intense peaks due to [321], [400], [420], and [332] diffraction planes in the large pore MCM-48 samples. Fig. 3B provides a comparison of the large pore siliceous MCM-48 and the corresponding CdS loaded sample. The plot indicates that the intensity of the peak due to d211 plane near 2θ = 1° is considerably lower for the CdS sample, indicating occupation of pores by CdS particles. Collectively, Fig. 3 indicates that the introduction of CdS did not destroy the cubic phase. Fig. 4 shows the wide range powder XRD patterns of 4 CdS loaded large pore MCM-48 samples. No bulk CdS peaks can be seen in these four samples, which again illustrates the good dispersion of CdS in the large pore MCM-48 samples.
d symmetry was preserved in the whole set of CdS-LP-MCM-48 samples from the presence of the d220 reflection peaks, which is characteristic of the cubic phase. However, in comparing the XRD pattern of the large pore MCM-48 with the regular MCM-48 samples, it is seen that the mesopore arrangement is less-ordered in the large pore samples. The decrease of periodicity is evident from the less intense peaks due to [321], [400], [420], and [332] diffraction planes in the large pore MCM-48 samples. Fig. 3B provides a comparison of the large pore siliceous MCM-48 and the corresponding CdS loaded sample. The plot indicates that the intensity of the peak due to d211 plane near 2θ = 1° is considerably lower for the CdS sample, indicating occupation of pores by CdS particles. Collectively, Fig. 3 indicates that the introduction of CdS did not destroy the cubic phase. Fig. 4 shows the wide range powder XRD patterns of 4 CdS loaded large pore MCM-48 samples. No bulk CdS peaks can be seen in these four samples, which again illustrates the good dispersion of CdS in the large pore MCM-48 samples.
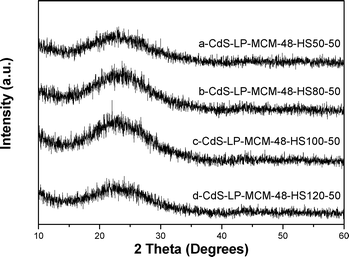 | ||
| Fig. 4 High angle XRD patterns of (a) CdS-LP-MCM-48-HS50-50, (b) CdS-LP-MCM-48-HS80-50, (c) CdS-LP-MCM-48-HS100-50, and (d) CdS-LP-MCM-48-HS120-50. | ||
Based on the analysis of the powder X-ray diffraction data, the results indicate that CdS components were successfully introduced into both the regular and the large pore sized MCM-48 mesostructured silica with very little compromise of the cubic phase and periodic arrangement of the pores. Meanwhile, the large surface area of the mesoporous materials is beneficial for the dispersion of CdS species. High dispersion minimizes the aggregation of CdS and increases the photocatalytic efficiency.59
3.2 N2 adsorption–desorption isotherm
To evaluate the mesoporous structure of the CdS embedded in regular MCM-48 and large pore MCM-48 siliceous materials, nitrogen adsorption–desorption isotherms were conducted at 77 K. Fig. 5A depicts the physisorption isotherms for CdS-MCM-48 samples. The adsorption isotherm is a typical type IV classification, which is evidence for the mesoporous nature of the samples and consistent with previous reports.60 For CdS incorporated in regular MCM-48 mesoporous materials, N2 is physisorbed in the pores at low relative pressures (P/P0 < 0.2). A marked inflection is perceived between the relative pressures (P/P0) = 0.2 and 0.4. This is caused by capillary condensation and is an indication of the inherent mesoporosity within the samples. The position of the inflection also provides clues for the pore diameter. It can be seen that the position of the inflection remains relatively constant, indicating very little change in the pore diameter with change in the loading of CdS. In addition, the sharpness of the inflections did not diminish with the incorporation of additional CdS, which means that the highly ordered mesoporous structure of the MCM-48 samples was preserved. The adsorption isotherm of CdS-MCM-48-25 is not represented since it overlaps considerably with other samples.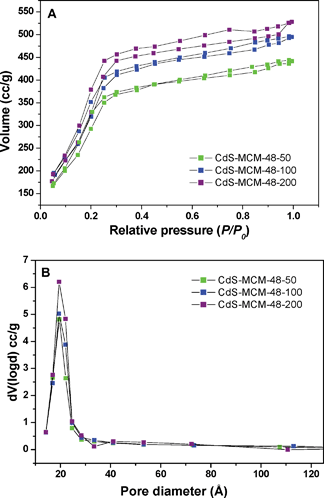 | ||
| Fig. 5 A) Nitrogen adsorption–desorption isotherms of (a) CdS-CM-48-50, (b) CdS-MCM-48-100, and (c) CdS-MCM-48-200. B) Pore size distribution of (a) CdS-MCM-48-50, (b) CdS-MCM-48-100, and (c) CdS-MCM-48-200. | ||
Compared with the regular pore sized MCM-48 materials, the large pore siliceous MCM-48 samples, which were prepared by a hydrothermal method at different temperatures, show shifts in the capillary condensation steps in the N2 adsorption–desorption isotherms indicating a variation in the pore sizes. With the increase of pore size, the capillary condensation happens at higher relative pressures and in the range (P/P0) = 0.5–0.8 in these materials as shown in Fig. 6A. The pore size distribution was determined by applying the Barrett–Joyner–Halenda (BJH) equation to the desorption isotherm and is shown in Fig. 6B. Fig. 6B shows that the pore diameter of CdS-LP-MCM-48 samples varies from 35–80 Å, depending on the temperature of hydrothermal synthesis.
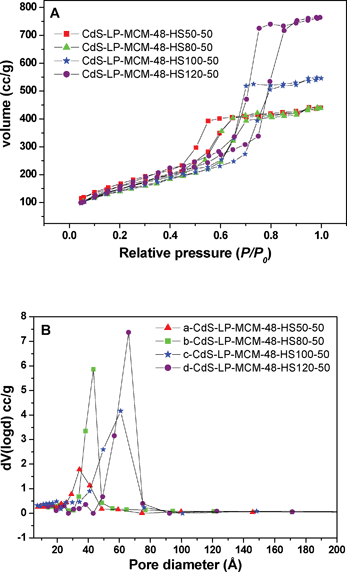 | ||
| Fig. 6 A) Nitrogen adsorption–desorption isotherms of (a) CdS-LP-MCM-48- HS50-50, (b) CdS-LP-MCM-48-HS80-50, (c) CdS-LP-MCM-48-HS100-50, and (d) CdS-LP-MCM-48-HS120-50. B) Pore size distribution of (a) CdS-LP-MCM-48- HS50-50, (b) CdS-LP-MCM-48-HS80-50, (c) CdS-LP-MCM-48-HS100-50, and (d) CdS-LP-MCM-48-HS120-50 | ||
A summary of the isotherm results is shown in Table 1. It can be seen that after the incorporation of CdS in the siliceous MCM-48 cubic support, there is a decrease in the surface area and pore volume, which is ascribed to the incorporation of CdS in the mesopores, however, no systematic variation in the surface area is observed. We have observed a similar trend in Fe-MCM-48 materials.49 The pore volume in general decreases with CdS loading, which indicates that the CdS particles are encapsulated in the pores. We have also determined the actual amount of CdS incorporated in the final material by AAS studies. It is seen that there is a significant difference between CdS in the synthesis mixture and in the final material, indicating that CdS is removed during the extensive washing step after sulfidation. However, it is interesting to note that the ratios of Si/CdS in the samples prepared by hydrothermal treatment at different temperatures are remarkably similar, indicating the high reproducibility of our method for incorporating CdS in the cubic MCM-48 mesopores. Furthermore, as indicated earlier, the cubic phase is highly sensitive to very small variations in the experimental conditions; however, we are able to incorporate similar amounts of CdS in the large pore size samples. Thus, we can conclude from powder XRD, nitrogen adsorption, and AAS studies that we have developed a very reproducible method for introducing CdS into the cubic mesoporous MCM-48 materials and more importantly, we have preserved the integrity of the cubic phase even at higher loadings of CdS with very minimal loss of the periodic arrangement, which is usually a challenge.
| Material | Si/CdSa (mol) | Si/CdSb (mol) | Surface Area (m2 g−1)c | Pore Volume (cm3 g−1)d | Pore Diameter (Å)e |
|---|---|---|---|---|---|
| a Molar ratio in the gel. b Molar ratio in the product measured by AAS study. c Determined by applying Brunauer–Emmett–Teller (BET) equation to a relative pressure (P/P0) range of 0.05–0.30 to the adsorption isotherm. d Calculated from the amount of nitrogen adsorbed at the highest relative pressure (P/P0) ∼ 0.98. e Calculated from the Barrett–Joyner–Halenda (BJH) equation using the desorption isotherm. f NA indicates not Applicable. | |||||
| CdS-MCM-48-200 | 200 | 307 | 1510 | 1.03 | 19.5 |
| CdS-MCM-48-100 | 100 | 136 | 1298 | 0.98 | 19.5 |
| CdS-MCM-48-50 | 50 | 94 | 1323 | 0.77 | 19.2 |
| CdS-MCM-48-25 | 25 | 45 | 1546 | 0.82 | 19.4 |
| Si-LP-MCM-48-HS50 | NAf | NA | 644 | 0.73 | 43.4 |
| CdS-LP-MCM-48-HS50-50 | 50 | 76 | 545 | 0.68 | 43.3 |
| Si-LP-MCM-48-HS80 | NA | NA | 596 | 0.79 | 49.1 |
| CdS-LP-MCM-48-HS80-50 | 50 | 71 | 489 | 0.68 | 48.6 |
| Si-LP-MCM-48-HS100 | NA | NA | 690 | 1.07 | 65.7 |
| CdS-LP-MCM-48-HS100-50 | 50 | 74 | 502 | 0.64 | 66.0 |
| Si-LP-MCM-48-HS120 | NA | NA | 733 | 1.50 | 78.7 |
| CdS-LP-MCM-48-HS120-50 | 50 | 72 | 555 | 1.18 | 79.0 |
3.3 UV-Vis diffuse reflectance spectroscopy (DRS)
To evaluate the size of CdS nanoparticles in the MCM-48 mesoporous materials UV-Vis diffuse reflectance spectra (DRS) were acquired. Fig. 7A shows the DRS spectra of CdS encapsulated in the regular MCM-48 mesostructured silica. It is well known that the pure siliceous MCM-48 mesoporous materials do not show any absorbance in the visible light region. However, after the incorporation with CdS nanoparticles, the absorbance edge of CdS-MCM-48 samples shift to the visible region. Also, it is well documented that bulk CdS has an onset of absorption at wavelength near 600 nm.61–63 In Fig. 7A, it is clearly demonstrated that all the CdS-MCM-48 samples show a clear blue shift in the absorption onset compared with bulk CdS. The notable blue shift in the absorption spectrum is due to the quantum confinement effect, which indicates that the CdS particles are in the nanosize regime. The particle size of the CdS species in the mesoporous MCM-48 materials was determined to be in the range 2.9–3.4 nm by applying the Brus equation.64–67 Also, the absorption band is shifted to considerably lower wavelengths for the sample with the lowest loading of CdS. As the loading increases, the onset is shifted to longer wavelengths, however, the onset for the three CdS-MCM-48 samples with higher CdS loadings are almost the same. The particle size of CdS determined from the Brus equation is greater than the pore size of siliceous MCM-48. This can be explained as follows. The cubic MCM-48 material consists of a 3D inter-penetrating network of bi-continuous set of pores. The CdS particles formed within the pores may aggregate to form larger clusters by a quantum tunneling effect as observed in other porous materials, such as zeolite Y.68–70 Based on our nitrogen adsorption studies, we believe that almost all the CdS particles are located inside the pores of the material; however, we cannot preclude the possibility of some CdS particles that are deposited on the surface of the mesoporous material. This suggests that the formation of CdS particles (clusters) may not occur exclusively within the pores of the MCM-48 matrix. It is quite possible that a fraction of Cd2+ ions may have been deposited on the external surface (outside of the pores) of MCM-48 and thus CdS may have precipitated on the external surface of the mesoporous material. Our, powder XRD studies indicate the absence of any peaks for CdS. This is an indication that most if not all of the CdS are preferentially located within the pores of MCM-48. However, as pointed out earlier, the absence of CdS peaks in the long range powder XRD experiments does not conclusively prove that CdS is absent on the external surface.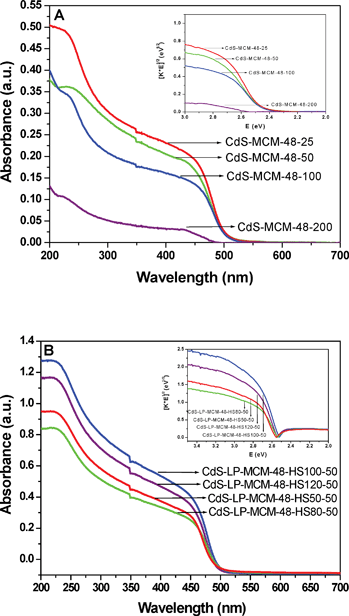 | ||
| Fig. 7 A) Diffuse reflectance spectra of (a) CdS-MCM-48-25, (b) CdS-MCM-48-50, (c) CdS-MCM-48-100, and (d) CdS-MCM-48-200. The inset shows the plots of transformed Kubelka–Munk function versus the light energy; B) Diffuse reflectance spectra of (a) CdS-LP-MCM-48-HS50-50, (b) CdS-LP-MCM-48-HS80-50, (c) CdS-LP-MCM-48-HS100-50, and (d) CdS-LP-MCM-48-HS120-50. The inset shows the plots of transformed Kubelka–Munk function versus the light energy. | ||
In order to obtain the band gap of these CdS-MCM-48 samples, the DRS spectra were converted to the linear correlation between the [F(R)hν]2 and the band gap energy via the Kubelka–Munk function (inset Fig. 7(A)). The band gap energy of these samples is in the range of 2.46–2.54 eV. Fig. 7B exhibits the DRS spectra of CdS encapsulated in the large pore siliceous MCM-48 mesoporous materials. A significant blue shift of the absorption edge, which is attributed to the quantum size effect, can also be noticed in the CdS-LP-MCM-48 samples compared to the bulk CdS. The particle size of CdS calculated by applying the Brus equation is in the range 2.8–3.3 nm. The band gap energy of this series of samples varies from 2.52–2.57 eV.
3.4 FT-IR spectroscopy
In order to understand the interactions between CdS and the host mesoporous siliceous MCM-48 materials, FT-IR studies were conducted. Table 2 lists the prominent peaks from the FT-IR experiments. For the pure siliceous MCM-48 material, the peak located at 1057 cm−1 can be assigned to the asymmetric stretching vibrations of Si–O–Si, while the symmetric stretching of Si–O–Si bond is seen at 818 cm−1. The peak due to the Si–O out of plane deformation appears at 441 cm−1. Compared with the pure Si-MCM-48, the CdS embedded MCM-48 samples show small shifts in the three aforementioned peaks. These small but reproducible frequency shifts indicate weak interaction between CdS and the mesoporous silica. The same observation can be found for the CdS encapsulated in large pore MCM-48 mesostructured silica.| Samples | ν (Si–O–Si),asym (cm−1) | ν (Si–O–Si),sym (cm−1) | δ (Si–O–Si) (cm−1) |
|---|---|---|---|
| Si-MCM-48 | 1057 | 818 | 441 |
| CdS-MCM-48-25 | 1063 | 816 | 444 |
| CdS-MCM-48-50 | 1062 | 808 | 442 |
| CdS-MCM-48-100 | 1062 | 815 | 442 |
| CdS-MCM-48-200 | 1064 | 818 | 446 |
| CdS-LP-MCM-48-HS50-50 | 1065 | 811 | 448 |
| CdS-LP-MCM-48-HS80-50 | 1061 | 812 | 446 |
| CdS-LP-MCM-48-HS100-50 | 1064 | 812 | 446 |
| CdS-LP-MCM-48-HS120-50 | 1064 | 812 | 449 |
3.5 TEM
Fig. 8 presents a transmission electron microscopy (TEM) image of a representative mesoporous sample containing CdS, i.e. CdS-LP-MCM-48-HS120-50.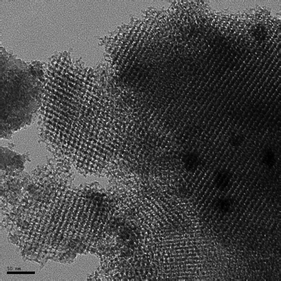 | ||
| Fig. 8 A TEM image of CdS-LP-MCM-48-HS120-50. The scale bar represents 50 nm. | ||
The TEM result is in good agreement with powder XRD analysis. The embedding of CdS into MCM-48 mesostructured silica did not affect the periodic arrangement of pores. Moreover, the CdS particles are highly dispersed in the siliceous MCM-48. It is hard to discern the actual particle size and location of CdS from TEM images despite our best attempts. This sample has a pore size of ∼8 nm and the DRS results suggest the particle size of CdS to be ∼3 nm, much smaller than the pore size. This challenge is typically encountered when supports such as MCM-48 that possess a 3-D network of pores are used since the pores extend in all three-directions and superimpose on one another, often leading to little contrast between the pore walls and pores. Most importantly, the frequency and diversity of the fringes indicated in the TEM image indicate high order, as expected for the cubic materials.
3.6 XPS studies
As a surface analytical technique, X-ray photoelectron spectroscopy has been widely used to determine the chemical environment and the composition of materials. In addition the oxidation state and the elemental composition ratio on the surface can be determined. The XPS experiments were thus performed for one representative sample before and after the sample had undergone photocatalytic reaction. Fig. 9A and Fig. 9B, respectively, present the XPS results for Cd 3d and S 2p core levels in the CdS-LP-MCM-48-HS100-50 sample before photocatalysis reaction.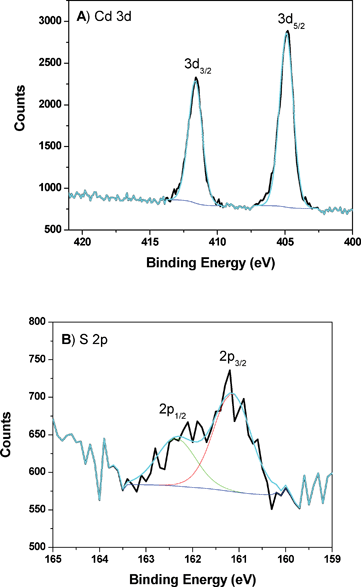 | ||
| Fig. 9 A) XPS of Cd peaks from CdS-LP-MCM-48-HS100-50 sample prior to photocatalysis reaction. B) XPS of S peaks from CdS-LP-MCM-48-HS100-50 sample prior to photocatalysis reaction. | ||
The Cd 3d spectrum exhibits doublet peaks at 411.6 eV and 404.9 eV due to 3d5/2 and 3d3/2 peaks with a separation of 6.7 eV, which is typical in CdS based materials. Meanwhile, the S 2p1/2 and 2p3/2 peaks appear at 162.4 eV and 161.2 eV, supporting the conclusion that the chemical composition of Cd and S elements result in CdS formation. By using the Si peak area, which remains a constant component in the composite photocatalysts, as the normalization factor, the relative content of Cd and S can be determined to be 1.80% and 1.01% in the CdS-LP-MCM-48-HS100-50 sample. This suggests a significant enrichment of Cd ions on the surface. This may be due to the fact that not all the Cd2+ ions that are impregnated are accessible for sulfidation by thiourea.
3.7 Photocatalysis
Fig. 10 shows the rate of hydrogen evolution over the various CdS loaded in regular MCM-48 and large pore MCM-48 mesostructured silica under visible light irradiation (λ > 400 nm) in the 1![[thin space (1/6-em)]](https://www.rsc.org/images/entities/char_2009.gif) :
:![[thin space (1/6-em)]](https://www.rsc.org/images/entities/char_2009.gif) 1 volume ratio of water–ethanol mixed solution. During the 3 h reaction period, the gas space was evaluated every one hour and the yield was determined by gas chromatography.
1 volume ratio of water–ethanol mixed solution. During the 3 h reaction period, the gas space was evaluated every one hour and the yield was determined by gas chromatography.
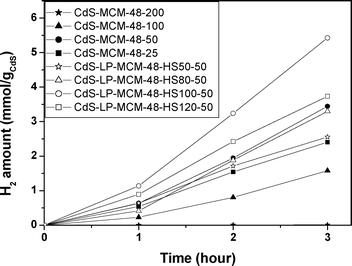 | ||
| Fig. 10 Hydrogen evolution over various CdS encapsulated MCM-48 and large pore MCM-48 composites under visible light irradiation. | ||
Among the series of CdS incorporated regular MCM-48 samples, CdS-MCM-48-50 was found to be the most photoactive in which the hydrogen evolution rate can reach 1.15 mmol h−1 gCdS−1 and the apparent quantum yield (AQY) was determined to be 10.5%.
However, with further increase of CdS content in the mesoporous silica supported photocatalyst, the hydrogen production rate shrank significantly. The decrease of the photocatalytic activity is probably due to the lower dispersion of CdS photoactive components on the mesoporous silica host. Therefore, further studies were carried out using this optimum CdS composition for the large pore sized MCM-48 catalysts. Fig. 10 also includes the photocatalytic hydrogen evolution rate over the CdS incorporated in large pore MCM-48 samples with the same Si/CdS ratio. In this series of samples, the most active material is CdS-LP-MCM-48-HS100-50, in which the pore size is determined to be ∼6.5 nm. The hydrogen evolution rate for this sample was found to be 1.81 mmol h−1 gCdS−1 under visible light irradiation and the apparent quantum yield (AQY) was estimated to be 16.6%.
3.8 Photoluminescence
Fig. 11 depicts the photoluminescence (PL) spectra of the CdS encapsulated regular MCM-48 and large pore sized MCM-48 mesostructured silica. PL measurements can provide some guidance in the trends observed in the solar hydrogen production. As can be seen in the figure, all the CdS embedded regular mesoporous MCM-48 samples show a broad emission peak at 767 nm, which is attributed to electron–hole recombination that occurs at surface-localized states and is not due to emission from excitonic recombination.41,71,72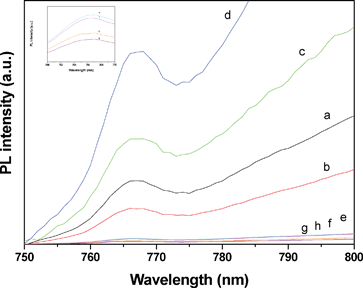 | ||
| Fig. 11 PL emission spectra of (a) CdS-MCM-48-25, (b) CdS-MCM-48-50, (c) CdS-MCM-48-100, (d) CdS-MCM-48-200, (e) CdS-LP-MCM-48-HS50-50, (f) CdS-LP-MCM-48-HS80-50, (g) CdS-LP-MCM-48-HS100-50, and (h) CdS-LP-MCM-48-HS120-50. The excitation wavelength (λex) = 467 nm at 25 °C. The inset shows the PL spectra of CdS incorporated in large pore sized MCM-48 silica samples in the 760–770 nm range. | ||
However, as discussed previously in the DRS section, due to the quantum tunneling effect, the CdS particles in the adjacent pores of the host MCM-48 aggregate and form larger clusters. Thus, the agglomerated clusters of CdS have the probability to undergo a Föster-type radiationless energy transfer in which the energy is transferred through the closely packed CdS particles. This results in a remarkable red shift of the emission peak.32,73 Therefore, the emission band of the CdS-MCM-48 samples located at 767 nm is actually due to the electron–hole recombination that occurs at the edges of the CdS clusters. The same observation, which is exhibited in the inset of Fig. 11, can be seen for the CdS incorporated in large pore sized MCM-48 mesostructured silica samples. Furthermore, the photoluminescence results suggest that CdS-LP-MCM-48-HS100-50 has the least PL intensity. This sample has the highest photocatalytic activity among all the samples. Thus, the trend in the photocatalysis hydrogen yield matches with the photoluminescence results, as can be seen in Fig. 11.
3.9 Mechanism
The considerable yield of hydrogen production reflects the high photocatalytic activity of the CdS encapsulated MCM-48 mesoporous materials. To rationalize the photocatalysis mechanism, it is essential to take the particle size of CdS and efficient charge separation into account. From the results of diffuse reflectance spectra of the CdS-MCM-48 samples, the size of the CdS clusters (not individual CdS particles) in all the MCM-48 samples is around 3 nm. The relative small particle size can dramatically lower the volume recombination of the photogenerated electron–hole pairs within the CdS particles. The smaller the particle size, the shorter the distance the photo-induced electrons and holes need to migrate. However, a very small particle size also increases the chance of the surface recombination of the electron–hole pairs. Thus, there is a particle size at which the volume and surface recombination rates balance each other. The optimum particle size of CdS was found to be 3.3 nm in this work and the CdS nanoparticles with this size have the highest efficiency for solar hydrogen production. Furthermore, utilization of a mesoporous framework can provide a certain degree of protection for CdS species and partly prevent photocorrosion. A bare CdS sample was prepared in an analogous manner and its activity was assessed. Only trace amounts of hydrogen evolution was found from the non-supported CdS sample, indicating that the mesoporous silica support provides structural support against photocorrosion. Also, another factor that limits the photocatalytic efficiency of CdS is electron–hole recombination. The photogenerated electrons in CdS may migrate to the silica pore walls, leaving the holes behind to oxidize water; this provides effective charge separation and increases the photocatalytic efficiency.Among the various pore sized CdS encapsulated MCM-48 mesoporous host materials, the one with the pore size of ∼6.5 nm shows the best performance for the visible light driven photocatalytic splitting of water. The CdS species are accommodated within the pores of this material and the encapsulation of CdS in the pores is conducive to the photogenerated charge diffusion from the semiconductor to the –Si–O– moieties of the host materials, thus minimizing electron–hole recombination. Our results also suggest that the cubic mesoporous phase is very critical for hydrogen generation. As stated earlier, we attempted to prepare CdS-MCM-48 by using Cd(NO3)2 and thiourea as precursors. Use of Cd(NO3)2 failed to produce cubic phase, and our powder XRD results (not shown) indicate a very poorly disordered mesoporous material. Our two attempts to use this material as a photocatalyst led to negligible production of hydrogen (∼1.0 μmol of hydrogen after 3 h of irradiation). This result suggests that the silica support should also be considered as a critical component in the design of artificial photoredox systems. To be better informed of the solar hydrogen evolution over CdS containing micro- and mesoporous materials supported photocatalysts under visible light radiation, Table 3 is presented. It is clear that CdS supported over cubic mesoporous materials produce significant amounts of hydrogen in the absence of Pt as a co-catalyst and sacrificial agents such as sulphide and sulphite, which are commonly used in such experiments.
| Catalyst | Experimental conditions | Hydrogen evolution rate (μmol h−1) | Ref. |
|---|---|---|---|
a AQY = Apparent Quantum Yield.  b NA indicates not available.
|
|||
| CdS/ETS-4 | 0.1 g catalyst + 60 mL of Na2S (0.1 M) – Na2SO3 (0.5 M) –NaOH (1.0 M) solution, 300 W Xe lamp, λ > 420 nm. | 17.5 | 23 |
| AQY = 0.42% | |||
| CdS/Zeolite Y | 0.2 g catalyst + 50 mL of 50![[thin space (1/6-em)]](https://www.rsc.org/images/entities/char_2009.gif) : :![[thin space (1/6-em)]](https://www.rsc.org/images/entities/char_2009.gif) 50 ethanol/water, 500 W Hg-Xe arc lamp, λ > 400 nm. 50 ethanol/water, 500 W Hg-Xe arc lamp, λ > 400 nm. |
6.6 | 32 |
| AQY: NAb | |||
| CdS/Zeolite L | 0.2 g catalyst + 50 mL of 50![[thin space (1/6-em)]](https://www.rsc.org/images/entities/char_2009.gif) : :![[thin space (1/6-em)]](https://www.rsc.org/images/entities/char_2009.gif) 50 ethanol/water, 500 W Hg-Xe arc lamp, λ > 400 nm. 50 ethanol/water, 500 W Hg-Xe arc lamp, λ > 400 nm. |
1.7 | 32 |
| AQY: NAa | |||
| CdS/SBA-15 | 0.2 g catalyst + 50 mL of 50![[thin space (1/6-em)]](https://www.rsc.org/images/entities/char_2009.gif) : :![[thin space (1/6-em)]](https://www.rsc.org/images/entities/char_2009.gif) 50 ethanol/water, 500 W Hg-Xe arc lamp, λ > 400 nm. 50 ethanol/water, 500 W Hg-Xe arc lamp, λ > 400 nm. |
2.7 | 32 |
| AQY: NA | |||
| CdS/SBA-15 | 0.1 g catalyst + 20 mL of water + 15 vol.% 2-propanol, 500 W Halogen lamp. | 133.3 | 34 |
| AQY: NA | |||
| Pt/CdS/SBA-15 | 0.1 g catalyst + 20 mL of water + 15 vol.% 2-propanol, 500 W Halogen lamp. | 800 | 34 |
| AQY: NA | |||
| CdS-ZnSBA-15 | 0.02 g catalyst + 20 mL of water + 15 vol.% 2-propanol, 2000 W Xe lamp, λ > 400 nm. | 0.703 | 35 |
| AQY: NA | |||
| CdS/ETS-10 | 0.1 g catalyst + 60 mL of Na2S (0.1 M) − Na2SO3 (0.5 M) − NaOH (1.0 M) solution, 300 W Xe lamp, λ > 420 nm. | 10.3 | 38 |
| AQY = 0.31% | |||
| CdS/Al-HMS | 0.2 g catalyst + 200 mL of aqueous formic acid solution (H2O : HCOOH = 4![[thin space (1/6-em)]](https://www.rsc.org/images/entities/char_2009.gif) : :![[thin space (1/6-em)]](https://www.rsc.org/images/entities/char_2009.gif) 1, in volume), 350 W Xe lamp, λ > 420 nm. 1, in volume), 350 W Xe lamp, λ > 420 nm. |
23.7 | 39 |
| AQY = 1.2% | |||
| Ru/CdS/Al-HMS | 0.2 g catalyst + 200 mL of aqueous formic acid solution (H2O:HCOOH = 4![[thin space (1/6-em)]](https://www.rsc.org/images/entities/char_2009.gif) : :![[thin space (1/6-em)]](https://www.rsc.org/images/entities/char_2009.gif) 1, in volume), 350 W Xe lamp, λ > 420 nm. 1, in volume), 350 W Xe lamp, λ > 420 nm. |
590 | 39 |
| AQY = 5.92% | |||
| CdS@Ti-MCM-41 | 0.2 g catalyst + Na2SO3 (0.38 M, 200 mL) solution, 350 W Xe lamp, λ > 430 nm. | 250 | 41 |
| AQY = 0.74% | |||
| Pt/CdS@Ti-MCM-41 | 0.2 g catalyst + Na2SO3 (0.38 M, 200 mL) solution, 350 W Xe lamp, λ > 430 nm. | 875 | 41 |
| AQY = 2.6% | |||
| Pt/CdS@Z25T75P | 0.2 g catalyst + 200 mL of Na2S (0.35 M) − Na2SO3 (0.25 M) solution, 300 W Xe lamp, λ > 430 nm. | 460 | 42 |
| AQY = 27.2% | |||
| CdS-LP-MCM-48-HS100-50 | 0.04 g catalyst + 20 mL of 50![[thin space (1/6-em)]](https://www.rsc.org/images/entities/char_2009.gif) : :![[thin space (1/6-em)]](https://www.rsc.org/images/entities/char_2009.gif) 50 ethanol/water, 300 W Xe lamp, λ > 400 nm. 50 ethanol/water, 300 W Xe lamp, λ > 400 nm. |
1810 | This work |
| AQY = 16.6% | |||
3.10 Recycling studies
The samples after the photocatalytic reaction were collected and carefully conserved for recycling studies. Fig. 12 depicts the comparative results of hydrogen production from the fresh and spent CdS-LP-MCM-48-HS100-50 samples.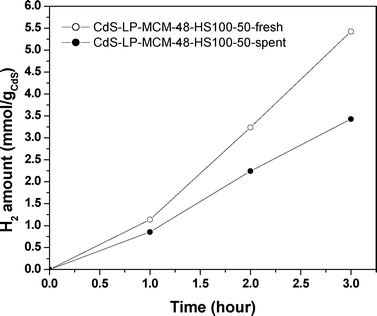 | ||
| Fig. 12 Hydrogen evolution over CdS encapsulated large pore MCM-48 composites and the recycling experiment under visible light irradiation. | ||
It can be seen that the hydrogen evolution over the spent catalysts decreases from 1.81 to 1.14 mmol h−1 gCdS−1. With the reaction proceeding, the color of the solution mixture changed from pale yellow to grey-brownish, as can be observed in Fig. 13. The change in color is due to the reduction of Cd2+ to Cd+ and eventually to Cd0.74 However, the oxidization of S2− to S0 (by the trapped valence band holes) to eventually form polysulfide S22− is also plausible.32 Once the grey-brownish solution was exposed to the air, the color turned back to yellow again in a short time (∼10 min.). In the presence of O2, Cd0 can be re-oxidized into Cd2+. Nevertheless, instead of severe photocorrosion, which is normally closely linked with photocatalytic reaction of bulk CdS (and observed by us since the non-supported CdS evolved only trace amounts of hydrogen under the same experimental conditions), CdS in the spent catalyst is mostly preserved due to their encapsulation within the MCM-48 mesoporous silica support.68,70,75
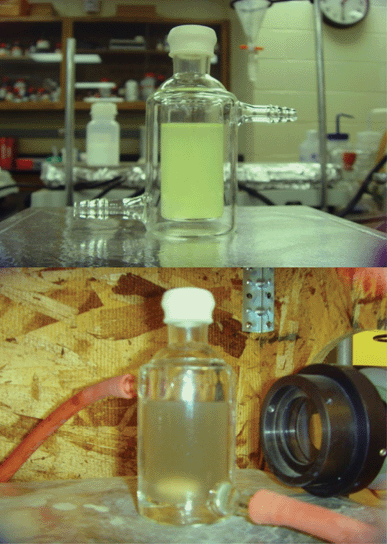 | ||
| Fig. 13 Color change observation during the photocatalytic reaction. Top: Solution before visible light irradiation and bottom: solution after visible light irradiation. | ||
In order to obtain more information for the spent catalyst, additional experiments were carried out. Fig. 14 shows the XPS patterns of the CdS-LP-MCM-48- HS100-50-spent sample.
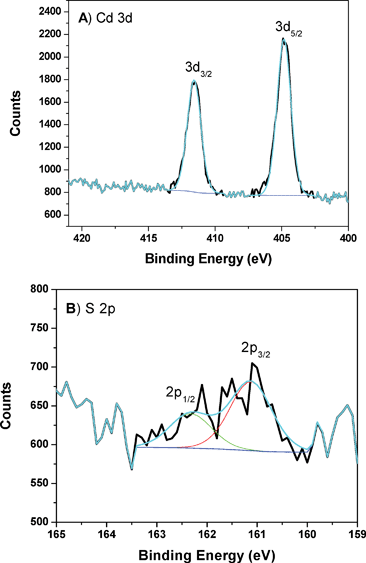 | ||
| Fig. 14 A) XPS of Cd peaks from CdS-LP-MCM-48-HS100-50 sample after photocatalysis reaction. B) XPS of S peaks from CdS-LP-MCM-48-HS100-50 sample after photocatalysis reaction. | ||
Fig. 14A shows the Cd 3d5/2 and 3d3/2 peaks in the spent CdS-LP-MCM-48-HS100-50 sample. Peaks at 411.6 eV and 404.9 eV with separation of 6.7 eV are again observed. Furthermore, there is no shift of the S 2p peaks in comparison to the fresh sample. These observations qualitatively indicate the preservation of CdS species in the spent catalyst sample. However, when the spent catalyst was quantitatively evaluated a chemical loss was found. The Si peak area of the spent catalyst was selected for normalization since the Si amount is expected to stay the same as in the fresh sample. The relative content of Cd and S in the spent sample was estimated to be 1.20% and 0.67%, respectively. In comparing these values with the fresh catalyst, it can be seen that there is a 33% loss of CdS after the photocatalytic reaction. However, the ratio of Cd/S in the fresh and spent catalyst is almost the same. AAS analysis of Cd2+ ions in the spent catalyst suggests a 35% decrease and this is in good agreement with the XPS study. As indicated by the XPS data there is excess Cd2+ in the fresh catalyst. These Cd2+ ions may leach during the photocatalytic reaction. However, this may not account for the loss of S2− that has also been observed by XPS studies. We believe that the loss of Cd2+ ions seen in AAS and XPS studies is due to loss of CdS from the mesoporous material. Unlike aluminosilicate frameworks that possess a negative charge and facilitate strong interaction with CdS, the interaction between the mesoporous MCM-48 silica (which can be considered essentially neutral) in the framework and CdS is only moderately strong, as evidenced from the FT-IR studies. Thus, there is loss of CdS from the catalyst due to photolytic decomposition. When the spent catalyst was collected, those loosely bound CdS particles leach out from the pores during the photocatalysis reaction.
In order to understand if the loss in photocatalytic activity is due to any structural change in the cubic phase of the silica support, low and high angle XRD of the CdS-LP-MCM-48-HS100-50-spent sample were conducted. Fig. 15A depicts the low angle XRD patterns of the fresh CdS-LP-MCM-48-HS100-50 and the spent catalyst. Obviously, the XRD result of spent sample indicates typical Bragg reflections of the mesopore MCM-48 materials with cubic Ia![[3 with combining macron]](https://www.rsc.org/images/entities/char_0033_0304.gif) d symmetry, which means the periodically arranged cubic phased mesopores were preserved in the sample after the photocatalytic reaction. It turns out that the cubic phase MCM-48 mesoporous silica is robust under visible light irradiation. Fig. 15B presents the high angle XRD patterns of the CdS-LP-MCM-48-HS100-50 fresh and spent samples. In both samples, only bulk SiO2 peaks are detected. This confirms the good dispersion of the CdS species within the supporting mesoporous materials.
d symmetry, which means the periodically arranged cubic phased mesopores were preserved in the sample after the photocatalytic reaction. It turns out that the cubic phase MCM-48 mesoporous silica is robust under visible light irradiation. Fig. 15B presents the high angle XRD patterns of the CdS-LP-MCM-48-HS100-50 fresh and spent samples. In both samples, only bulk SiO2 peaks are detected. This confirms the good dispersion of the CdS species within the supporting mesoporous materials.
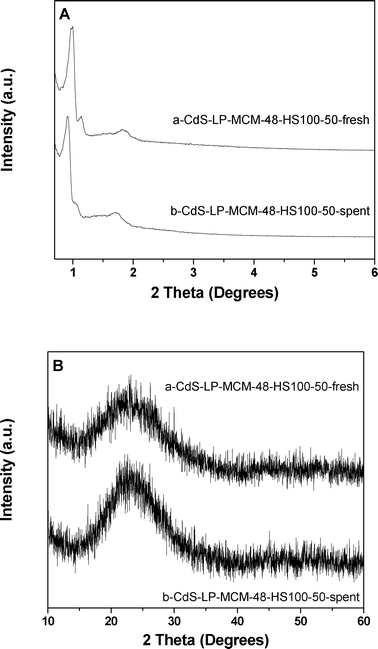 | ||
| Fig. 15 A) Low angle XRD patterns of (a) CdS-LP-MCM-48-HS100-50-fresh and (b) CdS-LP-MCM-48-HS100-50-spent. B) High angle XRD patterns of (a) CdS-LP-MCM-48-HS100-50-fresh and (b) CdS-LP-MCM-48-HS100-50-spent. | ||
Furthermore, a nitrogen physisorption study was conducted to examine if there was alteration of the textural properties of the CdS-LP-MCM-48-HS100-50 spent sample. Fig. 16A shows the nitrogen physisorption isotherms of the fresh and spent samples. The hystereses of both samples are of typical type IV classification, which is strong evidence for the mesoporous nature of the samples. This is in good agreement with the XRD results that the photocatalytic reaction did not destroy the ordered cubic mesoporous structure of the photocatalyst. Also, an increase in the pore volume and an enlargement of surface area is observed for the spent catalyst in comparison with the fresh sample. This can be ascribed to the loss of the CdS from the pores of the mesoporous silica host. The pore size distribution plotted in Fig. 16B demonstrates that the pores in the spent catalyst possess are fairly uniform compared with those in the fresh mesoporous sample.
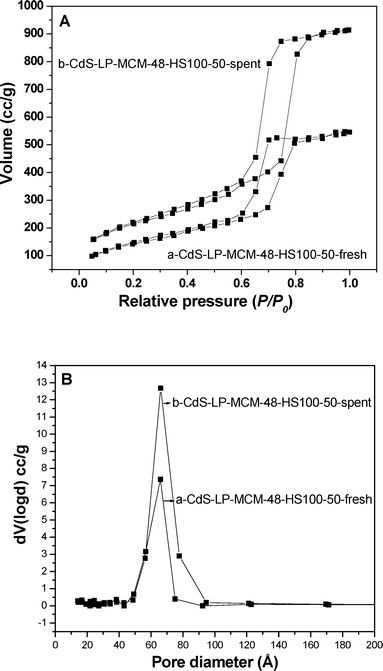 | ||
| Fig. 16 A) Nitrogen adsorption–desorption isotherms of (a) CdS-LP-MCM-48-HS100-50-fresh and (b) CdS-LP-MCM-48-HS100-50-spent. B) Pore size distribution of (a) CdS-LP-MCM-48-HS100-50-fresh and (b) CdS-LP-MCM-48-HS100-50-spent. | ||
The data are summarized in Table 4.
| Material | Si/CdS (mol) | Surface Area (m2 g−1) | Pore Volume (cm3 g−1) | Pore Diameter (Å) |
|---|---|---|---|---|
| CdS-LP-MCM-48-HS100-50-fresh | 74 | 502 | 0.64 | 66.0 |
| CdS-LP-MCM-48-HS100-50-spent | 111 | 752 | 1.41 | 66.1 |
Conclusions
CdS can be encapsulated in MCM-48 materials by a post-impregnation method. High angle powder XRD studies demonstrate that the CdS species are highly dispersed in the mesoporous siliceous framework since no peaks of bulk CdS were found. Low angle XRD, TEM, and N2 adsorption–desorption analysis proved the preservation of the ordered cubic phase after the introduction of CdS in MCM-48. All the CdS-MCM-48 samples were active for photocatalytic hydrogen evolution under visible light irradiation even in the absence of Pt and sulfide and sulfite, which are normally used in photocatalytic experiments involving CdS photocatalysts. The amount of CdS loading and the pore size of the host MCM-48 materials affect the hydrogen yield. As shown by the recycling studies, the MCM-48 supported CdS photocatalysts were moderately stable under the experiment conditions. XPS studies suggested a 33% loss of CdS from the support after the photocatalytic reaction. This study indicates that CdS-MCM-48 with a pore size of ∼6.5 nm exhibits high efficiency. The apparent quantum yield of this material was found to be 16.6% and the hydrogen yields are significantly higher in comparison to other CdS encapsulated porous materials reported in the literature. What is more remarkable is that high efficiencies are obtained without any noble metals, such as Pt, which are usually indispensable for hydrogen production. Meanwhile, in the absence of sulfide and sulfite salt, which are widely employed as reducing agents to avoid severe photocorrosion of CdS, reasonably high solar hydrogen yield as well as apparent quantum yield are achievable using CdS-MCM-48 materials. Thus, this study indicates the importance of the MCM-48 materials as versatile hosts for encapsulating CdS and in enhancing the photocatalytic efficiency for visible light splitting of water to generate hydrogen. The mesoporous silica support with its 3-D inter-penetrating network of pores and high surface area facilitates high dispersion of CdS semiconductor and this minimizes both photocorrosion and electron–hole recombination in comparison within non-supported CdS. Increased efficiencies may be further obtained by covalently anchoring CdS, by using a crystalline mesoporous silica framework, and by incorporating hole transferring agents in the mesopores matrix such that oxygen is also evolved concomitantly. This work provides guidance in these directions. However, these are beyond the purview of this work and such studies will be the focus of new investigations from our group.Acknowledgements
We extend sincere gratitude to NSF-CHE-0722632, NSF-CHE-0840507, NSF-EPS-0903804, DE-E0000270, and the State of South Dakota for funding this project. Dr Cuikin Lin is thanked for assistance with TEM studies and Mr. C. Bruce Gray is thanked for help with AAS studies. Prof. V. H. Grassian is acknowledged for help with XPS studiesReferences
- D. Das and T. N. Veziroglu, Int. J. Hydrogen Energy, 2001, 26, 13–28 CrossRef CAS
.
- B. E. Logan, Environ. Sci. Technol., 2004, 38, 160A–167A CrossRef CAS
.
- A. Fujishima and K. Honda, Nature, 1972, 238, 37–38 CrossRef CAS
.
- T. Takata, A. Tanaka, M. Hara, J. N. Kondo and K. Domen, Catal. Today, 1998, 44, 17–26 CrossRef CAS
.
- A. Kudo and Y. Miseki, Chem. Soc. Rev., 2009, 38, 253–278 RSC
.
- X. Chen, S. Shen, L. Guo and S. S. Mao, Chem. Rev., 2010, 110, 6503–6570 CrossRef CAS
.
- F. E. Osterloh, Chem. Mater., 2007, 20, 35–54 CrossRef
.
- M. Ashokkumar, Int. J. Hydrogen Energy, 1998, 23, 427–438 CrossRef CAS
.
- Z. Lei, G. Ma, M. Liu, W. You, H. Yan, G. Wu, T. Takata, M. Hara, K. Domen and C. Li, J. Catal., 2006, 237, 322–329 CrossRef CAS
.
- A. Kudo, H. Kato and I. Tsuji, Chem. Lett., 2004, 33, 1534–1539 CrossRef CAS
.
- J. Yin, Z. Zou and J. Ye, Res. Chem. Intermed., 2005, 31, 463–475 CrossRef CAS
.
- K. Maeda, T. Takata, M. Hara, N. Saito, Y. Inoue, H. Kobayashi and K. Domen, J. Am. Chem. Soc., 2005, 127, 8286–8287 CrossRef CAS
.
- W. Shangguan and A. Yoshida, J. Phys. Chem. B, 2002, 106, 12227–12230 CrossRef CAS
.
- A. Koca and M. Sahin, Int. J. Hydrogen Energy, 2002, 27, 363–367 CrossRef CAS
.
- G. Milczarek, A. Kasuya, S. Mamykin, T. Arai, K. Shinoda and K. Tohji, Int. J. Hydrogen Energy, 2003, 28, 919–926 CrossRef CAS
.
- M. Mrowetz, W. Balcerski, A. J. Colussi and M. R. Hoffmann, J. Phys. Chem. B, 2004, 108, 17269–17273 CrossRef CAS
.
- K. T. Ranjit, R. Krishnamoorthy, T. K. Varadarajan and B. Viswanathan, J. Photochem. Photobiol., A, 1995, 86, 185–189 CrossRef CAS
.
- M. Sathish, B. Viswanathan and R. P. Viswanath, Int. J. Hydrogen Energy, 2006, 31, 891–898 CrossRef CAS
.
- D. Meissner, R. Memming and B. Kastening, J. Phys. Chem., 1988, 92, 3476–3483 CrossRef CAS
.
- T. Inoue, T. Watanabe, A. Fujishima, K.-i. Honda and K. Kohayakawa, J. Electrochem. Soc., 1977, 124, 719–722 CrossRef CAS
.
- A. W. H. Mau, C. B. Huang, N. Kakuta, A. J. Bard, A. Campion, M. A. Fox, J. M. White and S. E. Webber, J. Am. Chem. Soc., 1984, 106, 6537–6542 CrossRef CAS
.
- H. Fujii, M. Ohtaki, K. Eguchi and H. Arai, J. Mol. Catal. A: Chem., 1998, 129, 61–68 CrossRef CAS
.
- G. Guan, T. Kida, K. Kusakabe, K. Kimura, X. Fang, T. Ma, E. Abe and A. Yoshida, Chem. Phys. Lett., 2004, 385, 319–322 CrossRef CAS
.
- P. M. Sirimanne, Y. Yasaki, N. Sonoyama and T. Sakata, Mater. Chem. Phys., 2003, 78, 234–238 CrossRef
.
- G.-S. Li, D.-Q. Zhang and J. C. Yu, Environ. Sci. Technol., 2009, 43, 7079–7085 CrossRef CAS
.
- X. Wang, G. Liu, Z.-G. Chen, F. Li, L. Wang, G. Q. Lu and H.-M. Cheng, Chem. Commun., 2009, 3452–3454 RSC
.
- M. Innocenti, S. Cattarin, F. Loglio, T. Cecconi, G. Seravalli and M. L. Foresti, Electrochim. Acta, 2004, 49, 1327–1337 CrossRef CAS
.
- P. Schneider, P. Hudec and O. Solcova, Microporous Mesoporous Mater., 2008, 115, 491–496 CrossRef CAS
.
- D. W. Bahnemann, C. Kormann and M. R. Hoffmann, J. Phys. Chem., 1987, 91, 3789–3798 CrossRef CAS
.
- W. Choi, A. Termin and M. R. Hoffmann, Angew. Chem., Int. Ed. Engl., 1994, 33, 1091–1092 CrossRef
.
- X. Chen and C. Burda, J. Phys. Chem. B, 2004, 108, 15446–15449 CrossRef CAS
.
- S. Y. Ryu, W. Balcerski, T. K. Lee and M. R. Hoffmann, J. Phys. Chem. C, 2007, 111, 18195–18203 CAS
.
- M. A. Fox and T. L. Pettit, Langmuir, 1989, 5, 1056–1061 CrossRef CAS
.
- P. Lunawat, R. Kumar and N. Gupta, Catal. Lett., 2008, 121, 226–233 CrossRef CAS
.
- T. Hirai, M. Nanba and I. Komasawa, J. Colloid Interface Sci., 2003, 268, 394–399 CrossRef CAS
.
- T. Hirai and M. Ota, Mater. Res. Bull., 2006, 41, 19–28 CrossRef CAS
.
- T. Hirai and Y. Bando, J. Colloid Interface Sci., 2005, 288, 513–516 CrossRef CAS
.
- G. Guan, T. Kida, K. Kusakabe, K. Kimura, E. Abe and A. Yoshida, Appl. Catal., A, 2005, 295, 71–78 CrossRef CAS
.
- Y. J. Zhang, L. Zhang and S. Li, Int. J. Hydrogen Energy, 2010, 35, 438–444 CrossRef CAS
.
- Y. J. Zhang and L. Zhang, Appl. Surf. Sci., 2009, 255, 4863–4866 CrossRef CAS
.
- S. Shen and L. Guo, Mater. Res. Bull., 2008, 43, 437–446 CrossRef CAS
.
- D. Jing and L. Guo, J. Phys. Chem. C, 2007, 111, 13437–13441 CAS
.
- C. T. Kresge, M. E. Leonowicz, W. J. Roth, J. C. Vartuli and J. S. Beck, Nature, 1992, 359, 710–712 CrossRef CAS
.
- J. S. Beck, J. C. Vartuli, W. J. Roth, M. E. Leonowicz, C. T. Kresge, K. D. Schmitt, C. T. W. Chu, D. H. Olson, E. W. Sheppard, S. B. McCullen, J. B. Higgins and J. L. Schlenkert, J. Am. Chem. Soc., 1992, 114, 10834–10843 CrossRef CAS
.
- F. Schüth and U. Ciesla, Microporous Mesoporous Mater., 1999, 27, 131–149 CrossRef
.
- D. Zhao and Y. Wan, Chem. Rev., 2007, 107, 2821–2860 CrossRef
.
- M. Anpo, H. Yamashita, K. Ikeue, Y. Fujii, S. G. Zhang, Y. Ichihashi, D. R. Park, Y. Suzuki, K. Koyano and T. Tatsumi, Catal. Today, 1998, 44, 327–332 CrossRef CAS
.
- W. Zhao, Y. Luo, P. Deng and Q. Li, Catal. Lett., 2001, 73, 199–202 CrossRef CAS
.
- H. Subramanian, E. G. Nettleton, S. Budhi and R. T. Koodali, J. Mol. Catal. A: Chem., 2010, 330, 66–72 CrossRef CAS
.
- H. Subramanian and R. T. Koodali, React. Kinet. Catal. Lett., 2008, 95, 239–245 CrossRef CAS
.
- B. Boote, H. Subramanian and K. T. Ranjit, Chem. Commun., 2007, 4543–4545 RSC
.
- D. Zhao, S. Budhi, A. Rodriguez and R. T. Koodali, Int. J. Hydrogen Energy, 2010, 35, 5276–5283 CrossRef CAS
.
- D. Zhao, A. Rodriguez, N. M. Dimitrijevic, T. Rajh and R. T. Koodali, J. Phys. Chem. C, 2010, 114, 15728–15734 CAS
.
- R. Peng, D. Zhao, N. M. Dimitrijevic, T. Rajh and R. T. Koodali, J. Phys. Chem. C, 2012, 116, 1605–1613 CAS
.
- K. Lee, Y. H. Kim, S. B. Han, H. Kang, S. Park, W. S. Seo, J. T. Park, B. Kim and S. Chang, J. Am. Chem. Soc., 2003, 125, 6844–6845 CrossRef CAS
.
- S. Rodrigues, K. T. Ranjit, S. Uma, I. N. Martyanov and K. J. Klabunde, Adv. Mater., 2005, 17, 2467–2471 CrossRef CAS
.
- T. W. Kim, F. Kleitz, B. Paul and R. Ryoo, J. Am. Chem. Soc., 2005, 127, 7601–7610 CrossRef CAS
.
- S. Han, A. Liu, H. Che and L. Hua, Langmuir, 2010, 26, 3555–3561 CrossRef
.
- W. Choi, A. Termin and M. R. Hoffmann, J. Phys. Chem., 1994, 98, 13669–13679 CrossRef
.
- K. S. W. Sing, D. H. Everett, R. A. W. Haul, L. Moscou, R. A. Pierotti, J. Rouquerol and T. Siemieniewska, Pure Appl. Chem., 1984, 57, 603–619 CrossRef
.
- V. A. Stadnik, Phys. Status Solidi B, 1990, 159, 241–247 CrossRef CAS
.
- W.-S. Chae, J.-H. Ko, K.-H. Choi, J.-S. Jung and Y.-R. Kim, J. Anal. Sci. Technol., 2010, 1, 25–29 CrossRef CAS
.
- T. Kida, G. Guan, Y. Minami, T. Ma and A. Yoshida, J. Mater. Chem., 2003, 13, 1186–1191 RSC
.
- H. Weller, H. M. Schmidt, U. Koch, A. Fojtik, S. Baral, A. Henglein, W. Kunath, K. Weiss and E. Dieman, Chem. Phys. Lett., 1986, 124, 557–560 CrossRef CAS
.
- M. Thambidurai, N. Muthukumarasamy, S. Agilan, N. Murugan, S. Vasantha, R. Balasundaraprabhu and T. Senthil, J. Mater. Sci., 2010, 45, 3254–3258 CrossRef CAS
.
- M. L. Steigerwald and L. E. Brus, Annu. Rev. Mater. Sci., 1989, 19, 471–495 CrossRef CAS
.
- T. Hirai, H. Sato and I. Komasawa, Ind. Eng. Chem. Res., 1994, 33, 3262–3266 CrossRef CAS
.
- N. Herron, Y. Wang, M. M. Eddy, G. D. Stucky, D. E. Cox, K. Moller and T. Bein, J. Am. Chem. Soc., 1989, 111, 530–540 CrossRef CAS
.
- H. Yahiro, T. Kyakuno and G. Okada, Top. Catal., 2002, 19, 193–195 CrossRef CAS
.
- Y. Wang and N. Herron, J. Phys. Chem., 1987, 91, 257–260 CrossRef CAS
.
- L. Spanhel, M. Haase, H. Weller and A. Henglein, J. Am. Chem. Soc., 1987, 109, 5649–5655 CrossRef CAS
.
- Z. Fu, S. Zhou, J. Shi and S. Zhang, Mater. Res. Bull., 2005, 40, 1591–1598 CrossRef CAS
.
- S. Huber, A. Z. Ruiz, H. Li, G. Patrinoiu, C. Botta and G. Calzaferri, Inorg. Chim. Acta, 2007, 360, 869–875 CrossRef CAS
.
- T. Shiragami, S. Fukami, Y. Wada and S. Yanagida, J. Phys. Chem., 1993, 97, 12882–12887 CrossRef CAS
.
- A. Aparisi, V. Fornés, F. Márquez, R. Moreno, C. López and F. Meseguer, Solid-State Electron., 1996, 40, 641–645 CrossRef CAS
.
| This journal is © The Royal Society of Chemistry 2012 |
