DOI:
10.1039/C2RA20694C
(Paper)
RSC Adv., 2012,
2, 8036-8040
Advanced electrolyte-free fuel cells based on functional nanocomposites of a single porous component: analysis, modeling and validation
Received
18th April 2012
, Accepted 28th June 2012
First published on 3rd July 2012
Abstract
Recently, a fuel cell device constructed with only one layer composited of ceria-based nanocomposites (typically, lithium nickel oxide and gadolinium doped ceria (LiNiO2–GDC) composite materials), called an electrolyte-free fuel cell (EFFC), was realized for energy conversion by Zhu et al. The maxium power density of this single-component fuel cell is 450 mW cm−2 at 550 °C when using hydrogen fuel. In this study, a model was developed to evaluate the performance of an EFFC. The kinetics of anodic and cathodic reactions were modeled based on electrochemical impedance spectroscopy (EIS) measurements. The results show that both of the anodic and cathodic reactions are kinetically fast processes at 500 °C. Safety issues of an EFFC using oxidant and fuels at the same time without a gas-tight separator were analyzed under open circuit and normal operation states, respectively. The reaction depth of anodic and cathodic processes dominated the competition between surface electrochemical and gas-phase reactions which were effected by the catalytic activity and porosity of the materials. The voltage and power output of an EFFC were calculated based on the model and compared with the experimental results.
Introduction
Solid oxide fuel cells (SOFCs) are considered a promising candidate for power-generating technology because of their fuel flexibility, high overall efficiency, their environmentally friendly nature, and polygeneration. A conventional SOFC is constructed with three functional parts: anode, electrolyte and cathode, which is typically called the membrane electrode assembly (MEA).1 The three-component MEA technology requires a complex structure and technology as all components have to be stable and compatible. High cost is inevitable due to the critical requirements of the MEA structure, such as gas-tight sealing, complex gas management, high-temperature (∼1000 °C) operation, and dense membrane fabrication.
In order to overcome those challenges, a single-chamber solid oxide fuel cell (SC–SOFC) was developed, in which both the anode and cathode were exposed to a mixture of fuel and oxidant in a single chamber.2–7 Consequently, the gas-sealing problem was totally avoided because there was no requirement of separation between fuel and oxidant. At the same time, the cell temperature can effectively be raised due to the exothermic fuel oxidation reaction. In addition, a porous solid electrolyte was used, allowing for relatively low processing temperature of the electrolyte, therefore reducing manufacturing costs. CH4, C2H6, C3H8, C4H10, CH3OCH3, C2H5OH, and H2 mixed with oxidant have been used in SC–SOFCs.8–13 To date, the typical power output for SC–SOFCs is compatible with that of conventional SOFCs. Compared with conventional SOFCs, the sealing and gas management problems have been minimized in SC–SOFCs. Although SC–SOFCs are much more compact and simpler than conventional SOFCs, the cell is still constructed in the mode of MEA. The stability and high cost of a complex MEA structure is unavoidable for research and development of SC–SOFCs.
If FC development could be liberated from the constraints of complex multi-layered structures, there would be a completely new way of creating fuel cell technology. Recently, a solid oxide fuel cell, called an electrolyte-free solid oxide fuel cell (EFFC), constructed with a single porous component was demonstrated.1 This single component was prepared using a mixture of ionic conductors, e.g. Gd3+ or Sm3+ doped ceria (GDC or SDC) and electronic conductors, such as LiNiCu or LiNiCuZn based oxides. Metal current collectors were mounted on both sides of the component to complete the fuel cell construction. A power output of 450 mW cm−2 was achieved at 550 °C.
In this work, a model was built to simulate an EFFC and to investigate the electrochemical kinetics both of fuel viz. hydrogen reduction and oxidant oxidation reactions together with experimental measurements. Some critical problems, including safety and short circuiting of EFFCs, were discussed. The I–V and I–P characteristics were given based on the model and compared with the experimental results.
Model
System configuration and working principle
Fig. 1 illustrates an EFFC constructed with a single porous component made of a mixture of ionic and electronic conductors. It combines the electrode (both anode and cathode) processes with ionic (bulk/surface O2−/H+) transportation in a single component at 300–600 °C. Although an EFFC is built with only one layer and all electrode reactions occur in one component, we can divide it into three parts geometrically and theoretically for the convenience of modeling: the anodic and cathodic sides, and the zone between them. At the anodic side, fuels (such as H2) can be electrochemically oxidized and release electrons, as exemplified by:
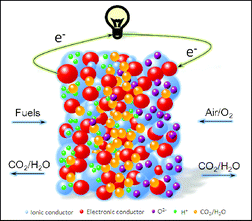 |
| | Fig. 1 A schematic illustration of an electrolyte-free solid oxide fuel cell. Current collectors are not shown, which should be mounted on both sides of the component. | |
At the cathodic side, the oxidant (O2) can be electrochemically reduced and accept electrons:
H+ migrates from the anodic side to the cathodic side, or O2− migrates from the cathodic side to the anodic side to complete the FC process. Generally, in a conventional SOFC, ionic transportation is predominantly in the bulk phase inside the ionic conductors between the anode and cathode. However, in the EFFCs, ionic transportation is enhanced by surface ionic conduction in the porous structure, paralleling ionic conduction in the bulk phase that results in higher conductivity.14,15 The overall reaction for EFFCs is:
| | | H2 + ½O2 → H2O(g) H° = −241.8 kJ mol−1 | (3) |
Cell potentials and overpotentials in EFFC mode
In an EFFC, the open circuit voltage (OCV) Vo is determined with the Nernst equation:16| |  | (4) |
Where, V° is the OCV at standard state;  ,
,  , and
, and  are the partial pressures of H2, O2, and H2O, respectively; z is the number of electrical charge transfers in the electrode reactions; and R and F are the ideal gas constant (8.314 J mol K−1) and Faraday's constant (96,487 C mol−1), respectively.
When current flows in an EFFC, the voltage output is reduced by various polarization losses η that should be subtracted from the OCV. Polarization losses stem from electrode reactions ηact (activation polarization), ionic and electronic conduction ηohmic (ohmic polarization), and concentration losses due to mass transfer ηconc (concentration polarization). The voltage output is:
V = Vo − ηact − ηohmic − ηconc (5)
While activation polarization ηact, ohmic polarization ηohmic, and concentration polarization ηconc are calculated using the following equations, respectively:
| |  | (6) |
| |  | (8) |
The apparent charge transfer coefficient β is in the range 0–1, which is set as 0.5 in this work; i is the current output; r is the inside resistance of an EFFC which was determined with EIS technologies in this contribution; and jo and jlim are exchange current density and limiting current density, respectively, both for the anodic and cathodic reactions. jo is calculated using the following equation:
| |  | (9) |
where
Rct is the charge transfer resistivity in the electrode reactions.
jlim can be calculated from
eqn (10):
| |  | (10) |
where
CoR is the bulk reactant concentration,
δ is the diffusion layer, and
Dε is the effective reactant diffusivity.
The diffusion of H2 and O2 in the porous component is determined with Fick's law:17
| |  | (11) |
| |  | (12) |
where
x is the depth measured from the electrode surface.
The diffusion in the porous EFFC is mainly based on molecular diffusion and Knudsen diffusion. For the Knudsen diffusion, the transport of molecules is modeled using kinetic theory,18
| |  | (13) |
where
r' is the mean pore radius and
Mi is the molar weight of species i.
The molecular binary diffusion coefficient Dij can be obtained from the Chapman–Enskog theory of ideal gases, as followed by Bird et al.17
| |  | (14) |
Then, the effective diffusion coefficient Dεi is determined by combining eqn (13) and (14) using the Bosanquet formula:19
| |  | (15) |
where
τ/
ε is the ratio of tortuosity to porosity. The
ξ/
εDij is the reciprocal of the effective molecular diffusion coefficient for an i–j binary system, and
ξ/
εDi,k is the reciprocal of the effective Knudsen diffusion coefficient for species i.
Experimental section
In order to validate the model, an EFFC was fabricated and tested. Samples of electronic conducting materials in the EFFC were prepared with LiNiCuZn based oxides by solid state reaction methods. Li2CO3 (Sigma−Aldrich, US), Ni(OH)2 (Sigma-Aldrich, US), Zn(NO3)2·6H2O (Sigma-Aldrich, US), and CuCO3·Cu(OH)2 (Sigma-Aldrich, US) were mixed and ground, then sintered at 800 °C for 2–4 h. The typical compositions are Li![[thin space (1/6-em)]](https://www.rsc.org/images/entities/char_2009.gif) :
:![[thin space (1/6-em)]](https://www.rsc.org/images/entities/char_2009.gif) Ni
Ni![[thin space (1/6-em)]](https://www.rsc.org/images/entities/char_2009.gif) :
:![[thin space (1/6-em)]](https://www.rsc.org/images/entities/char_2009.gif) Cu
Cu![[thin space (1/6-em)]](https://www.rsc.org/images/entities/char_2009.gif) :
:![[thin space (1/6-em)]](https://www.rsc.org/images/entities/char_2009.gif) Zn = 3
Zn = 3![[thin space (1/6-em)]](https://www.rsc.org/images/entities/char_2009.gif) :
:![[thin space (1/6-em)]](https://www.rsc.org/images/entities/char_2009.gif) 5
5![[thin space (1/6-em)]](https://www.rsc.org/images/entities/char_2009.gif) :
:![[thin space (1/6-em)]](https://www.rsc.org/images/entities/char_2009.gif) 4
4![[thin space (1/6-em)]](https://www.rsc.org/images/entities/char_2009.gif) :
:![[thin space (1/6-em)]](https://www.rsc.org/images/entities/char_2009.gif) 8. The material obtained was mixed with an ionic conductor, Ce0.8Sm0.2-xO2-δNa2CO3 (Na–SDC) nanocomposite with 2
8. The material obtained was mixed with an ionic conductor, Ce0.8Sm0.2-xO2-δNa2CO3 (Na–SDC) nanocomposite with 2![[thin space (1/6-em)]](https://www.rsc.org/images/entities/char_2009.gif) :
:![[thin space (1/6-em)]](https://www.rsc.org/images/entities/char_2009.gif) 3 weight ratio. The mixed powder was further sintered at 700 °C for 1 h and then pressed into disks (1.3 mm in diameter and 0.5–1.0 mm thickness) uniaxially at 300 MPa. The samples were pasted with silver as a current collector on both sides.
3 weight ratio. The mixed powder was further sintered at 700 °C for 1 h and then pressed into disks (1.3 mm in diameter and 0.5–1.0 mm thickness) uniaxially at 300 MPa. The samples were pasted with silver as a current collector on both sides.
The electrochemical impedance spectra of the EFFCs were obtained from a two-probe method using an electrochemical workstation (model VERASTA2273, Princeton Applied Research, US). Measurements were made at 50 °C intervals in air and H2 over the temperature range 300–600 °C. The frequency range was 1 MHz to 0.01 Hz with an amplitude of 10 mV.
The I–V values of EFFCs were measured using a computerized instrument (L43 Inc, Tianjin, China) in the temperature range 350–600 °C. Hydrogen and air were supplied in the range 80–110 ml min−1 under 1 atm on each side.
Results and discussion
Electrode reaction kinetics
Fig. 2 presents electrochemical impedance spectroscopy measurements of the LiNiCuZn based oxide–samarium doped ceria component for the EFFCs in air and H2 at 500 °C. It shows a “semicircle” followed by a “tail” both in H2 and air, which means that LiNiCuZn based EFFC materials have high catalytic functions both for H2 and O2 electrochemical dissociation reactions. We regressed the charge transfer resistivity Rct in the anodic and cathodic reactions, and also the resistivity of the components, with the methods developed by Kellogg et al.20 According to eqn (9), we can calculate the exchange current densities for reactions (1) and (2) using the Rct values, and further determine the activation polarization both for anodic and cathodic reactions from eqn (6).
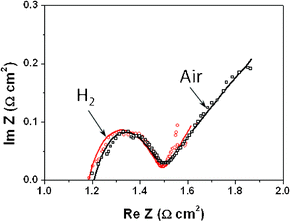 |
| | Fig. 2 Electrochemical impedance spectroscopy results for the LiNiCuZn based oxide–samarium doped ceria component for electrolyte-free fuel cells both in air and H2 at 500 °C. | |
Fig. 3 depicts the modeling results of activation polarization loss with exchange current density in 10–2000 mA cm−2. The activation polarization losses decrease from 0.35 V to 0.025 V as the exchange current density increases from 10 to 2000 mA cm−2. The experimental results show that the exchange current densities are around 2027 and 1488 mA cm−2 with LiNiCuZn–50(wt%)SDC materials for anodic and cathodic reactions at 500 °C, respectively. Compared with the exchange current density of conventional SOFCs operated at 800 °C,2 the exchange current density was about 230% higher for the cathodic reaction while in the same range for the anodic reaction in the EFFCs. This may be attributed to the better catalytic activity of the materials in the EFFCs for reaction (2).
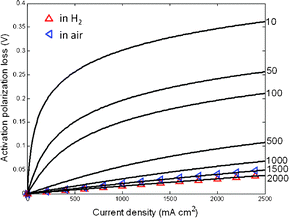 |
| | Fig. 3 The activation polarization of electrolyte-free solid oxide fuel cells with composite of Na–SDC and LiNiCuZn both in H2 and air at 500 °C. The corresponding exchange current densities are presented on the right hand side. | |
The material exhibits high conductivity (including both electronic and ionic conductivity), typically higher than 0.1 S cm−1 over 350 °C both in air and H2, with a slight enhancement in H2.
General discussion on safety and short circuits
An EFFC constructed with a single porous material consumes flammable fuels (H2, hydrocarbon) together with oxidants at 300–600 °C. Elimination of the potential for explosion is a key point for operation and commercialization of EFFCs. Depending on the operating conditions (temperature and pressure), porosity, catalytic activity and selectivity, and properties of fuels, the safety grade is different. We considered H2 which is one of most active and explosive fuels to elaborate the safety problems of an EFFC. Firstly, under the condition of OCV or no dissociation of H2 and O2, H2 and O2 diffuse from one side to the counter side. The breakthrough time of H2 and O2 is around 30 and 136 s, respectively, with the assumption of a porosity of 0.3 and a thickness of the EFFC of 0.5 mm. Consequently, the whole EFFC may be filled with a mixture of H2 and O2 both inside in the single functional component and in two chambers. Veser found that there are no homogeneous flames from explosions observed even in excess of 1000 °C at ambient pressure conditions in a microreaction channel.21 According to the theoretical analysis results of the explosion limits in the homogeneous H2–O2 system, it is confirmed that the reactors with characteristic dimensions in the sub-millimeter range become intrinsically safe due to the kinetic quenching of the radical chain mechanism.21 Herein, there is no potential of combustion or explosion inside the functional component with thickness in the range 0.6–1.0 mm. The gas chambers are kept safe by controlling the characteristic dimensions in the sub-millimeter range. Secondly, under the operating conditions there is a competition between surface electrochemical reactions (reaction (1) and (2)) and gas-phase chemical reactions (same form as reaction (3)). The catalytic activity and porosity of the materials play a major role in that competition. As shown in Fig. 4, the reaction depth of reaction (1) and (2) is in the range 5.3–1.0 and 1.4–0.25 × 10⁻⁵ m with porosity of 0.5 in 100–2000 mA cm−2. Both of them are much lower than the typical thickness of the EFFC at 0.5 mm. The effect of porosity on the reaction depth is given in Fig. 5. The reaction depth of O2 is in the range 0.6–1.4 × 1.0−5 m with a porosity of 0.2–0.5. For H2, it is in the range 2.1–5.3 × 1.0−5 m. It is shown that the reaction depth of both H2 and O2 increases along with increase in porosity. However, all of them are smaller than the thickness of an EFFC. Therefore, there is no risk of explosion under the operating conditions for an EFFC.
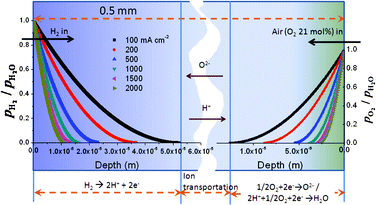 |
| | Fig. 4 The reaction depth of anodic and cathodic processes with H2 and O2. Porosity and thickness of the materials are 0.5 and 0.5 mm, respectively. | |
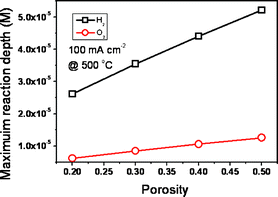 |
| | Fig. 5 The effect of porosity on the reaction depth of anodic and cathodic processes with H2 fuel and O2 oxidant. It is 0.5 mm thick. | |
In a conventional SOFC, the anode and cathode are separated by a pure ionic conductor electrolyte. There are no closed circuits for electronic conduction and no short-circuit phenomena inside an EFFC. In an EFFC, the functional component is composited of electronic and ionic conductors, and two metal current collectors also fixed on both sides. It seems that there is a closed circuit for electronic conduction inside the EFFC and it should be a short circuit. However, no short circut phenomena are observed. A possible reason is that p–n junctions may exist in EFFCs, as proved by Riess, and Okoye et al.22–24 Actually, the single functional composite of an EFFC consisted of a series of metal (Ni, Zn, Cu, Fe, etc.) oxides. Some of them are n-type semiconductors, like ZnO. The others are p-type semiconductors, like Cu2O and NiO. When fuels (e.g. H2) and air are fed into two separated sides, H2 is adsorbed and dissociated into H+ at the surface of the n-type semiconductors. Meanwhile, O2 is adsorbed and dissociated into O2− at the surface of the p-type semiconductors. Negative and positive charges are generated on the surface of the n-type and p-type semiconductors, respectively, but the junction between them becomes depleted of charge carriers, viz. nonconductive. Consequently, cell potential is generated and electric energy can be taken out of the cell. In the next step, the adsorbed H+ and O2− combined and generated H2O.
Voltage and power output
Fig. 6 and 7 exhibit the modeling and experimental results of voltage and power density with different current densities at 500 °C. The OCV is 1.02 V without voltage loss from a short circuit, the same as that for a conventional SOFC both for the experimental and modeling results. The results show a fuel cell route, viz. converting H2 and O2 into H2O and generating electricity through an electrochemical process. The maximum power density delivered is around 680 and 590 mW cm−2 at 500 °C for the experiment and model, respectively. The modeling curves fit the experimental results well, except for relatively large ohmic polarization in the modeling curves. The reason is that the resistance data used in the model was determined in air, not in situ under the operating conditions. So the contribution of H+ ionic transportation was not considered.25 This makes the measured resistance lower than that under operating conditions, and resulted in large ohmic polarization and low voltage and power output in the modeling results. In addition, the shape of the I–V curve is almost the same as the typical I–V for the solar cells based on artificial p–n junctions with a saturation current. The mechnism of EFFC from the physical perspective and with physical measurement techniques may be meaningful for further study. A new comprehensive model is being attempted to model the EFFC with a combination of enhanced measurement techniques and mathematic modeling.
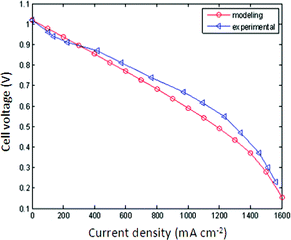 |
| | Fig. 6 Comparison of modeling voltage output with the experimental results. | |
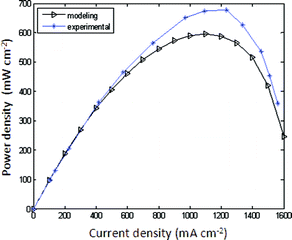 |
| | Fig. 7 Comparison of modeling power density with the experimental results, along with current density increasing at 500 °C. | |
Conclusions
A model was built to simulate an EFFC and was validated by experiment results. It revealed several important features for the emerging EFFC technology. Although the operating temperature of EFFCs is lower than that of conventional SOFCs, both the anodic and cathodic reactions are kinetically fast processes due to the good catalytic activity of the materials. The porous structure of the EFFC allows ionic (H+/O2−) transportation on the surface with enhancement of conductivity. A safety issue stems from the fact that gas-tight separators cannot be avoided under open circuit and operating conditions. Ideally, the electrode reaction depth of H2 and O2 is 1–2 orders of magnitude lower than the thickness of a typical pellet. The reaction depth decreases with the increase in operating current. The reaction depths of H2 and O2 dissociation both increase along with increase in porosity. Increasing the catalytic activity can effectively decrease the reaction depth of H2 and O2. A p–n junction may exist in the EFFCs made of various semiconductors, which can effectively eliminate short-circuit phenomena.
Acknowledgements
This work is supported by the Swedish Agency for Innovation Systems (VINNOVA), the Swedish Research Council (VR, No. 621-2011-4983), the Swedish Agency for International Development Cooperation (SIDA), and the Swedish Agency for Energy (STEM). The authors acknowledge Zhigang Zhu, Ghazanfar Abbas, and Manish Singh for measurement and discussion.
References
- B. C. H. Steel and A. Heinzel, Nature, 2001, 414, 345–352 CrossRef.
- B. Zhu, X. Wang, Y. Ma, R. Raza, H. Qin and L. Fan, Electrochem. Commun., 2011, 13, 225–227 CrossRef CAS.
- B. Zhu, R. Raza, Q. H. Liu, H. Y. Qin, Z. G. Zhu, L. D. Fan, M. Singh and P. Lund, RSC Adv., 2012, 2, 5066–5070 RSC.
- Y. Xia, X. Liu, Y. Bai, H. Li, X. Deng, X. Niu, X. Wu, D. Zhou, M. Lv, Z. Wang and J. Meng, RSC Adv., 2012, 2, 3828–3834 RSC.
- M. Nagao, M. Takahashi and T. Hibino, Energy Environ. Sci., 2010, 3, 1934–1940 CAS.
- M. Kuhn and T. W. Napporn, Energies, 2010, 3, 57–134 CrossRef CAS.
- M. Yano, A. Tomita, M. Sano and T. Hibino, Solid State Ionics, 2007, 177, 3351–3359 CrossRef CAS.
- B. E. Buergler, A. N. Grudy and L. J. Cauckler, J. Electrochem. Soc., 2006, 153, A1378–1385 CrossRef CAS.
- T. Hibino, A. Hashimoto, T. Inoue, J.-I. Tokuno, S.-I. Yoshida and M. Sano, Science, 2000, 16, 2031–2033 CrossRef.
- T. Suzuki, P. Jasinski, H. U. Anderson and F. Dogan, J. Electrochem. Soc., 2004, 151, A1678–1682 CrossRef CAS.
- A. Tomita, D. Hirabayashi, T. Hibino, M. Nagao and M. Sano, Electrochem. Solid-State Lett., 2005, 8, A63–65 CrossRef CAS.
- M. Yano, T. Kawai, K. Okamoto, M. Nagao, M. Sano, A. Tomita and T. Hibino, J. Electrochem. Soc., 2007, 154, B865–870 CrossRef CAS.
- C. K. Dyer, Nature, 1990, 343, 547–548 CrossRef CAS.
-
S. Suganuma, M. Horiuchi, M. Watanabe and R. Fukasawa, US Pat., 7 169 501B2, 2007 Search PubMed.
- T. Suzuki, P. Jasinski, V. Petrovsky, H. U. Anderson and F. Dogan, J. Electrochem. Soc., 2005, 152, A527–531 CrossRef CAS.
-
A. J. Bard and L. R. Faulker, Electrochemical Methods: Fundamentals and Applications, John Wiley & Sons Inc., New York, USA, 2nd edn, 2001 Search PubMed.
-
R. B. Bird, W. E. Stewart and E. N. Lightfoot, Transport Phenomena, John Wiley & Sons Inc., New York, USA, 2nd edn, 2002 Search PubMed.
- J. W. Veldsink, R. M. J. van Damme, G. F. Versteeg and W. P. M. van Swaajj, Chem. Eng. J., 1995, 57, 115–125 CAS.
- E. Hernandez-Pacheco, D. Singh, P. N. Hutton, N. Patel and M. D. Mann, J. Power Sources, 2004, 138, 174–186 CrossRef CAS.
- I. D. Kellogg, U. O. Koylu, V. Petrovsky and F. Dogan, Int. J. Hydrogen Energy, 2009, 34, 5138–5143 CrossRef CAS.
- G. Veser, Chem. Eng. Sci., 2001, 56, 1265–1273 CrossRef CAS.
- I. Riess, Solid State Ionics, 1992, 52, 127–134 CrossRef CAS.
- I. Riess, Solid State Ionics, 2003, 157, 1–17 CrossRef CAS.
-
K. E. Okoye, E. C. Fjiogu and S. Matsul, US Pat., 0 258 276, 2009 Search PubMed.
- Q. H. Liu and B. Zhu, Appl. Phys. Lett., 2010, 97, 183115 CrossRef.
Footnote |
| † Current affiliation: BRANE Lab, Departments of Chemical and Biomolecular Engineering and Mechanical, Aerospace and Biomedical Engineering, The University of Tennessee, Knoxville, 37996, TN, USA. |
|
| This journal is © The Royal Society of Chemistry 2012 |
Click here to see how this site uses Cookies. View our privacy policy here. 

 ,
,  , and
, and  are the partial pressures of H2, O2, and H2O, respectively; z is the number of electrical charge transfers in the electrode reactions; and R and F are the ideal gas constant (8.314 J mol K−1) and Faraday's constant (96,487 C mol−1), respectively.


![[thin space (1/6-em)]](https://www.rsc.org/images/entities/char_2009.gif) :
:![[thin space (1/6-em)]](https://www.rsc.org/images/entities/char_2009.gif) Ni
Ni![[thin space (1/6-em)]](https://www.rsc.org/images/entities/char_2009.gif) :
:![[thin space (1/6-em)]](https://www.rsc.org/images/entities/char_2009.gif) Cu
Cu![[thin space (1/6-em)]](https://www.rsc.org/images/entities/char_2009.gif) :
:![[thin space (1/6-em)]](https://www.rsc.org/images/entities/char_2009.gif) Zn = 3
Zn = 3![[thin space (1/6-em)]](https://www.rsc.org/images/entities/char_2009.gif) :
:![[thin space (1/6-em)]](https://www.rsc.org/images/entities/char_2009.gif) 5
5![[thin space (1/6-em)]](https://www.rsc.org/images/entities/char_2009.gif) :
:![[thin space (1/6-em)]](https://www.rsc.org/images/entities/char_2009.gif) 4
4![[thin space (1/6-em)]](https://www.rsc.org/images/entities/char_2009.gif) :
:![[thin space (1/6-em)]](https://www.rsc.org/images/entities/char_2009.gif) 8. The material obtained was mixed with an ionic conductor, Ce0.8Sm0.2-xO2-δNa2CO3 (Na–SDC) nanocomposite with 2
8. The material obtained was mixed with an ionic conductor, Ce0.8Sm0.2-xO2-δNa2CO3 (Na–SDC) nanocomposite with 2![[thin space (1/6-em)]](https://www.rsc.org/images/entities/char_2009.gif) :
:![[thin space (1/6-em)]](https://www.rsc.org/images/entities/char_2009.gif) 3 weight ratio. The mixed powder was further sintered at 700 °C for 1 h and then pressed into disks (1.3 mm in diameter and 0.5–1.0 mm thickness) uniaxially at 300 MPa. The samples were pasted with silver as a current collector on both sides.
3 weight ratio. The mixed powder was further sintered at 700 °C for 1 h and then pressed into disks (1.3 mm in diameter and 0.5–1.0 mm thickness) uniaxially at 300 MPa. The samples were pasted with silver as a current collector on both sides.


