An aqueous anionic/nonionic surfactant two-phase system in the presence of salt. 1. Rheological behavior and microstructure
Hua-Neng
Xu
*
State Key Laboratory of Food Science and Technology, School of Food Science and Technology, Jiangnan University, 1800 Lihu Avenue, Wuxi, Jiangsu 214122, P. R. China. E-mail: hnxujnu@163.com
First published on 5th October 2012
Abstract
Aqueous binary surfactant solutions, based on the cloud point phenomenon, have been utilized to design efficient extraction of a variety of substances. In this study, the effect of the anionic surfactant sodium dodecyl sulfate (SDS) on the clouding behaviour of aqueous nonionic surfactant solutions of Triton X-114 (TX-114), in the presence of 100 mM sodium chloride (NaCl), has been studied as a function of temperature by means of turbidity, dynamic light scattering (DLS), and rheo-small angle light scattering (Rheo-SALS). It is found that the addition of 2 mM SDS lowers the phase separation temperature of the surfactant solution by about 2 °C. The hydrodynamic radius of the surfactant aggregates increases with increase of temperature and SDS concentration. The change in microstructure of the surfactant aggregates at different temperature and SDS concentrations is also reflected by the characteristic length and aspect ratio extracted from their SALS patterns, which range from 269 to 623 nm and from 1.01 to 1.40, respectively. The increasing characteristic length and aspect ratio with SDS concentration indicate the growth of the mixed surfactant aggregates is in the flow direction and these elongated aggregates can align under shear.
Introduction
Aqueous nonionic surfactant solutions exhibit a macroscopic phase separation to form a micelle-rich phase and a micelle-poor phase above a characteristic temperature, called the cloud point.1,2 The phase separation phenomenon has been widely used in the extraction of trace inorganic, organic materials, nanoparticles and biomolecules from different sources.3–9 The cloud point of nonionic surfactants in aqueous solutions is found to be strongly influenced by various additives, such as electrolytes, organic additives, non-electrolytes and ionic surfactants.10 The presence of the additives in the surfactant solutions modifies the surfactant–solvent interactions, which consequently affect the micellar shape, size and phase behavior of the surfactants.The micellization and phase behavior of anionic/nonionic mixed surfactants in aqueous solutions have been investigated by a number of techniques including surface tension, conductance, fluorescence spectroscopy, dynamic light scattering, turbidity, and small-angle neutron scattering.11–22 It is helpful to understand how the interactions in surfactant mixtures affect the solution properties, and to elucidate their microstructures on a wide range of length-scales. Recently, a combination of rheology and scattering techniques has also been used to investigate the response of mixed surfactant systems to shear flow, and in particular to map out the response of the microstructure over the flow profile.23–27 The combination provides a powerful method to quantify the various length and time scales, thus providing all of the relevant mesoscale parameters that link chemical composition to rheology.
In this study, the effect of sodium dodecyl sulfate (SDS) on the aggregation and phase separation of aqueous solutions of Triton X-114 (TX-114) in the presence of 100 mM NaCl, is investigated. The non-ionic surfactant of TX-114 is focused on, since it has been used extensively to extract and separate biomolecules.8,9,28,29 The underlying aggregate structures of the surfactant solutions were characterized by turbidity, dynamic light scattering (DLS), and rheo-small angle light scattering (rheo-SALS) measurements. Moreover, the dominating interactions contributing to the formation and growth of the mixed surfactant aggregates are estimated. The particular focus of this study is on the effects of flow on the formed microstructures of the mixed surfactant aggregate in the solutions. This will be helpful in the construction of appropriate mixed surfactant systems for cloud point extraction.
Experimental methods
Materials and solution preparation
TX-114 ((1,1,3,3-tetramethylbutyl)phenyl-polyethylene glycol) was purchased from Aladdin, China, and used without further purification. SDS and NaCl were purchased from Sinopharm Chemical Reagent Co.All solutions were prepared by weighing the components. Solutions were mixed for 24 h using a magnetic stirrer to ensure complete homogeneity. The concentration of TX-114 and NaCl was fixed at 100 mM, and the concentration of SDS was 0, 1 or 2 mM. The presence of 100 mM NaCl moves the cloud point of the aqueous mixed surfactant solutions to near room temperature, which can be utilized to extract and separate biomolecules.
Turbidity measurements
Turbidity, expressed as 100 − transmittance%, was recorded as a function of temperature from 20 to 30 °C, with the solution continuously stirred during the heating. The transmittance was monitored with a Brinkman PC 950 colorimeter equipped with a 2 cm path-length optical probe, operating at 450 nm.30–32 All measured values were corrected by subtracting the turbidity of water. Each turbidity experiment was repeated in triplicate and the standard deviations were always less than 1% of the mean. The phase separation temperature is defined as the temperature where the turbidity observed was the maximum.Dynamic light scattering (DLS)
DLS measurements of the aqueous TX-114 solutions were performed with a Malvern Instruments Zetasizer Nanosystem (Malvern Instruments, UK) at a scattering angle of 173°. The samples were stirred for at least 2 h before measurements and filtered with Whatman (0.2 mm) filters prior to measurements. The intensity autocorrelation functions were analyzed by using the CONTIN method, and the apparent hydrodynamic radius (Rh) was deduced from the diffusion coefficient D by the Stokes–Einstein formula Rh = kBT/(6πηD), where kB, T and η are the Boltzmann constant, the absolute temperature, and the viscosity of the solvent, respectively. This instrument provides temperature regulation in the range of 20–60 °C with an accuracy of ±0.1 °C. Each DLS experiment was repeated in triplicate. The results were presented as an average, and the standard deviations were always less than 5% of the mean.Rheology and small-angle light scattering
Rheology and SALS data were collected simultaneously using an AR-G2 rheometer (TA Instruments, New Castle, DE) with a commercially available SALS attachment. The rheo-optical experimental apparatus has already been described elsewhere.33–35 A transparent parallel plate configuration (50 mm diameter) with a 1 mm gap was used for all rheology tests. The measurements were made at shear rates from 1 to 100 s−1, and temperatures from 20 to 30 °C at a rate of 1 °C min−1. A He–Ne laser (λ = 635 nm) was used and SALS images were recorded for each of the samples. The accessible range of scattering vectors q is from 1.38 to 6.10 μm−1, where q = (4πn0/λ)sin(θ/2) depends on the distance between the sample and screen, θ is the scattering angle, n0 is the refractive index of water, and λ is the wavelength of the laser. The SALS images were analyzed using ImageJ with standard protocols for subtracting the background and removing the beam stop from the raw images.27,36–38 The normalized mean intensity is defined as the ratio of the average intensity of the image (after removal of the beam stop) to the intensity if all pixels in the image were saturated (a value of 255 for the 8-bit camera used).The characteristic length (ac) of the aggregates was determined using Debye–Bueche plots (I−0.5vs. q2).27,36,39 A linear fit to the data plotted in the Debye–Bueche format was calculated in the flow or vorticity direction using the method of least squares. The slope and intercept of the linear fit were used to calculate a characteristic length [ac = (slope/intercept)0.5] for the aggregates at various conditions. In addition, the distortion of the aggregates was characterized by the aspect ratio, which was determined by taking the ratio of the characteristic length values in the flow and vorticity directions.
Results and discussion
Fig. 1 shows turbidity results of the TX-114 solutions as a function of SDS concentration and temperature. It is obvious that, when SDS is added to the TX-114 solutions in the presence of NaCl, the turbidity curve changes significantly. The turbidity profile indicates a step-like increase and the temperature at which the maximum turbidity is observed is considered as the phase separation temperature. With an increase of the concentration of SDS, the phase separation temperature decreases, and the presence of 2 mM SDS in the solution reduces the phase separation temperature by about 2 °C. When SDS is added to the solutions, the formation of mixed aggregates with surface charge will cause repulsion between micelles and hinder their aggregation. However, due to the presence of NaCl in the solutions, the original charge distribution of the mixed surfactant micelle is swamped and the corresponding electrostatic repulsions are screened,40 hence a depression in phase separation temperature results.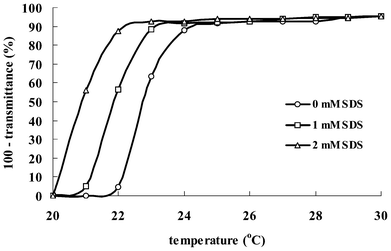 | ||
| Fig. 1 Turbidity (expressed as 100 − transmittance%) of the TX-114 solutions with different concentrations of SDS (0, 1 and 2 mM) as a function of temperature. | ||
The quantification of the surfactant aggregate size for different temperatures necessitates the use of a particle sizing study, which was achieved through dynamic light scattering measurements. Fig. 2 and 3 show the hydrodynamic radius (Rh) distributions of the TX-114 solutions with various concentrations of SDS (0, 1 and 2 mM) at 20 and 25 °C, respectively. The DLS results reveal that there are two kinds of aggregates in the solutions with average hydrodynamic radius in the nanorange and in submicron range, respectively. In a recently published paper, we have assigned the two kinds of aggregates as micelles and vesicles according to their sizes.36 With the addition of SDS and an increase of temperature, the center of the “drop” population shifts to larger sizes in the DLS plot and the population of larger “drops” increases, which indicates a considerable aggregate growth occurs in the solutions. This suggests that the SDS addition plays a significant role in determining the size of aggregates in the solutions, and a considerable number of micelles are converted into vesicles with increasing SDS concentration. At 25 °C, the micelle to vesicle transition is almost complete upon the addition of 2 mM SDS. The increase in the micellar size can be attributed to the molecular packing and energy change in the system. Since the incorporation of SDS molecules in the micellar phase increases the average packing parameter, the micelle swells causing a change in the micelle shape from spherical to worm-like micelles or vesicles, with the extent of the transition depending on the SDS concentration and temperature.
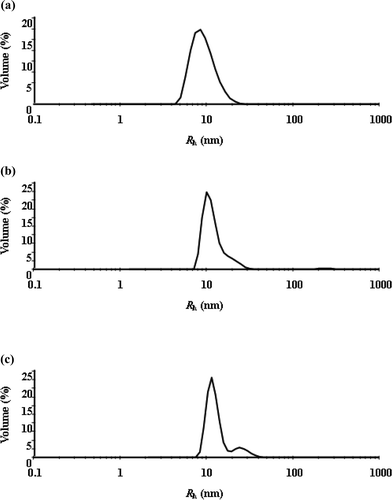 | ||
| Fig. 2 Hydrodynamic radius (Rh) distributions of TX-114 solutions at 20 °C with different concentrations of SDS: (a) 0, (b) 1 and (c) 2 mM SDS. | ||
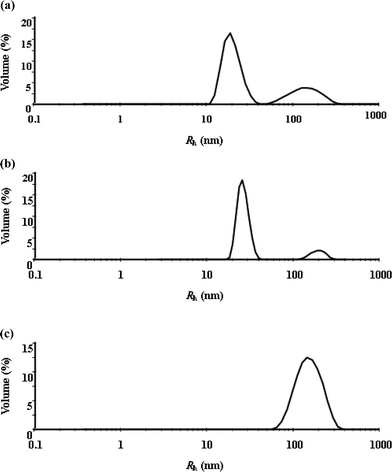 | ||
| Fig. 3 Hydrodynamic radius (Rh) distributions of TX-114 solutions at 25 °C with different concentrations of SDS: (a) 0, (b) 1 and (c) 2 mM SDS. | ||
Fig. 4 shows the viscosity evolution of the TX-114 solutions when increasing the shear rate from 1 to 100 s−1 at constant temperatures of 20 and 25 °C, and a set of scattering images, which provide information about the microstructures of the solutions during the shear periods are shown in Fig. 5. Upon SDS addition, there is a marked viscosity increase at all shear rates and temperatures for the TX-114 solutions. It is known that the viscosity is related to the particle size and geometrical shape; i.e., the viscosity increases with particle size and particle asymmetry. As has been discussed in the previous section, since the incorporation of SDS molecules in the micellar phase increases the average packing parameter, the micelle swells causing a change in the micelle shape from spherical to worm-like micelles or vesicles. The aggregate growth then would result in an increase in the viscosity of the solutions. At 20 °C, in the available range of the shear rates, a plateau (Newtonian behavior) is observed for all the curves of the solutions. At 25 °C, the viscosity for the solutions with 1 and 2 mM SDS decreases with increasing shear rate, while the solution with 0 mM SDS shows shear-thickening at higher shear rates. The difference can also be observed from the SALS images, while transitions from no scattering at 20 °C to ellipsoidal or circular scattering at 25 °C are observed. An almost completely black image is observed for all the solutions at 20 °C as the phase separation is a nanoscale phenomenon at 20 °C and thus cannot be detected by SALS. The ellipsoidal or circular scattering at 25 °C indicates the appearance of droplets on the micrometer scale.
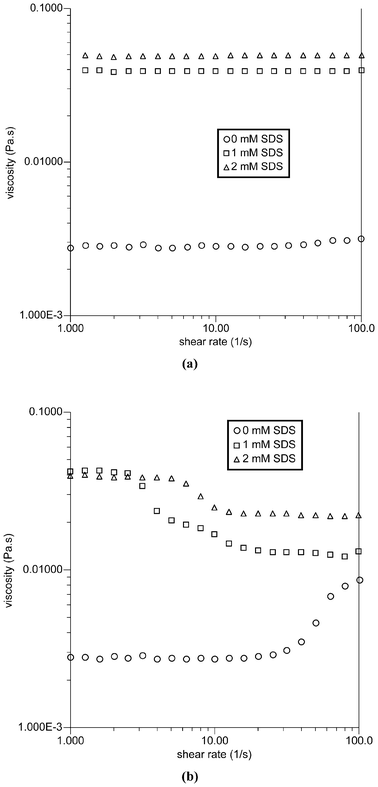 | ||
| Fig. 4 Viscosity as a function of shear rate for TX-114 solutions at (a) 20 and (b) 25 °C. | ||
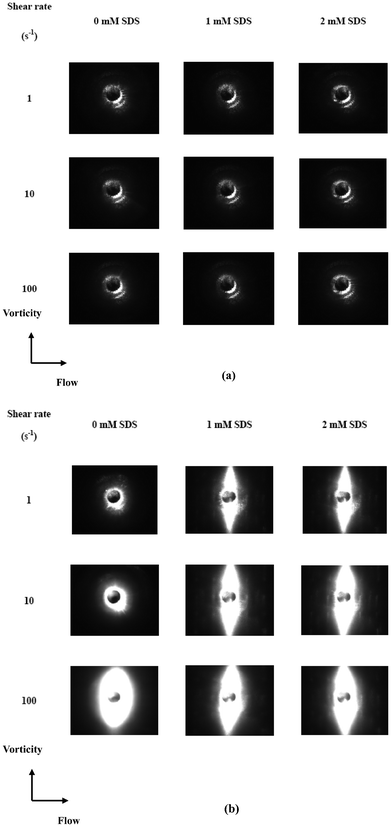 | ||
| Fig. 5 Small-angle light scattering images as a function of shear rate for TX-114 solutions at (a) 20 and (b) 25 °C. | ||
The phase separation was also characterized using a temperature sweep at constant shear. The TX-114 solutions were heated from 20 to 30 °C at a rate of 1 °C min−1 while being held at a constant shear rate of 10 s°. The evolutions of the shear viscosity are shown in Fig. 6. For the TX-114 solutions, the viscosity behaviour shows two distinct regions. At low temperatures, the viscosity increases gradually with increase of temperature until a certain value (0 mM SDS, 23.5 °C; 1 mM SDS, 23 °C; 2 mM SDS, 21 °C), and above this temperature, the viscosity then decreases gradually with further increase of temperature. The evolution of the SALS patterns for the TX-114 solutions when heating from 20 to 30 °C is shown in Fig. 7. The SALS patterns demonstrate the transition from no scattering to circular scattering for the solution with 0 mM SDS with increasing temperatures to 24 °C, the appearance of circular droplets for the solution with 1 mM SDS, and the appearance of ellipsoidal droplets for the solution with 2 mM SDS. It is obvious that surfactant aggregate growth from the nanometer to micrometer scale results in a viscosity increase of the solutions. However, beyond the phase separation temperature, the surfactant aggregates become sufficiently large to remain in a stable suspension. Loss of these big aggregates to sedimentation will then manifest itself by a viscosity decrease of the solutions.
 | ||
| Fig. 6 Viscosity as a function of temperature for TX-114 solutions at a shear rate of 10 s−1. | ||
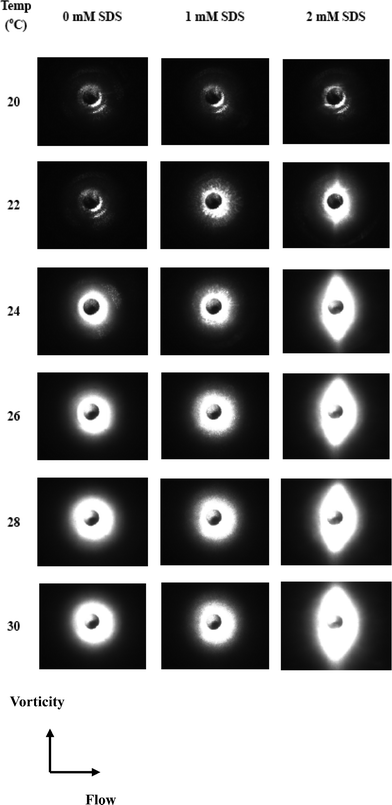 | ||
| Fig. 7 Small-angle light scattering images as a function of temperature at a shear rate of 10 s−1 for TX-114 solutions. | ||
The characteristic length and aspect ratio of the surfactant aggregates extracted from the SALS patterns are shown in Fig. 8. It is seen that the characteristic length increases with the increase of SDS concentration. The ellipsoidal droplets of the solution with 2 mM SDS have an aspect ratio of ∼1.4, which indicates that the growth of the droplets is higher in the flow direction. The aspect ratio of the solutions with 0 and 1 mM SDS, with a value of ∼1, indicate that the surfactant aggregates grow with no preferential orientation. The increasing characteristic length and aspect ratio with higher SDS concentration indicate the growth of the aggregates is in the flow direction and these elongated aggregates can align under shear. The changes arise from the interactions between the TX-114 and SDS molecules. As discussed in the previous section, the decrease in the phase separation temperature of the mixed surfactant system suggests the original charge distribution is swamped and the corresponding electrostatic repulsions between the polar head groups of SDS decrease. Hence, the surfactant aggregates can come into contact and overlap with each other due to the local structural reorganization; they can fuse with other surfactant aggregates forming larger aggregates. Such intermicellar interactions and a transition to larger surfactant aggregates, results in a corresponding rise in turbidity and viscosity.
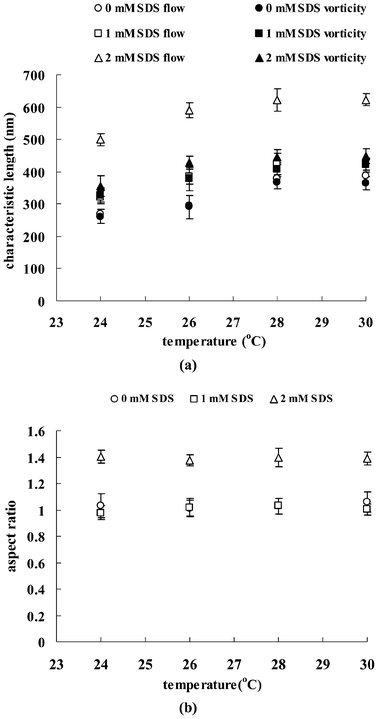 | ||
| Fig. 8 Characteristic length (a) and aspect ratio (b) of aggregates for TX-114 solutions a function of temperature at a shear rate of 10 s−1. | ||
Conclusions
The effect of SDS addition on the aggregation and phase separation behavior of aqueous TX-114 solutions, in the presence of 100 mM NaCl, has been shown by means of turbidity, DLS and rheo-SALS. The results demonstrate that the phase separation temperature decreases with the increasing SDS concentration. The hydrodynamic radius of surfactant aggregates and the viscosity of the solutions increase with the increasing temperature and SDS concentration. The addition of SDS has an impact upon the microstructures of the aggregates and their response to the flow field. The characteristic length and aspect ratio of the aggregates increases significantly after the addition of 2 mM SDS.Acknowledgements
The work was financially supported by the National Natural Science Foundation of China (No. 20906039), the Fundamental Research Funds for the Central Universities (No. JUSRP11124), and the Priority Academic Program Development of Jiangsu Higher Education Institutions.References
- M. Corti, C. Minero and V. Degiorgio, J. Phys. Chem., 1984, 88, 309–317 CrossRef CAS.
- G. Zhao and S. B. Chen, Langmuir, 2006, 22, 9129–9134 CrossRef CAS.
- W. L. Hinze and E. Pramauro, Crit. Rev. Anal. Chem., 1993, 24, 133–177 CrossRef CAS.
- F. H. Quina and W. L. Hinze, Ind. Eng. Chem. Res., 1999, 38, 4150–4168 CrossRef CAS.
- Y. J. Nikas, C. L. Liu, T. Srivastava, N. L. Abbott and D. Blankschtein, Macromolecules, 1992, 25, 4797–4806 CrossRef CAS.
- C. L. Liu, Y. J. Nikas and D. Blankschtein, Biotech. Bioeng., 1996, 52, 185–192 CrossRef CAS.
- X. Feng, J. Zhang, S. Cheng, C. Zhang, W. Li and B. Han, Green Chem., 2008, 10, 578–583 RSC.
- J. S. Becker, O. R. T. Thomas and M. Franzreb, Sep. Pur. Tech., 2009, 65, 46–53 CrossRef CAS.
- F. Mashayekhi, A. S. Meyer, S. A. Shiigi, V. Nguyen and D. T. Kamei, Biotech. Bioeng., 2009, 102, 1613–1623 CrossRef CAS.
- P. Mukherjee, S. K. Padhan, S. Dash, S. Patel and B. K. Mishra, Adv. Colloid Interface Sci., 2011, 162, 59–79 CrossRef CAS.
- C. B. Douglas and E. W. Kaler, Langmuir, 1991, 7, 1097–1102 CrossRef CAS.
- E. Feitosa and W. Brown, Langmuir, 1998, 14, 4460–4465 CrossRef CAS.
- A. Shiloach and D. Blankschtein, Langmuir, 1998, 14, 7166–7182 CrossRef CAS.
- K. Toerne, R. Rogers and R. von Wandruszka, Langmuir, 2000, 16, 2141–2144 CrossRef CAS.
- H. P. M. de Oliveira and M. H. Gehlen, Langmuir, 2002, 18, 3792–3796 CrossRef.
- J. Penfold, E. Staples and I. Tucker, J. Phys. Chem. B, 2002, 106, 8891–8897 CrossRef CAS.
- T. Joshi, J. Mata and P. Bahadur, Colloids Surf A, 2005, 260, 209–215 CrossRef CAS.
- J. P. Mata, J. Disper. Sci. Techno., 2006, 27, 49–54 CrossRef CAS.
- T. Patel, G. Ghosh, V. Aswal and P. Bahadur, Colloid Polym. Sci., 2009, 287, 1175–1181 CAS.
- S. Ghosh, A. D. Burman, G. C. De and A. R. Das, J. Phys. Chem. B, 2011, 115, 11098–11112 CrossRef CAS.
- I. Grillo and J. Penfold, Langmuir, 2011, 27, 7453–7463 CrossRef CAS.
- R. K. Mahajan and D. Nandni, Ind. Eng. Chem. Res., 2012, 51, 3338–3349 CrossRef CAS.
- B. A. Schubert, E. W. Kaler and N. J. Wagner, Langmuir, 2003, 19, 4079–4089 CrossRef CAS.
- B. A. Schubert, N. J. Wagner and E. W. Kaler, Langmuir, 2004, 20, 3564–3573 CrossRef CAS.
- J. Penfold, E. Staples, I. Tucker, P. Carroll, I. Clayton, J. S. Cowan, G. Lawton, S. Amin, A. Ferrante and N. Ruddock, J. Phys. Chem. B, 2006, 110, 1073–1082 CrossRef CAS.
- J. Penfold and I. Tucker, J. Phys. Chem. B, 2007, 111, 9496–9503 CrossRef CAS.
- M. W. Liberatore, N. B. Wyatt and M. Henry, Langmuir, 2009, 25, 13376–13383 CrossRef CAS.
- L. E. G. de la Vara and B. L. Alfaro, Anal. Biochem., 2009, 387, 280–286 CrossRef.
- M. A. O. da Silva and M. A. Z. Arruda, Talanta, 2009, 77, 985–990 CrossRef.
- P. L. Dubin, Y. Li and W. Jaeger, Langmuir, 2008, 24, 4544–4549 CrossRef CAS.
- E. Kizilay, S. Maccarrone, E. Foun, A. D. Dinsmore and P. L. Dubin, J. Phys. Chem. B, 2011, 115, 7256–7263 CrossRef CAS.
- A. C. Kumar, H. Erothu, H. B. Bohidar and A. K. Mishra, J. Phys. Chem. B, 2011, 115, 433–439 CrossRef CAS.
- C. Baravian, F. Caton, J. Dillet and J. Mougel, Phys. Rev. E, 2005, 71, 066603 CrossRef CAS.
- C. Baravian, F. Caton and J. Dillet, Rheol. Acta., 2004, 43, 427–432 CrossRef CAS.
- C. Baravian, J. Mougel, F. Caton and A. Durand, AIChE J., 2007, 53, 1994–2000 CrossRef CAS.
- H. N. Xu, S. F. Ma and W. Chen, Soft Matter, 2012, 8, 3856–3863 RSC.
- S. R. Kline, J. Appl. Crystallogr., 2006, 39, 895–900 CrossRef CAS.
- TA Instruments, AR Series Small Angle Light-Scattering (SALS) Accessory Manual. TA Instruments: Newark, DE, 2008.
- L. M. Walker, W. A. Kernick III and N. J. Wagner, Macromolecules, 1997, 30, 508–514 CrossRef CAS.
- L. Marszall, Langmuir, 1988, 4, 90–93 CrossRef CAS.
| This journal is © The Royal Society of Chemistry 2012 |