Simultaneous bioelectrochemical degradation of algae sludge and energy recovery in microbial fuel cells†
Huan
Wang
,
Lu
Lu
,
Fuyi
Cui
*,
Dongmei
Liu
,
Zhiwei
Zhao
and
Yongpeng
Xu
School of Municipal and Environmental Engineering, Harbin Institute of Technology, 73 Huanghe Road, P.O. Box 2602, Nangang District, Harbin, Heilongjiang Province 150090, China. E-mail: cuifuyi_hit@163.com; cuifuyi@hit.edu.cn; Fax: (+86) 451 86282098
First published on 30th May 2012
Abstract
Treatment of algae-laden raw water in drinking water treatment plants can produce large amounts of algae sludge (AS), which can cause serious pollution of the environment if improperly treated. Microbial fuel cells (MFCs) provide a new opportunity for the sustainable production of electrical energy from the removed AS. After 120 h of degradation, the maximum power density was 2.8 ± 0.0 W m−3 and the electrical energy recovery was 0.14 kWh kg−1 COD in raw algae sludge (R-AS)-fed MFCs. The total chemical oxygen demand (TCOD) removal efficiency was 33 ± 5%. More than half of the SCOD, soluble carbohydrate, soluble protein and VFAs were effectively removed in MFCs. Alkaline pretreatment was conducted to further increase the removal of organic matter and enhance the MFC performance. When using alkaline-pretreated algae sludge (A-AS), the maximum power density and TCOD removal increased by 46 ± 1% and 73 ± 4%, respectively. Analysis of microbial community structure in the anode biofilm of MFCs based on the 16S rRNA gene clone library showed that the AS was mainly degraded through syntrophic interaction between fermentation bacteria and electrochemically active bacteria.
1. Introduction
At present, there are several lakes undergoing eutrophication, such as Dianchi Lake, Taihu Lake and Chaohu Lake, that are still used as primary drinking water sources in China1 due to the shortage of water resources. In these lakes, the algal cell densities can reach 106–109cells per litre during algal blooming seasons.2 The algae-laden raw water could result in the production of large amounts of algal residues during the drinking water treatment process.Dissolved air flotation (DAF) with coagulants is a common approach used in drinking water treatment plants (DWTPs) for the removal of algae.3,4 In a DAF system, pressurized air is injected into the water treatment tank, resulting in fine air bubbles that attach to algae and float to the surface, forming algae sludge (AS). The AS mainly includes a large number of polymer-based algae, organic fragments of dead material, and small amounts of inorganic composites. Generally, the volume of AS accounts for 0.4% of the DAF capacity during algal blooming seasons.2 Jie Yuan DWTP, Tianjin, China, has one of the largest DAF facilities in the world, with a 500![[thin space (1/6-em)]](https://www.rsc.org/images/entities/char_2009.gif) 000 m3 d−1 (132 MGD) capacity5 in which the yields of AS are approximately 2000 m3 d−1. Because AS is costly to treat, most AS in Chinese DWTPs is directly discharged into the sewer, thus significantly increasing the pollutant load downstream of the wastewater treatment plant. AS is also indiscriminately dumped outside of the treatment plant, which can cause serious sanitation problems. AS is an attractive biomass, but it has not been effectively utilized. To date, little information is known about the treatment and utilization of AS, aside from a few studies on the generation of energy products (e.g., biodiesel, methane, and hydrogen) from algae collected from lakes, reservoirs or wastewater ponds.6
000 m3 d−1 (132 MGD) capacity5 in which the yields of AS are approximately 2000 m3 d−1. Because AS is costly to treat, most AS in Chinese DWTPs is directly discharged into the sewer, thus significantly increasing the pollutant load downstream of the wastewater treatment plant. AS is also indiscriminately dumped outside of the treatment plant, which can cause serious sanitation problems. AS is an attractive biomass, but it has not been effectively utilized. To date, little information is known about the treatment and utilization of AS, aside from a few studies on the generation of energy products (e.g., biodiesel, methane, and hydrogen) from algae collected from lakes, reservoirs or wastewater ponds.6
Microbial fuel cells (MFCs) would be a new method for treating AS with simultaneous electricity generation. An MFC consists of an anode and cathode connected by a load. In the anode, the electrochemically active bacteria can oxidize various types of organic compounds (e.g., volatile fatty acids, carbohydrates, proteins, alcohols, and lipids)7 into electrons and protons. The electrons are transferred through a circuit to the cathode, where they combine with protons and electron acceptors (e.g., oxygen).8 In a previous study, single-chamber MFCs were directly fed with two types of pure algae powder, and yielded the maximum power densities of 0.98 W m−2 (Chlorella vulgaris) and 0.76 W m−2 (Ulva lactuca).9 AS is a practical mixture and has more complex compositions compared to pure algae. The practical utilization of AS for electricity production has not been examined. Moreover, there have been no reports about the effect of the pretreated AS (or algae) on the performance and the microbial community structures of the MFC.
This study aims to degrade AS and simultaneously convert this organic matter into electrical energy using a two-chamber MFC. To improve MFC performance, pretreatment was used to accelerate the hydrolysis rate and make the waste algal organic matter more bioavailable. Compared to the pretreatment methods reported (e.g., thermal chemicals, hydrolytic enzymes, microwaves, and ultrasound),10 alkaline treatment can be considered as the most economical and practical pretreatment method.11 The effect of alkaline pretreatment on MFC performance and the degradation of organic matter were investigated. In addition, we used a 16S rRNA gene clone library to study the microbial community structure of anodic biofilm in MFCs.
2. Experimental
2.1. Algae sludge
The algae sludge (AS) was collected from Jie Yuan DWTP in Tianjin, China and was stored at 4 °C prior to use. The AS was tested within one week after collection, and its characteristics are as follows: pH 6.8 ± 0.2, suspended solids (SS) 35260 ± 680 mg L−1, volatile solids (VS) 14450 ± 340 mg L−1, and total chemical oxygen demand (TCOD) 23280 ± 710 mg L−1 (triplicate analysis). All of the parameters were measured according to the standard methods.12 The alkaline pretreatment was performed as follows: AS was subjected to fermentation at constant pH 11 over 12 days in 500 mL media storage bottles with magnetic stirring at a speed of 80 rpm.13 After fermentation, pH of the treated AS was adjusted to 7. The AS solutions fed to MFCs were prepared by mixing raw AS (R-AS) or alkaline-pretreated AS (A-AS) with a 50 mM phosphate buffer solution (PBS) (Na2HPO4, 4.58 g L−1; NaH2PO4·H2O, 2.45 g L−1; NH4Cl, 0.31 g L−1; KCl, 0.13 g L−1). The characteristics of the buffered R-AS and A-AS are shown in Table 1.
2.2. MFCs construction and operation
Two-chamber MFCs consisted of two cuboid polymethyl methacrylate chambers (7 cm × 4.5 cm × 7 cm). The working volume was 200 mL in each chamber. The anodic and cathodic chambers were separated by a cation exchange membrane (CEM) (CMI-7000, Membrane International Inc., USA). The CEM surface area was 30.25 cm2, and it was pretreated as previously recommended.8 The anode was ammonia gas-treated graphite brushes (4 cm in diameter × 4 cm in length; fiber: T700-12 K, Toray Industries Co., Ltd.).14 The cathode was carbon cloth (5 cm × 5 cm) coated with 0.5 mg cm−2 of Pt (20 wt% Pt/C, JM). The electrodes were connected to a 1 kΩ external resistor with copper wire.The anode of the MFC was inoculated with domestic wastewater and used R-AS or A-AS as a substrate. The wastewater inoculum was omitted from the medium when the output current was larger than 0.1 mA (1 kΩ resistor). Thereafter, the MFCs were fed only buffered R-AS or A-AS in fed-batch mode. Magnetic stirring (100 rpm) was used to mix the medium in the anodic chamber. The cathode chamber was filled with 50 mM PBS and was continuously aerated at 100 mL min−1 to provide dissolved oxygen as the electron acceptor at the cathode. For each batch cycle, another MFC with an open circuit served as a control. All tests were conducted using duplicate reactors over more than three cycles at room temperature (21 ± 2 °C).
2.3. Analyses and calculations
The soluble protein concentration was determined by the Bicinchoninic Acid Assay (BCA Protein Assay Kit; Pierce). The carbohydrate was measured using the phenol–sulfuric method.15 The volatile fatty acids (VFAs) (acetic, propionic, butyric and valeric acid) were measured using gas chromatography (7890A, Agilent, Inc., USA). The COD conversion factors were 1.5 g COD g protein−1, 1.06 g COD g carbohydrate−1, 1.07 g COD g acetic acid−1, 1.51 g COD g propionic acid−1, 1.82 g COD g butyric acid−1 and 2.04 g COD g valeric acid−1.16The current in the circuit was determined by monitoring the voltage drop across a resistor (1 kΩ) using a data acquisition system (2700, Keithley Instruments Inc., USA) every 10 min. Power density, P (mW m−2), was obtained according to P = IV/A, where A (m2) is the projected surface area of the cathode (25 cm2). The maximum power density was determined by varying the external resistance (between 50 Ω and 100 KΩ). Cyclic voltammetry was conducted using a potentiostat (CHI 660D, Chenhua, China). Electrical energy recovery was calculated according to peak voltage.17
2.5 Community analysis
The graphite fibers were cut from different locations on the anode and fragmented using sterile scissors. The residual AS attached on the fibers was gently rinsed with sterile water. Total genomic DNA was extracted using a PowerSoil DNA Isolation Kit (Mo Bio Laboratories Inc. Carlsbad, CA, USA) according to the manufacturer's instructions. The 16S rRNA gene fragments were amplified using primers 8F: 5′-AGAGTTTGATCCTGGCTCAG-3′ (E. coli 16S rRNA positions 8 to 27) and 1541R: 5′-AAGGAGGTGATCCAGCCGCA-3′ (E. coli 16S rRNA positions 1522 to 1541).18 PCR amplification was performed as previously described by Xing et al.19Operational taxonomic units (OTUs) from the clone library were defined with the DOTUR 1.53 program based on a cutoff value of 0.03 (equivalent to 97% similarity). Rarefaction curves and species richness estimators (ACE and Chao1) were calculated by the DOTUR 1.53 program. The 16S rRNA sequences were analyzed against the GenBank database (http://www.ncbi.nlm.nih.gov) and Ribosomal Database Project II (RDP II; http://rdp.cme.msu.edu). The phylogenic tree of 16S rRNA gene sequences was constructed using the neighbor-joining method in the MEGA 4.1 program. The 16S rRNA gene sequences were submitted in the GenBank database under accession numbers JQ328195 to JQ328244.
3. Results and discussion
3.1. Current generation from raw and alkaline-pretreated algae sludge
Following an acclimatization period of approximately 2 months, constant electrical power was obtained using raw algae sludge (R-AS) and alkaline-pretreated algae sludge (A-AS) (Fig. 1). After being fed with both R-AS and A-AS, the MFC generated current immediately, and the current rapidly achieved a plateau. The current remained stable at 0.52 ± 0.02 mA and 0.58 ± 0.01 mA for a period of 17 h using R-AS, and 33 h using A-AS. Thereafter, the current decreased gradually with the substrate depletion. The steady-state of the current lasted longer for A-AS, demonstrating that more substrate was available for electricity generation. The maximum power density was 226 mW m−2 for MFCs using R-AS at a current density of 0.6 A m−2, and 311 mW m−2 for MFCs using A-AS at a current density of 0.86 A m−2. The corresponding OCV was 709 mV (R-AS) and 763 mV (A-AS) (Fig. 2). The maximum power density increased with the increasing SCOD because alkaline pretreatment can increased SCOD nearly 3-fold, from 541 mg L−1 in R-AS to 2140 mg L−1 in A-AS (Table 1). Another reason for this enhancement of the maximum power density after alkaline pretreatment was the difference in substrate properties, such as biodegradability, the form of substrate (particulate or soluble), and the molecular structure of the substrates.20 The cyclic voltammogram revealed an obvious anodic current profile characteristic of catalytic activity (Fig. S1, supplementary data†). This proves that bioelectrochemical active biofilms were formed on the anodes using R-AS and A-AS as substrates.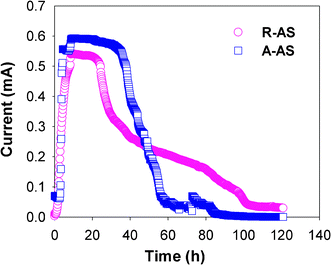 | ||
| Fig. 1 Current generation of MFCs using raw algae sludge (R-AS) and alkaline-pretreated algae sludge (A-AS) over a 1 kΩ external resistance. | ||
 | ||
| Fig. 2 Power density (mW m−2 projected cathode surface area) and voltage as a function of current density (A m−2 projected cathode surface area) in MFCs fed with raw algal sludge (R-AS) and alkaline-pretreated algae sludge (A-AS) | ||
MFCs have the economic benefit of energy recovery from organic matter removal. In comparison, traditional aerobic treatment requires energy input for aeration (1 kWh kg−1 COD in activated sludge processes).17 Although anaerobic digestion could recover energy from methane produced during the treatment process, methane needs to be purified and stored before being further converted into another available energy source (e.g., electrical and thermal energy) with low conversion efficiencies (∼30%).9 MFCs can directly transfer organic materials into electrical energy. In our study, electrical energy of 0.14 kWh kg−1 COD and 0.24 kWh kg−1 COD was recovered for MFCs that were fed R-AS and A-AS, respectively. The values of the energy are US$ 0.013 kg−1 COD (R-AS) and US$ 0.022 kg−1 COD (A-AS), according to an average industrial electricity price in China (US$ 0.092 kWh−1). The recovered electrical energy from AS can partly offset the operating costs associated with the treatment process. The chemical cost produced from alkaline pretreatment was approximately US$ 0.0067 kg−1 COD based on using lime (US $0.05 kg−1 Ca(OH)2), a low-cost chemical with practical application. The extra electricity recovered from A-AS compared to R-AS can fully offset the chemical cost.
3.2. TCOD removal
After an operating period of 120 h, TCOD removal of 57 ± 4% for A-AS was significantly higher than that of R-AS at 33 ± 5% (Fig. 3). TCOD removal in MFCs using A-AS was increased rapidly in the first 40 h because sufficient soluble organic matter from alkaline hydrolysis could be indirectly used by electrochemically active bacteria. After the initial SCOD was depleted, TCOD removal was associated with the degradation of particulate organic matter. Particulate materials were preferentially hydrolyzed into soluble substrates by fermentation bacteria, and then the hydrolysates were further utilized by electrochemically active bacteria. Hydrolysis was a rate-limiting step during this degradation process, resulting in a slower increase of TCOD removal during the period of 40–120 h. When MFCs were fed with R-AS, TCOD removal slowly increased with time. Because there was little SCOD in R-AS that could be directly used to generate electricity, SCOD was constantly produced from the hydrolysis of particulate materials during the whole batch cycle. An open circuit operation of the MFC (control test) was performed to study the role of other bacteria, other than the electrochemically active bacteria on the degradation of AS. The TCOD removal efficiencies under the control conditions were only 6 ± 2% (R-AS) and 20 ± 3% (A-AS). These results demonstrate that electrochemically active bacteria play a more important role in the removal of TCOD, although AS can be partly oxidized by other bacteria.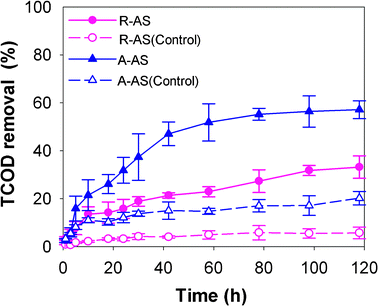 | ||
| Fig. 3 TCOD removal in MFCs using raw algae sludge (R-AS) and alkaline-pretreated algae sludge (A-AS) during the degradation process. Control refers to MFCs under open circuit conditions. | ||
3.3. Degradation of soluble organic matter
AS collected from the DWTP in June consisted of protein (65%), carbohydrate (18%), lipid (1%), and other organic matter. There were very few initial soluble organic materials in the R-AS; thus, MFC could effectively remove them, and achieve removal efficiencies of 66 ± 3%, 51 ± 4% and 73 ± 2% for SCOD, soluble protein and carbohydrate, respectively (Fig. 4). Removal of protein was less than that of carbohydrate when using R-AS, suggesting that carbohydrate was aptly used by the microorganisms compared to protein, which has a more complex molecular structure. The compositions of raw AS are strongly influenced by seasons because dominant algal species vary with the season. Different algal species display a disparity in the proportions of proteins, carbohydrates and lipids.21 The contents of protein and carbohydrate in AS reach a peak in summer and winter, respectively,22 indicating that the removal of organic matter in AS may vary with seasons due to the changes in compositions.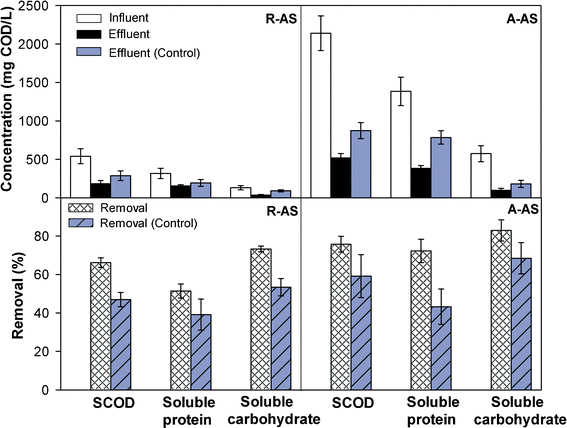 | ||
| Fig. 4 The concentrations and removal efficiencies of SCOD, soluble protein, and soluble carbohydrate in MFCs using raw algae sludge (R-AS) and alkaline-pretreated algae sludge (A-AS). Control refers to MFCs under open circuit conditions. | ||
It was observed that these soluble organic materials increased remarkably after alkaline pretreatment and that the concentrations of SCOD, soluble protein and carbohydrate all increased by more than three-fold (Fig. 4). Additionally, the removal of SCOD and soluble carbohydrate from A-AS increased by approximately 10% compared to that of R-AS in both MFC and control tests, while soluble protein removal increased more than 20% and there was no appreciable change in the control tests. This indicated that alkaline pretreatment improved the degradation of protein in MFC. It is worth noting that SCOD removal, under control operating conditions using both types of AS, was equivalent to 71–78% of SCOD removal in MFC, while these percentages of TCOD removal in the control were much lower (18 ± 3% for R-AS, and 35 ± 7% for A-AS). These results suggest that SCOD removal was much higher than TCOD removal in the control tests due to abundant soluble organic matter, which was also susceptible to biodegradation even without the role of electrochemically active bacteria. Thus, releasing as much soluble organic matter as possible through alkaline pretreatment was the key factor for the enhancement of MFC performance and TCOD removal.
The yields and compositions of VFAs were compared between R-AS and A-AS during a degradation period of 5 days (Fig. 5). Initially, there were few total VFAs in R-AS (1 mg L−1). The total VFAs increased significantly in the first two days and then decreased as the degradation time continued. Acetic acid and propionic acid were the most prevalent VFAs that were present in AS. The production of VFA in R-AS and A-AS increased to 60 mg L−1 and 17 mg L−1, respectively, after the 1st day due to the hydrolysis of protein and carbohydrate. In other studies on activated sludge in anaerobic digestion, acetate has been found to be the major fermentation product of protein, and propionic acid is the main product during glucose acidification at neutral pH.13,23 Acetic acid gradually decreased on the 2nd and 3rd days of degradation, implying that the degradation rate of acetic acid was faster than the hydrolysis rate for acetic acid production. Acetic acid was preferentially utilized by microbes over propionic acid due to the simpler molecular structure of acetic acid, and it was almost exhausted on the 5th day in both MFC and control reactors, while approximately 25% of propionic acid remained at the end of the experiment. In control tests, additional acetic acid was left at the end of the cycle.
 | ||
| Fig. 5 Comparison of VFA concentrations in MFCs using raw algae sludge (R-AS) and alkaline-pretreated algae sludge (A-AS). Arrow direction indicates different y-axis for R-AS and A-AS. | ||
In the initial A-AS, the yield of the total VFAs was 428 mg L−1. Acetic acid comprised the largest percentage (73%) of the total VFAs, followed by propionic acid (14%), and then butyric acid (8%), and valeric acid (5%). MFC efficiently removed acetic acid (from 311 to 32 mg COD L−1) and propionic acid (from 61 to 5 mg COD L−1), respectively during the 5 day period. However, the removal efficiencies for acetic and propionic acids were less in control tests. Butyric acid was much more difficult to consumed in the MFCs compared to acetic acid and propionic acid, which was consistent with other studies that demonstrated that butyrate was not a favorable substrate for electrochemically active bacteria.24
3.4. Community analysis
The 16S rRNA gene clone library was applied to analyze the microbial community structure in MFC system-fed A-AS. A total of 201 clones were obtained and grouped into 50 operational taxonomy units (OTUs). The coverage of the clone library was 86.1% (Fig. S2, supplementary data†). We compared the library with the estimated phylotype richness using the abundance-based richness estimators Chao1 and ACE.25 The rarefaction curve for the 16S rRNA gene clone library did not plateau, suggesting that the total diversity was under sampled in the clone library. Phylogenetic analysis showed the bacterial communities on the MFC anode biofilm, that were affiliated mainly with Proteobacteria (44.3%, including 16.4% β-Proteobacteria, 12.4% δ-Proteobacteria, 8% γ-Proteobacteria and 7% ε-Proteobacteria and 0.5% α-Proteobacteria), Bacteroidetes (23.9%), and Firmicutes (10.9%) accompanied by a relatively small amount of Chloroflexi (1.0%), Acidobacteria (0.5%), and others (19.4%) (Fig. 6). | ||
| Fig. 6 Phylogenetic tree based on the comparative analysis of 16S rRNA gene sequences obtained from the anode biofilm of MFCs using alkaline-pretreated algae sludge (A-AS) and their closest relatives (an identified species has the closest sequence with the MFC clone) in the GenBank. The sequence accession numbers in the GenBank database are in parentheses. | ||
The compositions of the bacterial communities in terms of the major genus are presented in Fig. 7. These communities consisted of bacteria related to Geobacter, Pseudomonas, and Comamonas, which have the capability of electricity generation in MFCs as previously reported.26 The Geobacter was closely related to the subsurface isolates G. chapellei (11%) and G. psychrophilus (0.5%), which were found to be the major communities with acetate-fed microbial electrolysis cells (MECs) at normal temperature and low temperature, respectively. The power density of G. sulfurreducens (1%) was the highest among all pure cultures that have been reported.27 These multiple Geobacter sp. are proven to have the capability of directly transferring electrons to electrodes without a mediator.28 They are capable of completely oxidizing acetate, short-chain fatty acids and monoaromatic compounds such as benzoate, phenol, p-cresol, and toluene to carbon dioxide with Fe(III) as the electron acceptor,29 but they do not have the ability to utilize complex substrates, such as cellulose.30 Although other studies have reported that pure cultures of Pseudomonas putida and Comamonas testosteroni were able to utilize artificial wastewater to produce power,31 most electrochemically active bacteria work in conjunction with fermentation bacteria, and would prefer to use fermentation products to generate electricity. Fermentation bacteria, such as Petrimonas sulfuriphila (1.5%), which was proven to be involved in protein degradation in MECs using waste activated sludge,32 and Acetoanaerobium sp. (6.5%) from Firmicutes33 might play a role in converting complex organic matter from AS into simple molecules. Arcobacter sp. (7%), Dysgonomonas sp. (2.5%), and Fusibacter sp. (1%) have also been detected in other MFC studies,34–36 but their specific roles in the biofilm ecology are unknown.
 | ||
| Fig. 7 Relative abundance of sequences from the 16S rRNA gene clone library of A-AS fed MFCs. The sequence frequency is grouped according to genus. | ||
4. Conclusions
MFC technology could not only effectively degrade algae sludge (AS) from a drinking water treatment plant, but it could also transform the waste to electrical energy, which was recovered to partly offset the operation cost. The use of alkaline pretreated algae sludge (A-AS) generated more power density and electrical energy recovery compared to the raw algae sludge (R-AS), and the extra electricity recovered from A-AS can fully offset the chemical cost associated with the alkaline pretreatment. The removal of soluble organic matter (e.g., protein, carbohydrate and VFAs) was high for MFCs using both types of AS, but TCOD was degraded more efficiently in A-AS fed MFCs. Thus, alkaline pretreatment was the key factor in the enhancement of AS solubilization and biodegradation. Analysis of microbial community structure in anode biofilms from MFCs using the 16S rRNA gene clone library further proved that the AS was mainly degraded through syntrophic interactions between fermentation bacteria and electrochemically active bacteria.Acknowledgements
The authors would like to thank the National Natural Science Fund of China (Nos. 50808052 and 50778048), and the National Creative Research Groups (No. 51121062) for their support for this study.References
- W. Liu and R. Qiu, J. Chem. Technol. Biotechnol., 2007, 82, 781–786 CrossRef CAS.
- W. J. Yang, C. G. Chen and H. Y. Liu, Water & Wastewater Engineering (in Chinese), 2008, 34, 19–21 Search PubMed.
- B. Y. Sohn, T. J. Park, B. S. Oh, S. B. Kwon and J. W. Kang, Sep. Sci. Technol., 2008, 43, 3873–3890 CrossRef CAS.
- S. Zhang, Z. Guo, Y. Liu and X. Zhang, Water Purification Technology, 2008, 27, 33–36 CAS.
- D. B. Aulenbach, N. K. Shammas, L. K. Wang, and R. C. Marvin, in Flotation Technology, ed. L. K. Wang, N. K. Shammas, W. A. Selke and D. B. Aulenbach, Humana Press, 2010, vol. 12, pp. 363–399 Search PubMed.
- P. E. Wiley, J. E. Campbell and B. McKuin, Water Environ. Res., 2011, 83, 326–338 CrossRef CAS.
- D. Pant, G. Van Bogaert, L. Diels and K. Vanbroekhoven, Bioresour. Technol., 2010, 101, 1533–1543 CrossRef CAS.
- B. E. Logan, B. Hamelers, R. A. Rozendal, U. Schrorder, J. Keller, S. Freguia, P. Aelterman, W. Verstraete and K. Rabaey, Environ. Sci. Technol., 2006, 40, 5181–5192 CrossRef CAS.
- S. B. Velasquez-Orta, T. P. Curtis and B. E. Logan, Biotechnol. Bioeng., 2009, 103, 1068–1076 CrossRef CAS.
- H. Carrere, C. Dumas, A. Battimelli, D. J. Batstone, J. P. Delgenes, J. P. Steyer and I. Ferrer, J. Hazard. Mater., 2010, 183, 1–15 CrossRef CAS.
- H. Li, Y. Y. Jin, R. Mahar, Z. Y. Wang and Y. F. Nie, Bioresour. Technol., 2008, 99, 5140–5144 CrossRef CAS.
- L. S. Clesceri, A. E. Greenberg and A. D. Eaton, Standard methods for the examination of water and wastewater, American public health association and water environment federation, American public health association (APHA), Washington DC, USA, 20th edn, 1998 Search PubMed.
- Y. G. Chen, S. Jiang, H. Y. Yuan, Q. Zhou and G. W. Gu, Water Res., 2007, 41, 683–689 CrossRef CAS.
- B. Logan, S. Cheng, V. Watson and G. Estadt, Environ. Sci. Technol., 2007, 41, 3341–3346 CrossRef CAS.
- M. DuBois, K. A. Gilles, J. K. Hamilton, P. A. Rebers and F. Smith, Anal. Chem., 1956, 28, 350–356 CrossRef CAS.
- C. P. L. Grady, G. T. Daigger, and H. C. Lim, Biological waste water treatment, Marcel Dekker Inc., New York, 1999 Search PubMed.
- R. D. Cusick, P. D. Kiely and B. E. Logan, Int. J. Hydrogen Energy, 2010, 35, 8855–8861 CrossRef CAS.
- J. Gerritse, O. Drzyzga, G. Kloetstra, M. Keijmel, L. P. Wiersum, R. Hutson, M. D. Collins and J. C. Gottschal, Appl Environ. Microbiol., 1999, 65, 5212–5221 CAS.
- D. Xing, N. Ren and B. E. Rittmann, Appl. Environ. Microbiol., 2008, 74, 1232–1239 CrossRef CAS.
- B. Min, J. R. Kim, S. E. Oh, J. M. Regan and B. E. Logan, Water Res., 2005, 39, 4961–4968 CrossRef CAS.
- H. C. Hong, A. Mazumder, M. H. Wong and Y. Liang, Water Res., 2008, 42, 4941–4948 CrossRef CAS.
- N. K. Sharma, D. Mohan and A. K. Rai, Water, Air, Soil Pollut., 2009, 202, 325–333 CrossRef CAS.
- L. Y. Feng, Y. G. Chen and X. Zheng, Environ. Sci. Technol., 2009, 43, 4373–4380 CrossRef CAS.
- S. Freguia, E. H. Teh, N. Boon, K. M. Leung, J. Keller and K. Rabaey, Bioresour. Technol., 2010, 101, 1233–1238 CrossRef CAS.
- P. F. Kemp and J. Y. Aller, Limnol. Oceanogr.: Methods, 2004, 2, 114–125 CrossRef.
- D. R. Bond and D. R. Lovley, Appl. Environ. Microbiol., 2003, 69, 1548–1555 CrossRef CAS.
- J. Higgins, J. Warnken, P. P. Sherman and P. R. Teasdale, Water Res., 2002, 36, 5045–5056 CrossRef CAS.
- G. Reguera, K. P. Nevin, J. S. Nicoll, S. F. Covalla, T. L. Woodard and D. R. Lovley, Appl. Environ. Microbiol., 2006, 72, 7345–7348 CrossRef CAS.
- M. V. Coppi, C. Leang, S. J. Sandler and D. R. Lovley, Appl. Environ. Microbiol., 2001, 67, 3180–3187 CrossRef CAS.
- Z. Ren, T. E. Ward and J. M. Regan, Environ. Sci. Technol., 2007, 41, 4781–4786 CrossRef CAS.
- D. F. Juang, P. C. Yang, H. Y. Chou and L. J. Chiu, Biotechnol. Lett., 2011, 33, 2147–2160 CrossRef CAS.
- L. Lu, D. Xing and N. Ren, Water Res., 2012, 46, 2425–2434 CrossRef CAS.
- G. Liu, M. D. Yates, S. Cheng, D. F. Call, D. Sun and B. E. Logan, Bioresour. Technol., 2011, 102, 7301–7306 CrossRef CAS.
- Z. Y. Ren, H. J. Yan, W. Wang, M. M. Mench and J. M. Regan, Environ. Sci. Technol., 2011, 45, 2435–2441 CrossRef CAS.
- K. M. Chung and S. Okahe, Biotechnol. Bioeng., 2009, 104, 901–910 CrossRef CAS.
- P. T. Ha, B. Tae and I. S. Chang, Energy Fuels, 2008, 22, 164–168 CrossRef CAS.
Footnote |
| † Electronic Supplementary Information (ESI) available. See DOI: 10.1039/c2ra20631e/ |
| This journal is © The Royal Society of Chemistry 2012 |