Alcohol to water catalyzed by Pt nanoparticles: an experimental and computational approach
F.
Dehouche
a,
P.
Archirel
*ab,
H.
Remita
ab,
N.
Brodie-Linder
cd and
A.
Traverse
ab
aLaboratoire de Chimie Physique, UMR 8000-CNRS, Université Paris-Sud 11, 91405, Orsay, France. E-mail: pierre.archirel@u-psud.fr
bCNRS, UMR 8000, Laboratoire de Chimie Physique, 91405, Orsay, France
cLaboratoire Léon Brillouin, CEA Saclay, Bâtiment 563, 91191, Gif-sur-Yvette, France
dDépartement de Chimie, SOSCO, Université de Cergy-Pontoise, 95031, Cergy Pontoise, France
First published on 15th May 2012
Abstract
This paper reports alcohol decomposition on Pt nanoparticles. The catalytic degradation of 2-propanol into ethanol, methanol and finally water: 2-propanol → ethanol → methanol → water is observed during the photoreduction process of PtII leading to Pt nanoparticles. Formation of the intermediate products has been followed by UV-visible and IR spectroscopy. Quantum chemical results on the Pt13 particle show that alcohol degradation is possible, and that the mechanism involves the deposition of H, C and CH fragments on the particle’s surface.
1. Introduction
Platinum plays a crucial role in catalysis1–3 and is involved in many industrial applications, including fine chemical synthesis,4–6 hydrogenation and dehydrogenation reactions,7 CO oxidation in catalytic convertors,8 and gas sensing.9 Platinum-based nanoparticles are also very promising electrocatalysts for fuel cell applications.10 In particular, platinum-based nanoparticles are very active in hydrogen production11,12 and the electro-oxidation of alcohols.13There is a lot of literature dealing with the adsorption and transformations of ethanol on platinum. Two experimental circumstances make a synthetic view of the measurements very difficult: the state of the metal and the nature of the environment. The metal can be a solid displaying a well defined surface with low indexes like Pt(111),14–18 a well defined surface with higher indexes like Pt(332), made up of (111) terraces and (110) steps13,16,17 or polycrystalline surfaces.19–21 Assemblies of nanoparticles of various sizes, displaying several different faces and defaults, deposited on various supports like alumina,22 gold23 or platinum itself24 are other objects of study. Platinum also can be doped with various amounts of other metals like ruthenium.13,25 These platinum-based objects can interact with alcohol molecules in various environments such as in vacuum14 or aqueous solutions with variable pH values.16,20,23 Note that many of these studies were based on electrochemical experiments made at different potentials. It is striking that these works largely discuss ethanol oxidation only. A very small number of works mention ethanol reduction by platinum surfaces.26 A few publications deal with the oxidation of methanol15,24 and 2-propanol.15,21 The studies on ethanol electro-oxidation show that the ethanol molecule can adsorb onto the platinum surface by its oxygen and/or carbon atoms14,15,25 and dissociate forming an ethoxy species CH3CH2OPt.15,25 Some studies show that oxidation can occur and yield acetaldehyde, acetone, acetic acid, CO and CO2.13,14,15,18 These studies emphasize that the density of steps on the surface is a key factor for oxidation enhancement. Other studies show that oxidation occurs for light organic acids, aldehydes and ketones, but not for alcohols.19 In this last case the authors argue that the alcohol oxidation probably indeed occurs but at a very low rate. Since their polycrystalline surface is very likely to be largely a (111) surface with very few defects, which is the most stable for fcc metals, we think that their argument is reasonable.
Platinum surfaces and particles also have been extensively investigated by DFT methods: the structure of platinum particles in vacuum,27,28 the reactivity of platinum surfaces towards aldehydes and ketones,29 towards CCl430 and towards ethanol.29,31 To the best of our knowledge, platinum particles in solution have not been investigated yet by DFT calculations.
To contribute to the understanding of this complex research area, it is interesting to study in more detail, experimentally and computationally, the alcohol interaction with Pt nanoparticles. Here, we describe an original process: the alcohol which decomposes is the solvent itself, in which the platinum particles are synthesized, and we show that the reaction successively leads to lighter alcohols and finally to water. Alcohol decomposition is followed and quantified by IR spectroscopy. Since the synthesis of the platinum particles is induced by UV irradiation, we have first used a UV lamp and then, having in mind practical applications, daylight. The alcohol decomposition takes place via the successive loss of CH2 fragments. In order to shed light on the mechanism of the alcohol degradation, we shall present DFT results showing the strong interaction of the CH2 fragment with a model platinum particle: Pt13.
In section 2, we give experimental details. In section 3, we detail our syntheses of the platinum particles using a UV lamp and daylight. We then summarize, in section 4, the results of quantum calculations on the Pt13 and Pt13CH2 particles. In section 5, we discuss the experimental and computational results.
2. Experimental section
The Pt(acac)2 (purity ≥ 98%) complex from Strem Chemicals was dissolved in the pure alcohols (purity ≥ 99.5%) (methanol, ethanol, 2-propanol) purchased from Sigma Aldrich, the metal concentration being 10−3 mol dm−3. For photoreduction, Pt(acac)2 solutions were irradiated in quartz cells under N2. The irradiations were performed using a 300 W Xe arc lamp (from Oriel) equipped with a water cell filter to absorb near-IR radiation. According to the supplier the irradiance of the lamp from 320 to 790 nm was around 50 mW m−2 nm−1. UV-Visible absorption spectra were recorded with a double beam Perkin Elmer Lambda 19 spectrophotometer. Infrared spectroscopy was carried out in the attenuated total reflectance (ATR) mode on a Bruker Vertex 70 spectrometer in the 500–4500 cm−1 range. Transmission electron microscopy (TEM) observations were performed with a JEOL 100CXII transmission electron microscope at an accelerating voltage of 100 kV. Drops of the irradiated solutions were deposited on carbon-coated copper grids and dried under a N2 flow.3. Measurements
3.1 Synthesis of platinum nanoparticles
The precursors PtII(acac)2 and PdII(acac)2 have been widely used in the synthesis of metal particles by photoreduction.32,33 An alcohol (2-propanol, ethanol or methanol) solution containing PtII(acac)2 (10−3 M) was exposed to UV light. The initially transparent solutions became brown after an irradiation time of 30 min. The initial solution exhibited absorption maxima at 223, 250, 286 and 345 nm, which are the signatures of the Pt complex as shown in Fig. 1. The UV-visible absorption spectrum of the solution after UV irradiation is also shown in Fig. 1. The decrease of the Pt(acac)2 absorption was accompanied by the appearance of the typical absorption band of acacH (at 272 nm) in addition to a structureless absorption due to the platinum nanoparticles with a maximum in the UV range (the surface plasmon spectra of spherical platinum nanoparticles are known to exhibit a resonance band in the UV range at around 210 nm)34 extending up to the visible region. After light exposure, homogeneously distributed Pt nanoparticles (NPs) of 1.3 ± 0.3 nm (about 55 atoms) stabilized by the acac ligands are obtained as shown on the TEM picture (Fig. 2). The UV-visible spectra of Fig. 1 have also been obtained with a solution irradiated by daylight.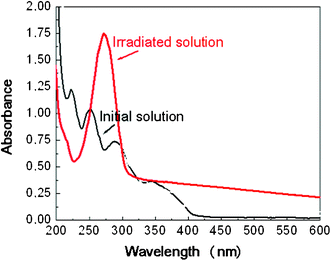 | ||
| Fig. 1 UV-Visible spectra of a 10−3 M solution of Pt(acac)2 in 2-propanol, before and after UV irradiation. Optical length: 2 mm. | ||
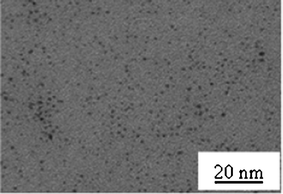 | ||
| Fig. 2 TEM image of Pt nanoparticles synthesized from a 10−3 M solution of Pt(acac)2 in 2-propanol by photochemical reduction. | ||
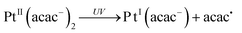
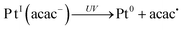
In hydrogen-donating solvents, Pt(acac)2 undergoes efficient photodegradation to yield colloidal platinum and β-diketones.33 Upon excitation of the ligand-to-metal charge-transfer band, homolytic Pt–O bond cleavage occurs and releases the acetylacetonyl radical acac˙35–38 (reactions 1–2). By releasing the acetylacetonyl radicals, the PtII complexes evolve into PtI acac (reaction 1). Radicals abstract hydrogen from the hydrogen-donating solvent to form acetyl acetone (acacH) (reaction 3). The acetylacetonyl PtII complexes can be also reduced into PtI by the alcohol radical (reaction 4) because the redox potential of this radical is very negative: E0 ((CH3)2CO/(CH3)2C˙OH) = − 1.8 VNHE at pH 7.39 The PtI complexes are reduced to Pt0 by the released acetylacetone and probably also by the 2-propanol (reaction 5). Finally the released protons and acac anions can be neutralized (reaction 6). In the present work, the syntheses were carried out in 2-propanol and ethanol.
 | (1) |
 | (2) |
| acac˙ + (CH3)2CH–OH → acacH + (CH3)2C˙OH | (3) |
| PtII(acac−)2 + (CH3)2C˙OH → PtI(acac−) + (CH3)2CO + H+ + acac− | (4) |
| PtI(acac−) + (CH3)2C˙OH → Pt0 + (CH3)2CO + H+ + acac− | (5) |
| acac− + H+ → acacH | (6) |
3.2 Use of a UV lamp: degradation of 2-propanol
During the first 30 min of the irradiation, the main modifications of the IR spectra occur in the 700–2000 cm−1 range, this zone is thus presented in the following figures. The IR spectra recorded after different irradiation stages, t1 and t2, display new peaks at 880, 1050, 1020 and 1248 cm−1 (Fig. 3). t1 is of the order of 10–15 min, whereas t2 is of the order of 20–25 min.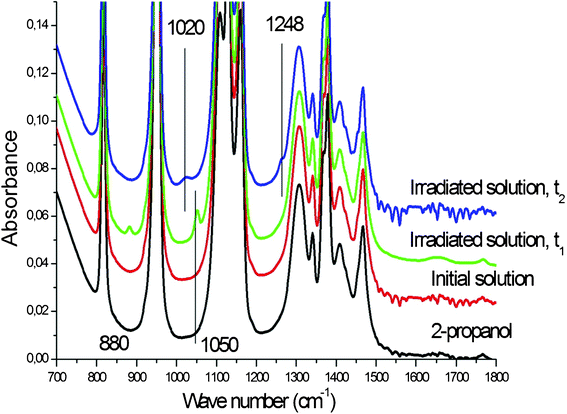 | ||
| Fig. 3 IR spectra of pure 2-propanol, of the initial 10−3 M solution of Pt(acac)2 in 2-propanol and of this solution after irradiation times t1 = 10–15 min and t2 = 20–25 min. | ||
The spectra of Fig. 3 can be easily interpreted with the help of Fig. 4 where we give the IR spectra of the pure alcohols (Fig. 4a) and of the 1/10![[thin space (1/6-em)]](https://www.rsc.org/images/entities/char_2009.gif) 000 solution of acacH in 2-propanol (Fig. 4b). It can be seen that ethanol has three contributions at 880, 1050 and 1090 cm−1 and that methanol has only one contribution at 1020 cm−1. The acacH solution exhibits a small contribution at 1248 cm−1. The Fig. 4a and 4b enable an interpretation of the spectra of Fig. 3:
000 solution of acacH in 2-propanol (Fig. 4b). It can be seen that ethanol has three contributions at 880, 1050 and 1090 cm−1 and that methanol has only one contribution at 1020 cm−1. The acacH solution exhibits a small contribution at 1248 cm−1. The Fig. 4a and 4b enable an interpretation of the spectra of Fig. 3:
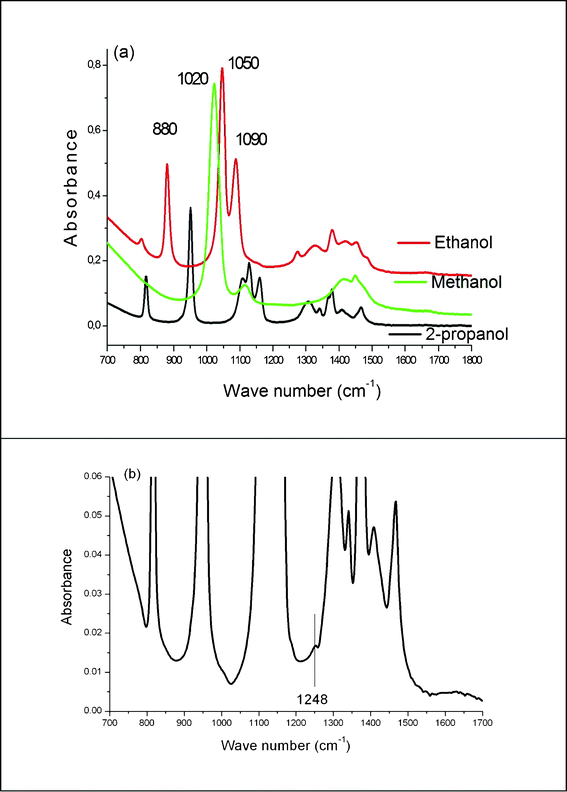 | ||
| Fig. 4 IR spectra of (a) pure alcohols and (b) the 1/10000 solution of acacH in 2-propanol. | ||
• The two first bands of ethanol are clearly seen after t1 whereas the one at 1090 cm−1 is hidden below the 2-propanol contribution at 1120 cm−1.
• The band of methanol is seen at t2.
• The faint contribution seen at 1248 cm−1 for t1 and t2 can be attributed to acacH. This identification is supported by reactions 3 and 6 written above and by Fig. 1 showing the band at 272 nm, typical of acacH.
To evaluate the ratio ethanol/2-propanol, we have fitted the peaks located at 880 and 1050 cm−1 belonging to ethanol and those located at 820 and 950 cm−1 belonging to 2-propanol with Gaussian functions to deduce the peak area A(ωi), where i stands for ethanol or 2-propanol. A calibration of the peak area ratio, A(ωethanol)/A(ω2-propanol) has been done with the help of ethanol–2-propanol mixtures with known concentrations. With this calibration, we have found that after the syntheses the ethanol/2-propanol ratio amounts to 1 to 2% depending on the irradiation time. Using a molar ratio of Pt over 2-propanol equal to 1/1000, leads to a molar ratio of ethanol/Pt = 10. Assuming that the reaction takes place at the Pt NP’s surface where there is only 50% Pt atoms, the ratio becomes 20. The 2-propanol decomposition is thus catalytically activated.
From these observations two questions arise:
1- Since most experiments of ethanol decomposition on platinum produce adsorbed CO, as stated in our introduction, we must investigate whether or not carbonyls are also produced in the present experiments.
2- The degradation of 2-propanol into ethanol and methanol, observed in the previous section, can be summarized by the successive loss of two CH2 fragments. The question naturally arises of a third loss yielding water.
As stated in the introduction, we will now use daylight. We have noticed, actually, that daylight induces the synthesis of platinum nanoparticles as well as the UV lamp, and that:
• It approaches practical applications
• It enables the monitoring of the kinetics of water formation via its IR signal at 1650 cm−1, as shown in the next section.
3.3 Use of daylight: degradation of 2-propanol and ethanol
We have performed a synthesis of platinum particles in 2-propanol in glass tubes under daylight. The synthesis was proved by UV-visible spectra identical to that of Fig. 1. In Fig. 5a the IR spectra of the solution, before and after several weeks of irradiation are presented. Three features can be seen in the spectrum after irradiation: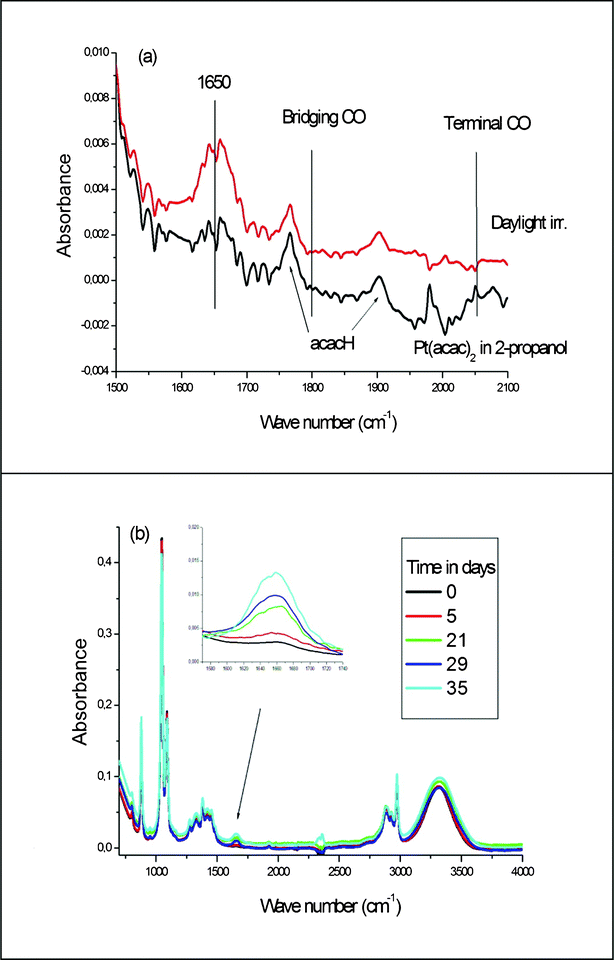 | ||
| Fig. 5 Evolution of the IR spectra of the Pt(acac)2 solutions after daylight irradiation: (a) solution in 2-propanol (b) solution in ethanol. In the insert: water vibration at 1650 cm−1 after several irradiation times. | ||
1- A band at 1650 cm−1, the signature for the bending of the water molecule, is clearly visible. This proves that the third loss of CH2 actually occurs.
2- No carbonyl signal is visible. This can be checked by inspection of the spectrum, in the 1800 to 2050 cm−1 region, where the bridging and terminal carbonyls are likely to appear (as shown in Fig. 5a). This absence of CO suggests that no alcohol oxidation occurs in our experiment.
3- Signals for acacH are clearly visible. Note that this species is rarely observed at such low concentrations (2 × 10⁻³ M), this allows us to emphasize the absence of CO.
We then performed the synthesis in ethanol. A solution of Pt(acac)2 in ethanol was exposed to day light for a number of days and the evolution of the reaction was followed by IR spectroscopy. The slow formation of water is clearly observed in the 1650 and 3800 cm−1 regions corresponding to the bending and stretching of H2O molecules (see Fig. 5b). The increase in the intensity of the 3000–3500 cm−1 region corresponding to O–H stretching is also an indication of the same phenomenon although both H2O and 2-propanol molecules contribute to the peak intensity in this region.
4. Quantum chemical calculations
In this section we extract results from recent calculations which will be submitted for publication in the near future.40 We have used the DFT (density functional theory) method with the PBE functional41 and the SDD basis set42 supplemented with polarization Gaussians (one d with exponent .8 on C and O atoms, one p with exponent 1.1 on H atoms). These functional and basis sets have been checked to describe platinum particles with a good accuracy.43 The solvent has been modeled with the help of the SMD method.44 All the calculations have been done with the Gaussian 09 program.45 For all the reactions of the form:| A + B → C + D | (7) |
| ΔrG0sol = ΔrEelsmd = Eelsmd(C) + Eelsmd(D) − Eelsmd(A) − Eelsmd(B) | (8) |
The reactions which have been observed in section 3 show that the 2-propanol solvent successively degrades into ethanol, methanol and finally water. It is very striking that at each step of this sequence of reactions a CH2 fragment is lost. This suggests that the solvent, and then the other alcohols, leave a CH2 fragment on a platinum particle. Another possibility is that one H2 molecule is released. This yields four reaction channels:
| Ptn + (CH3)2CHOH → PtnC + CH3CH2OH + H2 | (9) |
| Ptn + (CH3)2CHOH → PtnCH2 + CH3CH2OH | (10) |
| Ptn + (CH3)2CHOH → PtnHCH + CH3CH2OH | (11) |
| Ptn + (CH3)2CHOH → PtnHHC + CH3CH2OH | (12) |
4.1 Structure of platinum particles in 2-propanol
Since DFT calculations may be very time consuming, we have considered the Pt13 particle for which the calculations are feasible with reasonable computer times. It has been shown that the most stable structure of the Pt13 particle in a vacuum has the shape of a 4441 “bottle” of Cs symmetry, with three layers of 4 metal atoms, capped with a single metal atom.19 We have investigated the structure of Pt13 in 2-propanol. To this purpose, we have used a large number of trial structures.40 We have found that three stable structures lie within 0.30 eV: two of them can be written Pt12Pt1 (with relative energies 0 and +0.1 eV), the third one is a very regular 631 pyramid with a Pt3 triangle adsorbed, see Fig. 6 (1) (with relative energy +0.3 eV).40 Therefore, this last structure can be noted as Pt10Pt3. We have found that for this structure the most stable spin state is the same as that in the vacuum, with S = 3.40 In the following we shall focus on the Pt10Pt3 structure, because it displays a complex reactivity behavior, with reactions occurring on the Pt10 particle, on the Pt3 unit, or on the zone between them. This focus is possible because, as we shall see, the CH2 adsorption leaves the Pt10Pt3 structure of the particle unaffected.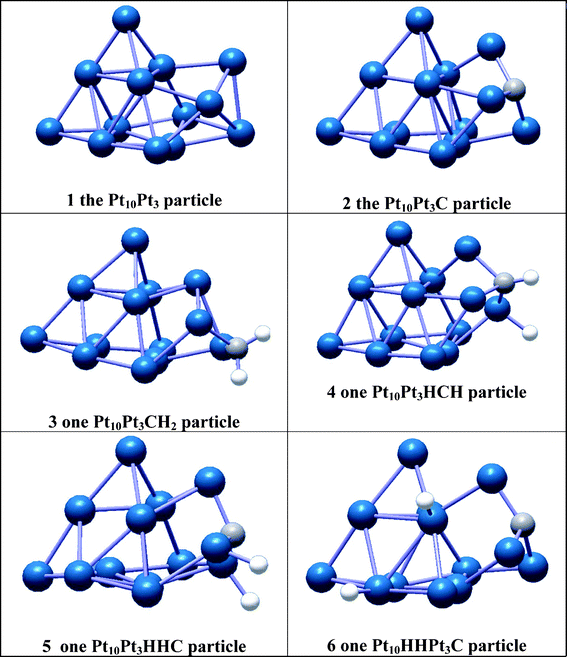 | ||
| Fig. 6 Structures of a few stable particles. Pt atoms are blue, C atoms are grey, H atoms are white. | ||
We then investigated the adsorption of one carbon atom on the Pt10Pt3 particle. We have found that the most stable particle can be written as Pt10Pt3C, with the carbon atom adsorbed on the Pt3 subunit, see Fig. 6 (2). It can be seen that the carbon atom adsorbs on the centre of the Pt3 triangle, thus adopting an sp3 hybridisation. Another structure is very stable, with the carbon atom adsorbed on the centre of the Pt6 faces of the Pt10 pyramid. We have found that in every case the spin value S = 2 ensures the maximum stability of the Pt13C particle.
We have found that the CH2 fragment binds to the particle in only one way, making a bridge between two platinum atoms. This binding is favorable, because it provides the carbon atom with sp3 hybridisation. We have found that the CH2 fragment favorably adsorbs on the ridge of both the Pt10 and the Pt3 units (Fig. 6 (3)). We also have found that the adsorption on the Pt6 plane, like on a (111) surface, is very unfavorable.
We then provided all the Pt10Pt3C and Pt10CPt3 particles with two H atoms. First we provided the adsorbed C atom with a CH bond and adsorbed the second H atom on the surface, in terminal and in bridging positions. In this way, we obtained a large number of structures, the most stable one is shown on Fig. 6 (4). We also adsorbed the two H atoms on the platinum atoms of the particle, thus leaving the adsorbed C atom frustrated. Again, terminal and bridging positions have been tested and found favorable. Two stable Pt13HHC structures are shown in Fig. 6 (5) and 6 (6). Again we have found that the spin value S = 2 yields the most stable particles.
4.2 Degradation of 2-propanol on platinum particles
We first note that since the 2-propanol reactant is also the solvent, the standard free energies of reactions 10–12 are given by eqn 8 and a corrective term:| ΔrG0sol = ΔrEelsmd − RTln(13.07) | (13) |
| A + B → C + D + H2 | (14) |
| ΔrG0sol = ΔrGsmd − RTln(13.07) | (15) |
| ΔrGsmd(C) = Gsmd(C) + Gsmd(D) + Ggas(H2) − Gsmd(A) − Gsmd(B) | (16) |
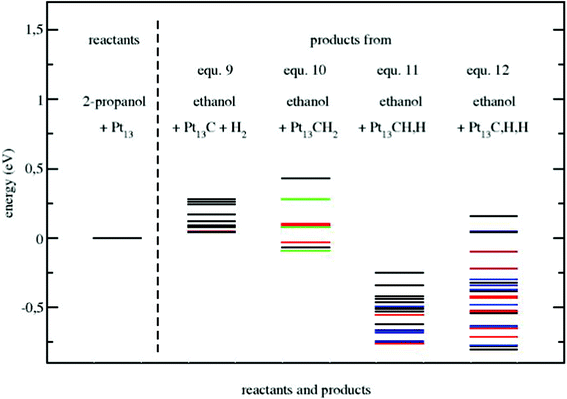 | ||
| Fig. 7 The free energy differences of different reaction channels for the degradation of 2-propanol on Pt13 in 2-propanol. Pt13 has the Pt10Pt3 structure. The vertical line separates the reactants (on the left) and the four product channels according to reactions 9–12 (on the right). The zero energy is the energy of the reactants. Some channels are emphasized with color (see text). | ||
In Fig. 7 we have emphasized some channels with different colors:
• The channels with CH2 adsorbed on an edge of a Pt10 particle are in green.
• The channels with all the C and H atoms adsorbed on the Pt3 unit are in red.
• The channels with the C and H atoms adsorbed at the joint between Pt10 and Pt3 are in blue.
It can be seen that these last channels, in red and blue, are very favorable. This feature is important because if we now consider a larger PtnPt3 particle, where the Pt3 unit is adsorbed on a supporting Ptn particle, it can be expected that
• the reactivity of the adsorbed Pt3 unit remains roughly the same when the particle supporting it becomes bigger. The same probably holds for the reactivity of the joint zone.
• the reactivity of the supporting particle (in black and green in Fig. 7) would decrease as it becomes bigger.
Note that there are many channels for the CH, H dissociation of CH2, due to the number of possible sites for the CH and H species, and many more channels for the complete dissociation because in this case three atoms are occupying sites. In other words the configuration entropy is larger for the complete dissociation. This means that the complete dissociation of CH2 is the most plausible channel.
4.3 Successive degradations of alcohols
We now have to consider the successive degradation of ethanol to methanol and of methanol to water. We must consider separately the measurements done in 2-propanol and those done in ethanol:a) All the free energies of reactions 9–12, given in Fig. 7, are shifted, by a quantity which can be easily calculated from the values of the DFT energies of the two alcohol molecules. We have found that all the degradation free energies must be shifted by +0.03 eV for ethanol, and by −0.68 eV for methanol.
b) Since ethanol and methanol are not the solvent but ordinary solutes, eqn 13 is no longer relevant, therefore all the degradation free energies of Fig. 7 must have the RT × ln13.07 = 0.07 eV value added.
Adding these two contributions, we conclude that for the degradation of ethanol into methanol the degradation free energies must have the 0.03 + 0.07 = + 0.1 eV value added and for the degradation of methanol into water these values must have the −0.68 + 0.07 = −0.61 eV value added. The degradation of ethanol is therefore slightly harder than that of 2-propanol, but still possible, from the values of Fig. 7. The degradation of methanol into water is much easier than that of 2-propanol.
a) All the SMD calculations should be in principle done again, with the dielectric constant of 2-propanol (20.18)46 replaced by that of ethanol (25.3)46. We have not done these calculations, owing to the fact that the dielectric constants are close to each other.
b) Since ethanol is now the solvent the correction RT × ln13.07 = 0.066 eV of eqn 13 must be replaced by the correction RT × ln17.13 = 0.073 eV taking into account that liquid ethanol is 17.13 M.46 We will neglect the difference between these two contributions.
As a consequence Fig. 7 can be directly applied to the degradation of ethanol when it is the solvent. Also the degradation free energies for methanol are simply 0.62 eV more negative than that of both 2-propanol and ethanol.
5 Discussion
The DFT results of section 4 enable a simple interpretation of the observations discussed in section 3. According to the DFT results, successive loss of CH2 fragments lead to the degradation chain:| 2-propanol → ethanol → methanol → water |
These results have been obtained with the small Pt13 cluster for which the reaction free energies may be as large as −0.8 eV. Of course it can be argued that larger particles are less reactive than our small Pt13 cluster. It has been shown that stable larger platinum particles are made of (111) facets,47 nevertheless it is plausible that the particles we observe are not fully equilibrated and that (111) Pt islets are adsorbed on the facets. We here emphasize that we have considered a Pt13 particle displaying a complex structure with a Pt3 adsorbed on a compact Pt10 particle, it can therefore be considered a model of a larger particle with a (111) Pt islet adsorbed. We have found that the most negative free energies are obtained with a fragmented CH2, with C and H atoms adsorbed on the Pt3 subunit and in the joint zone between the islet and the particle. We may therefore consider that in our experiments the degradation of alcohols occurs:
• On small and probably also medium sized particles during the synthesis.
• On Pt islets adsorbed on the nanoparticles, or at the joint zone between the islets and the particles when the synthesis is achieved.
The sequence of alcohol degradations can therefore be written:
| Ptn + 2-propanol → PtnCH2 + ethanol | (17) |
| Ptn + ethanol → PtnCH2 + methanol | (18) |
| Ptn + methanol → PtnCH2 + water | (19) |
1. If the UV photon is used for a photoreduction, then the process releases at least 3–4 eV. This energy deposit induces a vigorous mixing of the environment and enables the 2-propanol molecules to approach the platinum particles and replace the departed acacH ligands.
2. When particles are formed the UV photons can excite their plasmon band, which again produces a vigorous heating of their environment. This continuous heating makes the endothermic desorptions of H2 possible.
If H2 is released from the solution, then carbon atoms may migrate and gather into small carbon islets. We have observed no IR signals of the PtC vibrations, probably because they are hidden by the IR absorption of the solvent. Note that in addition to the desorption of H2, the desorption of small hydrocarbons, like methane, is also plausible and can explain why no PtC signal is visible. Carbonaceous deposits on platinum surfaces are well known in the literature.48–51 According to the catalytic process involved, they can act both as poisoning entities on the surface or as anchoring sites for reactants.
6 Conclusion
We have shown for the first time that alcohols can be degraded in a very simple way on platinum particles. Very small platinum particles were synthesized by UV irradiation (UV lamp or daylight) of the PtII(acac)2 precursor in 2-propanol and in ethanol. The degradation of the alcohols was followed and quantified with IR spectroscopy. Ethanol, methanol and water were observed during the syntheses carried out in 2-propanol, and methanol and water were observed during syntheses done in ethanol. No IR signals corresponding to CO fragments were observed.DFT calculations using the PCM modeling of the solvent were performed on the small Pt13 cluster. The results show that the release of a CH2 fragment by 2-propanol is very exoergic. They also show that the reactive entity is a Pt3 subunit, adsorbed on a compact Pt10 particle. This feature suggests that the degradation sequence:
| 2-propanol → ethanol → methanol → water |
The CH2 fragments produced by the degradation of the alcohols are themselves fragmented into C and H atoms on the platinum particle. The heating of the particles, provided by the UV irradiation, provokes the release of H2 and maybe also CH4 and other hydrocarbons. This ensures the cleaning of the platinum surface and the possibility of a catalytic process.
Acknowledgements
We thank Patricia Beaunier, (LRS, UMPC, Paris) for TEM observations. C'Nano Ile de France is also acknowledged for financial support. All the calculations have been done on the computing cluster of the LCP. We thank Jean-Marie Teuler for technical assistance.References
- R. Narayanan and M. A. El-Sayed, J. Phys. Chem. B, 2003, 107, 12416 CrossRef CAS.
- G. A. Somorjai, Proc. Natl. Acad. Sci. U. S. A., 1985, 82, 2207 CrossRef.
- M. El-Sayed, Acc. Chem. Res., 2001, 34, 257 CrossRef CAS.
- H. Bonnemann, W. Brijoux, A. S. Tilling and K. Siepen, Top. Catal., 1997, 4, 217 CrossRef.
- T. Shimada, I. Nakamura and Y. Yamamoto, J. Am. Chem. Soc., 2006, 128, 4048 CrossRef.
- S. Diezi, D. Ferri, A. Vargas, T. Mallat and A. Baiker, J. Am. Chem. Soc., 2006, 128, 4048 CrossRef CAS.
- P. Kacer and L. Cerveny, Appl. Catal., A, 2002, 229, 193–216 CrossRef CAS.
- R. Burch, Catal. Rev. Sci. Eng., 2004, 46, 271–333 CAS.
- A. Kolmakov, D. O. Klenov, Y. Lilach, S. Stemmer and M. Moskovits, Nano Lett., 2005, 5, 667 CrossRef CAS.
- V. Mazumder, Y. Lee and S. Sun, Adv. Funct. Mater., 2010, 20, 1224–1231 CrossRef CAS.
- H. Remita, P. F. Siril, I.-M. Mbomekalle, B. Keita and L. Nadjo, J. Solid State Electrochem., 2006, 10, 506 CrossRef CAS.
- L. Sun, D. V. Ca and J. A. Cox, J. Solid State Electrochem., 2005, 9, 816 CrossRef CAS.
- J. Souza-Garcia, E. Herrero and J. M. Feliu, Chemphyschem, 2010, 111391–1394 Search PubMed.
- B. A. Sexton and A. E. Hughes, Surf. Sci., 1984, 140, 227–248 CrossRef CAS.
- P. Gao, C. Lin, C. Shanon, G. Salaita, J. White, S. Chaffins and A. Hubbard, Langmuir, 1991, 7, 1515–1524 CrossRef CAS.
- J. Shin, W. J. Thornquist, C. Korzeniewski and C. S. Hoaglund, Surf. Sci., 1996, 364, 122–130 CrossRef CAS.
- D. J. Tarnowski and C. Korzeniewski, J. Phys. Chem. B, 1997, 101, 253–258 CrossRef CAS.
- J. Fernandes Gomes, B. Busson, A. Tadjeddine and G. Tremiliosi-Filho, Electrochim. Acta, 2008, 53, 6899–6905 CrossRef.
- Z. Ma and F. Zaera, Catal. Lett., 2004, 96, 5–12 CrossRef CAS.
- G. A. Camara and T. Iwasita, J. Electroanal. Chem., 2005, 578, 315–321 CrossRef CAS.
- I. A. Rodrigues, J. P. I. De Souza, E. Pasror and F. C. Nart, Langmuir, 1997, 13, 6829–6835 CrossRef CAS.
- C. Crisafulli, S. Scirè, S. Giuffrida, G. Ventimiglia and R. Lo Nigro, Appl. Catal., A, 2006, 306, 51–57 CrossRef CAS.
- V. M. Schmidt, R. Ianniello, E. Pastor and S. Gonzalez, J. Phys. Chem., 1996, 100, 17901–17908 CrossRef CAS.
- J. F. E. Gootzen, W. Vissher and J. A. R. van Veen, Langmuir, 1996, 12, 5076–5082 CrossRef CAS.
- S. Wasmus and A. J. Kuver, J. Electroanal. Chem., 1999, 461, 14–31 CrossRef CAS.
- T. Iwasita and E. Pastor, Electrochim. Acta, 1994, 39, 531–537 CrossRef CAS.
- L. Xiao and L. Wang, J. Phys. Chem. A, 2004, 108, 8605–8614 CrossRef CAS.
- V. Kumar and Y. Kawazoe, Phys. Rev. B, 2008, 77, 205418 CrossRef.
- F. Delbecq and P. Sautet, Surf. Sci., 1993, 295, 353–373 CrossRef CAS.
- S. Laref, Y. Li, M. L. Bocquet, F. Delbecq, P. Sautet and D. Laffredo, Phys. Chem. Chem. Phys., 2011, 13, 11827–11837 RSC.
- H. F. Wang and Z. P. Liu, J. Phys. Chem. C, 2007, 111, 12157–1260 CAS.
- T. Redjala, G. Apostolecu, P. Beaunier, M. Mostafavi, A. Etcheberry, D. Uzio, C. Thomazeau and H. Remita, New J. Chem., 2008, 32, 1403–1408 RSC.
- M. Sakamoto, M. Fujistuka and T. J. Majima, J. Photochem. Photobiol., C, 2009, 10, 33–56 CrossRef CAS.
- J. A. Creignton and D. G. Eadon, J. Chem. Soc., Faraday Trans., 1991, 87, 3881 RSC.
- S. Giuffrida, G. G. Condorelli, L. L. Costanzo, I. L. Fragalà, G. Ventimiglia and G. Vecchio, Chem. Mater., 2004, 16, 1260 CrossRef CAS.
- F. D. Lewis, A. M. Miller and G. D. Salvi, Inorg. Chem., 1995, 34, 3173 CrossRef CAS.
- H. D. Gafney and R. L. Lintvedt, J. Am. Chem. Soc., 1971, 93, 1623 CrossRef.
- S. Giuffrida, G. Ventimiglia, F. L. Callari and S. Sortino, Eur. J. Inog. Chem., 2007, 4022 Search PubMed.
- J. Elliott and A. S. Simon, Radiat. Phys. Chem. (1977), 1984, 24, 229–33 CrossRef.
- P. Archirel to be submitted.
- J. P. Perdew, K. Burke and M. Ernzerhof, Phys. Rev. Lett., 1997, 78, 1396 CrossRef CAS.
- D. Andrae, U. Haussermann, M. Dolg, H. Stoll and H. Preuss, Theor. Chim. Acta, 1990, 77, 123 CrossRef CAS.
- F. Rabilloud, M. Harb, H. Ndome and P. Archirel, J. Phys. Chem. A, 2010, 114, 6451–6462 CrossRef CAS.
- A. V. Marenich, C. J. Cramer and D. J. Truhlar, J. Phys. Chem. B, 2009, 113, 6378–6396 CrossRef CAS.
- M. J. Frisch, G. W. Trucks, H. B. Schlegel, G. E. Scuseria, M. A. Robb, J. R. Cheeseman, G. Scalmani, V. Barone, B. Mennucci, G. A. Petersson, H. Nakatsuji, M. Caricato, X. Li, H. P. Hratchian, A. F. Izmaylov, J. Bloino, G. Zheng, J. L. Sonnenberg, M. Hada, M. Ehara, K. Toyota, R. Fukuda, J. Hasegawa, M. Ishida, T. Nakajima, Y. Honda, O. Kitao, H. Nakai, T. Vreven, J. A. Montgomery, Jr., J. E. Peralta, F. Ogliaro, M. Bearpark, J. J. Heyd, E. Brothers, K. N. Kudin, V. N. Staroverov, R. Kobayashi, J. Normand, K. Raghavachari, A. Rendell, J. C. Burant, S. S. Iyengar, J. Tomasi, M. Cossi, N. Rega, J. M. Millam, M. Klene, J. E. Knox, J. B. Cross, V. Bakken, C. Adamo, J. Jaramillo, R. Gomperts, R. E. Stratmann, O. Yazyev, A. J. Austin, R. Cammi, C. Pomelli, J. Ochterski, R. L. Martin, K. Morokuma, V. G. Zakrzewski, G. A. Voth, P. Salvador, J. J. Dannenberg, S. Dapprich, A. D. Daniels, O. Farkas, J. B. Foresman, J. V. Ortiz, J. Cioslowski and D. J. Fox, GAUSSIAN 09 (Revision A.2), Gaussian, Inc., Wallingford, CT, 2009 Search PubMed.
- Handbook of Chemistry and Physics, ed. D. R. Lide, CRC Press, 1994 Search PubMed.
- E. Apra, F. Baletto, R. Ferrando and A. Fortunelli, Phys. Rev. Lett., 2004, 93, 065502 CrossRef CAS.
- T. Hattori and R. L. Burwell Jr, J. Phys. Chem., 1979, 83, 241–249 CrossRef CAS.
- B. Torok, A. Molnar, I. Palinko and M. J. Bartok, J. Catal., 1994, 145, 295–299 CrossRef CAS.
- F. Zaera, Catal. Lett., 2003, 91, 1–10 CrossRef CAS.
- A. L. Marsh and G. A. Somorjai, Topics Catal., 2005, 34, 121–128 CrossRef CAS.
| This journal is © The Royal Society of Chemistry 2012 |