Reaction mechanism of dimethyl carbonate synthesis on Cu/β zeolites: DFT and AIM investigations†
Yongli
Shen
,
Qingsen
Meng
,
Shouying
Huang
,
Shengping
Wang
,
Jinlong
Gong
and
Xinbin
Ma
*
Key Laboratory for Green Chemical Technology of Ministry of Education, School of Chemical Engineering and Technology, Tianjin University, Tianjin 300072, China. E-mail: xbma@tju.edu.cn
First published on 1st June 2012
Abstract
The mechanism of dimethyl carbonate (DMC) synthesis on Cu-exchanged zeolite β has been investigated employing density functional theory (DFT) calculations and a double numerical plus polarization (DNP) basis set. The adsorption energy (ΔE) and decomposition activation energy (Ea) for O2 are −1.84 and 1.72 eV, respectively, suggesting that the decomposition of O2 occurs readily under reaction conditions on the Cu site. The formed O atom further reacts with methanol to form surface-bound (CH3O)(OH)–Cu(I)/β, in which CH3O and OH were coadsorbed on the Cu+ of the catalyst; this process proceeds without an activation barrier and with an energy release of 1.23 eV. The (CH3O)(OH)–Cu(I)/β species then reacts with another methanol molecule and carbon monoxide to produce DMC through two different reaction pathways. In path I, insertion of carbon monoxide into the (CH3O)(OH)–Cu(I)/β leads to the formation of monomethyl carbonate species (CH3OCOOH), which then reacts with methanol to produce DMC and H2O. The activation energies for both steps are 0.97 and 0.65 eV, respectively. In path II, (CH3O)(OH)–Cu(I)/β reacts with methanol first to produce a dimethoxide species ((CH3O)(CH3O)–Cu(I)/β), and the formation of DMC is via the insertion of carbon monoxide into the (CH3O)(CH3O)–Cu(I)/β. The activation energies for these elementary reactions are 0.65 and 0.70 eV, respectively. The topological properties of electron density distributions for all the related stationary points involved in this reaction have also been examined using the atoms in molecule (AIM) theory for the illustration of the bond paths and weak interactions of all the stationary points in the reaction path.
1. Introduction
DMC is considered as an environmentally benign chemical due to its negligible ecotoxicity and low bioaccumulation,1 and thus the production and utilization of DMC have attracted much attention. It can serve as an oxygen-containing fuel additive, a precursor for synthesis of carbonic acid derivatives, a methylating agent, and an intermediate for the synthesis of polycarbonates and isocyanates.2–4 Special focus has been placed on the synthesis of DMC via gas-phase oxidative carbonylation of methanol, a substitution for the traditional phosgene process and an alternative process to both liquid-phase oxidative carbonylation and methylnitrite carbonylation. Cu-exchanged zeolites have been extensively investigated for this reaction.5–12 It has been shown that Cu–X and Cu–Y are the most active catalysts for producing DMC, whereas Cu–ZMS-5 and Cu–MOR are less active and exhibit a high selectivity to dimethoxy methane (DMM).9Bell and co-workers have systemically studied the kinetics of DMC formation on a well characterized Cu–Y sample prepared by dry exchange of H–Y with CuCl.9,10 They have shown that the kinetics of DMC formation are nearly first order in carbon monoxide partial pressure, whereas the dependencies on methanol and oxygen partial pressures are nearly zero order. They also pointed out that, when CO is present in the gas phase, the methoxide species reacts slowly to form CH3OCOOH (MMC),10 rather than carbonmethoxide (CH3OCO–) proposed by King.13,14
There are a number of works regarding the understanding of the reaction scheme of oxidative carbonylation reaction.9,10,13,14 The in situ infrared spectroscopy and mass spectrometry studies of DMC synthesis from oxidative carbonylation of methanol over Cu-exchanged Y zeolite have pointed out that the formation of DMC is initiated by reaction of molecularly adsorbed methanol with oxygen to form either mono- or di-methoxide species bound to Cu+ cations. Reaction of the mono-methoxide species with CO produces monomethyl carbonate (MMC) species. DMC is formed via two distinct reaction pathways—CO addition to di-methoxide species or by reaction of methanol with MMC.10 The DFT calculations searched the transition states of CO insertion reaction,15 but other elementary reactions were not examined, and none of studies has reported a detailed reaction mechanism for the DMC synthesis over Cu(I)/β. It renders a detailed investigation regarding the pathway of the overall reaction a necessity.
This paper describes the mechanism for DMC formation on Cu(I)/β using DFT calculations. We obtained the nature of the transition state and calculated activation energy for all the elementary reactions involved in the DMC formation from methanol and oxygen in the presence of carbon monoxide. Topological analysis of the electron density distribution of all the stationary points was also carried out to understand the formation and breaking of chemical bonds during this process.
2. Method and calculation details
All the species examined in this study were geometrically optimized with density functional theory (DFT) within the generalized-gradient approximation (GGA)16 using the DMol3 code from Materials Studio 3.0. The PW91 functional17 and double numerical plus polarization (DNP) basis set, which is equivalent in accuracy to the commonly used 6-31G** Gaussian orbital basis set, were used throughout the calculation. The convergence criteria were set to be 2×10⁻⁵ Ha, 0.004 Ha Å−1, and 0.005 Å for energy, force, and displacement convergence, respectively. A self-consistent field (SCF) density convergence with a threshold value of 1×10⁻⁵ Ha was specified. In order to keep the clusters in their positions in the H-BEA lattice, all dangling bonds were saturated with hydroxyl groups and terminal H atoms were oriented in the direction of the next tetrahedral atom. All the transition states were determined by the linear synchronous transit (LST) and quadratic synchronous transit (QST) methods. Vibrational frequencies analyses were used to determine the nature of the stationary points, i.e., minima (without imaginary frequency) or transition state (with one imaginary frequency).The results derived from a topological study on the electronic charge density distribution, within the framework of the atoms in molecules theory (AIM),18 was carried out in order to examine not only what changes occur in the formation and breaking of bonds but also the ionic or covalent nature of the atomic interactions.
The use of topological concepts is well documented in the standard literature.18,19 It has been proved to be a useful and successful tool in the interpretation of the charge density toward a wide variety of chemical concepts.18 In the topological distribution of the electronic charge density, two important topological features appear as a consequence of the interaction between two atoms: (a) a bond critical point (BCP), and (b) a bond path (BP). A BCP has two negative eigenvalues and a positive eigenvalue; the negative eigenvalues of the Hessian matrix (λ1 and λ2) measure the degree of contraction of the charge density at a BCP (ρb) (calculated properties at the BCP are labeled with the subscript “b” throughout the work) perpendicular to the bond toward the critical point, while the positive eigenvalue (λ3) measures the degree of contraction parallel to the bond and from the BCP toward each of the neighboring nuclei.
The eigenvectors associated with the eigenvalue λ3 define a unique pair of trajectories of ∇ρr that originates in BCP, each of which terminates at the nucleus of one of the neighboring atoms. This pair of trajectories linking two nuclei in a molecule and existing in equilibrium geometry is called a bond path. The electron density, ρb, at the BCP is related to the bond order and therefore the bond strength.20
The Laplacian of ρr appears in the local expression of the virial theorem which can be written as:
| h2/4m∇2ρr = 2Gr + Vr |
where Gr and Vr are the kinetic and potential energy densities, respectively. Since Gr > 0 and Vr < 0, a positive ∇2ρb at a BCP reveals that the contribution of kinetic energy is greater than that of potential energy and shows depletion of electronic charge along the bond path. This is the case encountered in closed shell (electrostatic) interactions.21 The ratio |λ1/λ3| is lower than 1 in the closed-shell interactions.18,22 When ∇2ρb is negative and large in magnitude, electronic charge is concentrated in the internuclear region. The result is a sharing of electronic charge by both nuclei, as is found for interactions usually characterized as covalent or polar and they shall be referred to as shared interactions. This concentration of electronic charge in the interatomic surface is reflected in relatively large values of ρb, the value of ρ at the (3,−1) critical point, for molecules with shared interactions and the ratio of the perpendicular contractions of ρ to its parallel expansion, as measured by the ratio |λ1/λ3|, is greater than unity.18,22
The density of the total electronic energy function is related to the density of the potential and kinetic energy by the expression:
| Hr = Gr + Vr |
where Hr designs the density of the total electronic energy at the r point.
Notably, bonds with covalent character must have a BCP with negative values for ∇2ρb and Hb; but the conditions in which |Vr|/Gr > 1 but |Vr| < 2Gr give a result such that ∇2ρb would be positive (closed shell interaction), while Hb is negative (shared interaction). Therefore, they must be termed as partially covalent and partially electrostatic.21,23
3. Results and discussion
3.1 Cluster model of the Cu(I)/β catalyst
Zeolites are simulated by means of a fragment of the framework24–36 or using realistic three-dimensional structures.37–40 The former (cluster approach) represents an attempt to apply techniques of molecular chemistry to bonding in the solid state. The latter (the periodic approach) utilizes the full periodicity of a crystalline solid.41 In our work, a cluster model was selected to describe the structure of the Cu(I)/β zeolite.A Brønsted acidic site is formed when a silicon atom is replaced by an aluminum atom. A proton is attached to the oxygen atom connecting the silicon and its aluminum atom neighbor, resulting in a chemically stable Si–(OH)–Al structure. Si–O and Al–O bonds have considerable covalency, resulting in a relatively weak O–H bond, which accounts for the high acidity of the attached proton and thus for the high reactivity.42–46 The Brønsted acidic site can be generally modeled by one of the following cluster models:
| H–O–AlH2–(OH)–H | (1) |
| H–O–Al(OH)2–(OH)–H | (2) |
| H3Si–O–AlH2–(OH)–SiH3 | (3) |
| H3Si–O–Al(OH)2–(OH)–SiH3 | (4) |
The differences among these cluster models lie in the number of tetrahedral (T) molecules (Al and Si) and the termination bonds (H or OH). Cluster models (1) and (2) contain only one tetrahedral structure—aluminum (no silicon) and are called 1T clusters. Cluster models (3) and (4) contain three tetrahedral structures (i.e., one aluminum and two silicons) and are called 3T clusters.
Several researchers use 5T or 6T cluster models to examine metal-exchanged zeolites.9,15,36,47–49 In the current study the 6T cluster model, in which all the dangling bonds were saturated with hydroxyl groups (Fig. 1b), was chosen to represent the straight channel of β-zeolites. Fig. 1a shows all inequivalent tetrahedral (T1–T5) positions of the main channel of the β zeolite framework. All the tetrahedral positions in Fig. 1a are possible for Al/Si substitutions, as there is only 0.13 eV energy difference for them. Fig. 2 shows that all exchange sites except V′ are stable, and a Cu+ cation anchored in site I (Fig. 1b) is the most stable structure. The computational results show that the Cu cation is coordinated to framework oxygens with a coordination number of 2–3 at a distance of 0.2 ± 0.01 nm, slightly different from the EXAFS data obtained for Cu–Y zeolite.10
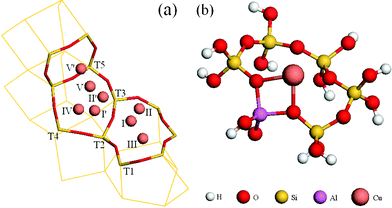 | ||
| Fig. 1 Possible Cu-exchange sites in β-zeolites (a) and the 6T-cluster mode (b). | ||
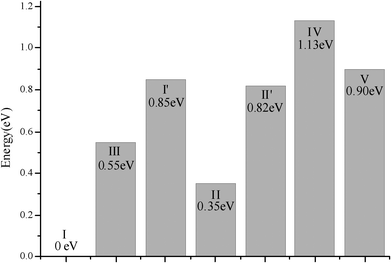 | ||
| Fig. 2 The diffusion energy for a Cu+ cation in the main channel of the β-zeolite framework. | ||
3.2 Overall reaction mechanism for DMC formation on Cu(I)/β
A proposed reaction mechanism based on our calculations for the oxidative carbonylation of methanol to produce DMC is illustrated in Fig. 3. The reaction is initiated by the adsorption and decomposition of oxygen. Methanol reacts with an oxygen atom to produce a surface-bound methoxide species ((CH3O)(OH)–Cu(I)/β), in which OH and CH3O are coadsorbed on the Cu+ site of the catalyst.10,15 This species further undergoes the insertion of carbon monoxide and methanol to produce DMC.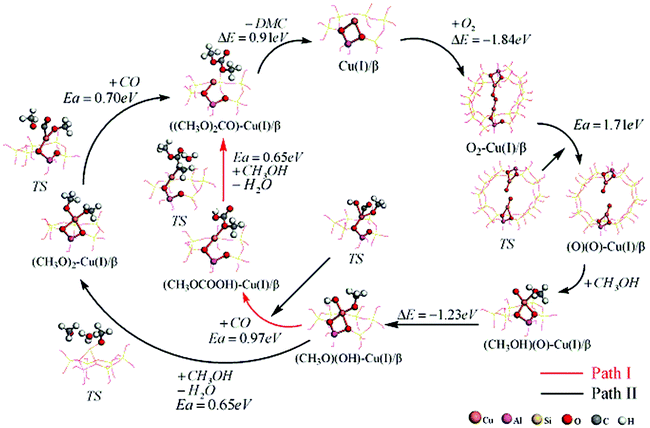 | ||
| Fig. 3 The overall catalytic cycle for the oxidative carbonylation of methanol to produce DMC. | ||
Because the reaction system contains both methanol and carbon monoxide, there could be two possible reaction pathways.10,15 Neither the transition states nor the final states for these reactions are equivalent. As shown in Fig. 3, for path I, (CH3O)(OH)–Cu(I)/β species reacts with carbon monoxide to produce monomethyl carbonate species (CH3OCOOH(MMC)),10,15 which then readily reacts with another methanol molecule to produce surface-bound DMC. In path II, (CH3O)(OH)–Cu(I)/β species would react with the methanol first to produce dimethoxide species ((CH3O)(CH3O)–Cu(I)/β). This intermediate then reacts with carbon monoxide to produce the DMC.10
3.3 Oxidation of methanol
Previous experimental results have shown that, when O2 is present in the system, regardless the existence of carbon monoxide, molecularly adsorbed methanol is converted rapidly to the methoxide species (CH3O)(OH)–Cu(I)/β.10 O2 can adsorb on the active sites of the catalyst through two different manners (Fig. 4), which we named (a) equatorial-adsorption and (b) axial-adsorption. As two Cu+ sites are needed in the process of O2 decomposition, the 24T cluster model was used to simulate the straight channel of β zeolite (Fig. 4). For the equatorial-adsorption oxygen, the adsorption energy was −1.28 eV, whereas it was −1.84 eV for the axial-adsorption oxygen. The reaction coordinates and the transition states for the decomposition of different adsorbed O2 are illustrated in Fig. 4.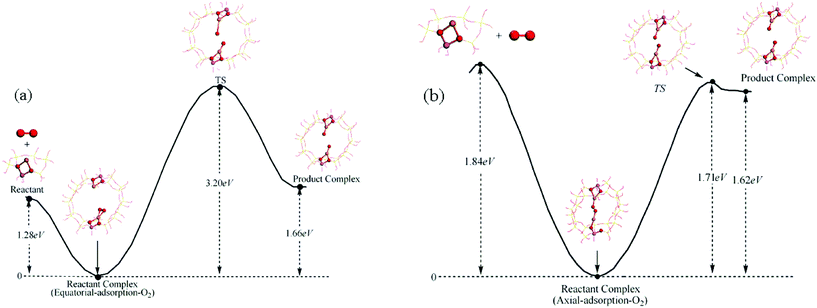 | ||
| Fig. 4 Reaction coordinates for the decomposition of O2: (a) equatorial-adsorption oxygen (b) axial-adsorption oxygen. | ||
As shown in Fig. 4a, the activation energy for decomposition of equatorial-adsorption-O2 was 3.2 eV, which was too high to be achieved under experimental conditions. For the axially-adsorbed-O2 (Fig. 4b), the decomposition activation energy was 1.72 eV and the adsorption energy was −1.84 eV; this energy landscape indicates that the decomposition of axial-adsorption-O2 could readily occur. Therefore, we consider that axially adsorbed O2 on the surface is energetically favorable for decomposition. Upon the creation of an O atom on a Cu+ site of the catalyst, it reacted with the methanol rapidly to form (CH3O)(OH)–Cu(I)/β, in which CH3O and OH were coadsorbed on Cu. This reaction is exothermic with an energy release of 1.23 eV (Fig. 3).
3.4 Formation of DMC
The formed (CH3O)(OH)–Cu(I)/β species can further react with either carbon monoxide or methanol to form the respective surface intermediates as mentioned earlier. Both processes, which consist of two elementary reactions, will be discussed individually as follows. The structures of reactant complex, product complex and transition state for all the elementary reactions involved in Path I and Path II are illustrated in Fig. 5 and 6, and the corresponding structural parameters are listed in Tables 1 and 2.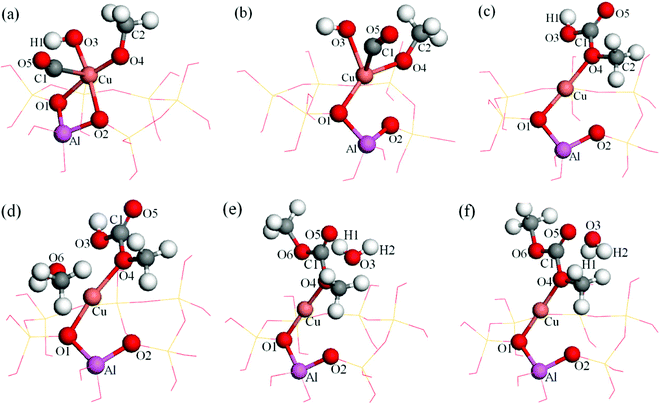 | ||
| Fig. 5 Energy minima and transition states of dimethoxide and DMC formation reaction for Path I (a): CH3O–OH–CO–Cu(I)/β, (b): transition state, (c): MMC–Cu(I)/β, (d): MMC–CH3OH–Cu(I)/β, (e): transition state, (f): DMC–H2O–Cu(I)/β. | ||
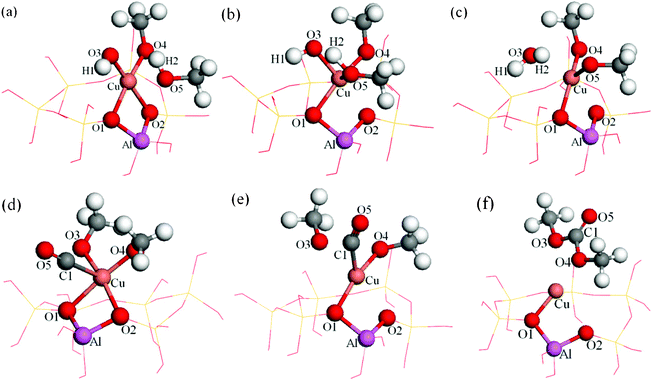 | ||
| Fig. 6 Energy minima and transition states of CO insertion and DMC formation reaction for Path II (a): CH3O–OH–CH3OH–Cu(I)/β, (b): transition state, (c): (CH3O)2–H2O–Cu(I)/β, (d): (CH3O)2–CO–Cu(I)/β, (e): transition state, (f): DMC–Cu(I)/β. | ||
| Bond length | CH3O–OH–CO | TS | CH3OCOOH |
|---|---|---|---|
| Insertion of CO | |||
| Cu–O1 | 0.2041 | 0.2077 | 0.1908 |
| Cu–O2 | 0.2139 | 0.2614 | 0.2527 |
| Cu–O3 | 0.1842 | 0.2161 | 0.2896 |
| Cu–O4 | 0.1847 | 0.1962 | 0.1973 |
| Cu–C1 | 0.2779 | 0.1937 | 0.2978 |
| C1–O5 | 0.1140 | 0.1161 | 0.1204 |
| C1–O3 | 0.3344 | 0.1829 | 0.1340 |
| C1–O4 | 0.3232 | 0.2665 | 0.1381 |
| O3–H1 | 0.0980 | 0.0992 | 0.0976 |
| Formation of DMC | |||
| Cu–O1 | 0.1972 | 0.1895 | 0.1894 |
| Cu–O2 | 0.2601 | 0.2678 | 0.2627 |
| Cu–O3 | 0.2886 | 0.3494 | 0.4711 |
| Cu–O4 | 0.2043 | 0.1966 | 0.1942 |
| Cu–O6 | 0.2389 | 0.2720 | 0.2854 |
| C1–O5 | 0.1207 | 0.1201 | 0.1206 |
| C1–O3 | 0.1345 | 0.2429 | 0.3249 |
| C1–O4 | 0.1370 | 0.1384 | 0.1393 |
| C1–O6 | 0.3776 | 0.1360 | 0.1328 |
| O3–H1 | 0.1976 | 0.0963 | 0.0977 |
| O3–H2 | 0.4217 | 0.0974 | 0.0976 |
| O6–H2 | 0.0984 | 0.3354 | 0.3440 |
| Bond length | CH3O–OH–CH3OH | TS | double-CH3O–H2O |
|---|---|---|---|
| Formation of dimethoxide intermediate | |||
| Cu–O1 | 0.2010 | 0.1982 | 0.1956 |
| Cu–O2 | 0.2060 | 0.2305 | 0.2544 |
| Cu–O3 | 0.1820 | 0.2046 | 0.2547 |
| Cu–O4 | 0.1816 | 0.1797 | 0.1774 |
| Cu–O5 | 0.2600 | 0.2143 | 0.1852 |
| C1–O4 | 0.1391 | 0.1385 | 0.1394 |
| O3–H1 | 0.0981 | 0.1004 | 0.0973 |
| O3–H2 | 0.2539 | 0.1367 | 0.0975 |
| O5–H2 | 0.0972 | 0.1197 | 0.2363 |
| Formation of DMC | |||
| Cu–O1 | 0.2100 | 0.2075 | 0.1901 |
| Cu–O2 | 0.2082 | 0.2403 | 0.2590 |
| Cu–O3 | 0.1852 | 0.2283 | 0.2802 |
| Cu–O4 | 0.1856 | 0.1861 | 0.1961 |
| Cu–C1 | 0.2662 | 0.2003 | 0.2931 |
| C1–O5 | 0.1140 | 0.1156 | 0.1206 |
| C1–O3 | 0.3220 | 0.1927 | 0.1332 |
| C1–O4 | 0.3435 | 0.2584 | 0.1388 |
Insertion of CO. The CO insertion reaction is strongly exothermic by −2.42 eV (Fig. 7, blue curve). The initial state involves the coadsorption of CH3O, OH and CO on the Cu+ site of the catalyst (Fig. 5a). The distances between C1–O3 and C1–O4 were decreased during this process, suggesting that carbon monoxide approached to the oxygen atoms of OH and CH3O. Upon the completion of the reaction, dC1–O3 and dC1–O4 were reduced to 0.1340 and 0.1381 nm respectively (Table 1), indicating that MMC formed, and this is similar to that proposed by Bell and co-workers.10,15 The distance between C1 and Cu+ decreased at the beginning of this process, but increased when the reaction completed. Additionally, the Cu–O3 distance was elongated to 0.2896 nm, whereas the bond length of Cu–O4 was slightly increased to 0.1973 nm (Table 1), which confirms that the formed MMC adsorbs on the Cu site via its O4 atom (Fig. 5c). The bond strength of carbon monoxide (carbonyl) decreases slightly, which is evidenced by an increase of bond length from 0.1140 to 0.1204 nm (Table 1). The Cu+ species moved away from its original position since both dCu–O1 and dCu–O2 changed in the course of the reaction (Fig. 5c). The activation energy for this process is 0.97 eV (Fig. 7).
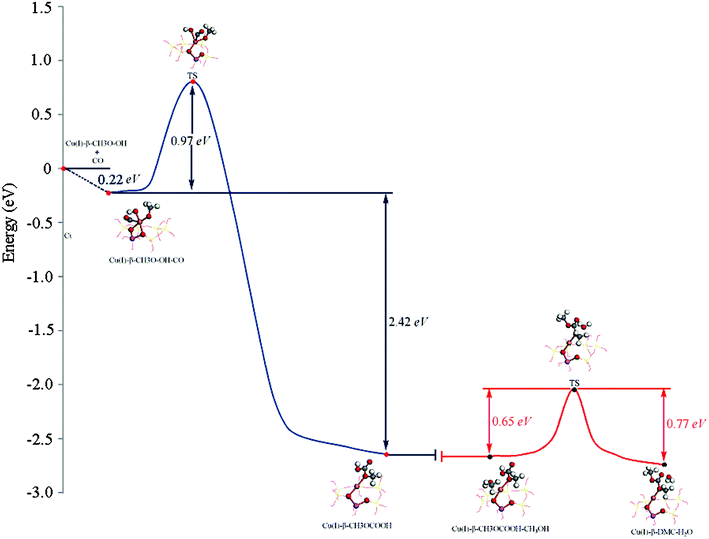 | ||
| Fig. 7 The minimum energy path for Path I. Formation of MMC is shown in blue. Formation of DMC is shown in red. Zero of the energy scale corresponds to the energy of gas-phase CO at infinite separation from the CH3O–OH–Cu(I)/β. | ||
Formation of DMC. When MMC is formed, it will further react with methanol to produce DMC and H2O.10 This elementary reaction is slightly endothermic by 0.12 eV (Fig. 7, red curve). In this step the methanol and MMC were coadsorbed on the Cu+ site in the reaction complex (dCu–O4 = 0.2043 nm, dCu–O6 = 0.2389 nm (Table 1)). As the reaction proceeded, the C1–O3 bond extended to 0.2429 nm (Table 1) in the transition state, whereas it was 0.3249 nm (Table 1) in the product, suggesting that the C1–O3 bond was completely broken when the reaction completed (Fig. 5f). The distance between C1 and O6 decreased from 0.3776 to 0.1328 nm (Table 1), implying DMC was formed. There was merely a 0.0101 nm (Table 1) change in the Cu–O4 bond during this process, so the new formed DMC adsorbed on the Cu+ site via its O4 atom (Fig. 5f). The distance between O3 and H2 was 0.0976 nm (Table 1) when the reaction completed, which means an H2O formed with the formation of DMC, and 0.54 eV was needed for the H2O desorption. The activation energy for this process was 0.65 eV, which is 0.32 eV lower than that of MMC formation (Fig. 7), implying the CO insertion reaction is the rate-determining step for this pathway, which is in agreement with the experimental results.5–7,13,14
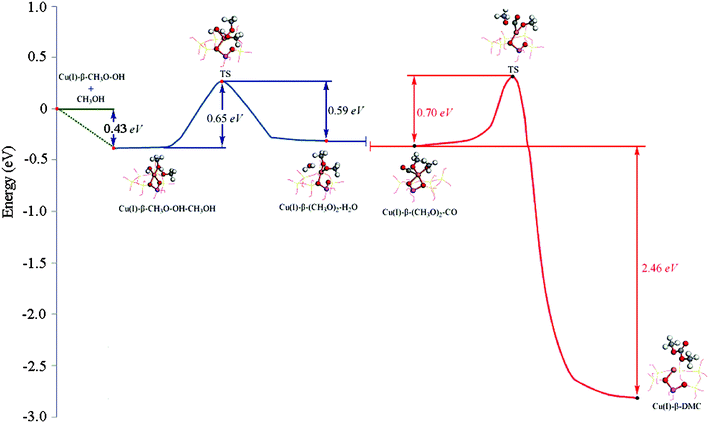 | ||
| Fig. 8 The minimum energy path for Path II. Formation of (CH3O)2–H2O–Cu(I)/β is shown in blue. Formation of DMC is shown in red. Zero of the energy scale corresponds to the energy of gas-phase CH3OH at infinite separation from the CH3O–OH–Cu(I)/β. | ||
Formation of dimethoxide intermediate. The minimum energy path of (CH3O)2–Cu(I)/β formation is shown in Fig. 8 (blue curve). This step is nearly thermoneutral (with a ΔE of ∼0.06 eV). The computational results show that methanol is attached to the Cu+ site with its O atom (dO5–Cu = 0.2600 nm (Table 2)) at the beginning of this elementary reaction (Fig. 6a). The H2 atom of the hydroxyl on methanol gradually approached the O3 atom of the adsorbed hydroxyl, leading to the formation of a hydrogen bond structure between them (Fig. 6b). Consequently, H2–O5 was broken, and H2–O3 was formed, resulting in the formation of CH3O and H2O. Two CH3O were coadsorbed on the Cu+ cation in the product complex, in which dO5–Cu = 0.1852 nm, dO4–Cu = 0.1774 nm (Table 2). The activation energy for this process is 0.65 eV and the desorption energy of H2O is 0.69 eV. The Cu+ cation of the activate site has only slightly migrated from its original position during this process (Fig. 6c).
Insertion of CO. When the (CH3O)2–Cu(I)/β intermediate is formed, it will react with carbon monoxide to produce DMC.10 The minimum energy path identified for this elementary reaction is shown in Fig. 8 (red curve). This step is strongly exothermic by 2.46 eV. CO is adsorbed nearly perpendicularly on the O3–O4–Cu surface in the reaction complex, and with a small tilt angle from the O3–O4–Cu surface normal in the TS. The distance between the C1 and O atoms of CH3O was decreased during this reaction process (Table 2), indicating that the C1 atom was bonded with the O atom of CH3O groups. The bond length of Cu–O3 increased during this process, suggesting negligible interaction between Cu+ cation and O3 upon the completion of the reaction. DMC bonded to the Cu through the O4 atom. The activation energy barrier for this step is calculated to be 0.70 eV, slightly higher than the barrier for the formation of the dimethoxide species, indicating that insertion of CO is the rate-determining step for this pathway, which is in accord with the experimental observation.5–7,13,14
3.5 Topological local properties for the formation of DMC
Molecular graphs of optimized energy minima and transition states for Paths I and II are shown in Fig. 9 and 10. Local topological properties (e.g., ρb, ∇2ρb, the ellipticity (ε), Hb, Gb, Vb, |Vb|/Gb and |λ1|/λ3) at the BCPs (3, −1) for structures in Fig. 9 and 10 are listed in Tables S1, S2, S3 and S4.†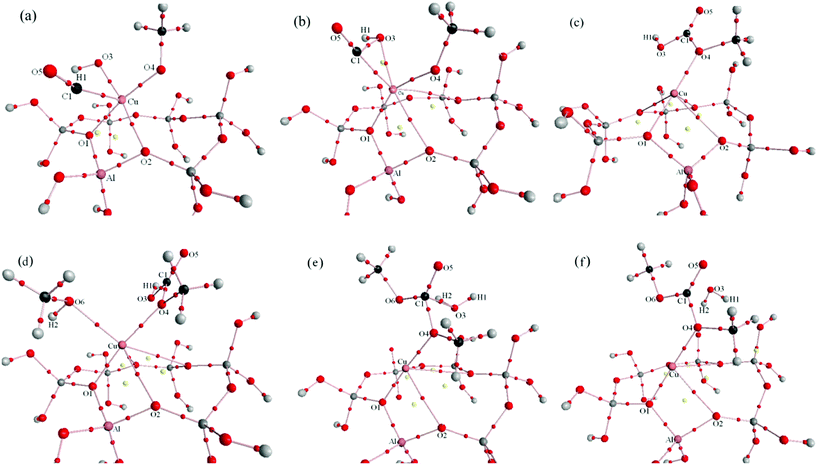 | ||
| Fig. 9 Molecular graphs (including critical points) for Path I (a: reactant complex of CO insertion reaction, b: transition state of CO insertion reaction, c: product complex of CO insertion reaction, d: reactant complex of DMC formation reaction, e: transition state of DMC formation reaction, f: product complex of DMC formation reaction). Bond paths are denoted by solid lines, BCPs are denoted by small red balls which are on the bond path, and RCPs are denoted by yellow balls. | ||
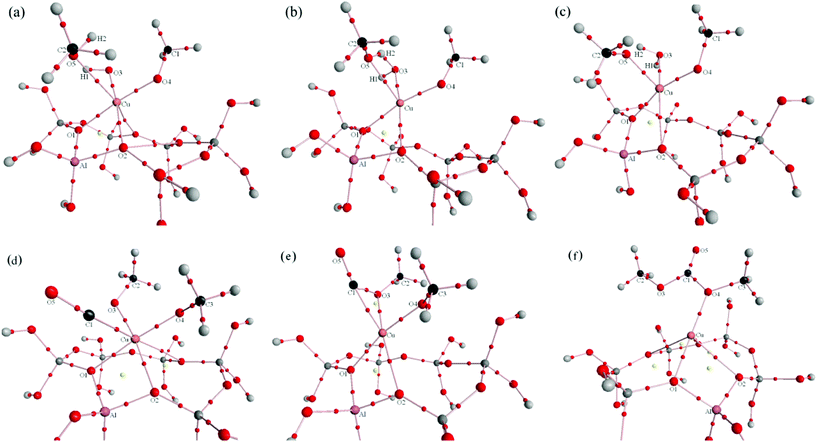 | ||
| Fig. 10 Molecular graphs (including critical points) for Path II (a: reactant complex of dimethoxide formation reaction, b: transition state of dimethoxide formation reaction, c: product complex of dimethoxide formation reaction, d: reactant complex of DMC formation reaction, e: transition state of DMC formation reaction, f: product complex of DMC formation reaction). Bond paths are denoted by solid lines, BCPs are denoted by small red balls which are on the bond path, and RCPs are denoted by yellow balls. | ||
Several properties that can be evaluated at the BCP constitute useful tools to classify the interactions between fragments.20
In Table S1,† it can be seen that all the BCP of Cu–O bonds involved in CO insertion reaction are described by relatively small values of ρb and positive values of ∇2ρb, while |V(r)|/G(r) is close to 1 and |λ1|/λ3 is less than 1. These topological properties allow one to characterize the Cu–O bonds, as closed shell interactions, that is, bonds in which ionic interactions are the dominant ones. This condition does not change significantly in the course of the DMC formation process (Tables S2, S3 and S4†).
Insertion of CO. The optimized interatomic distance of Cu–C1 is 0.2779 nm in the reaction complex. We obtained ρCu–C1 of 0.0184 implying a very weak interaction between two species. The topological property of its BCP shows this is a typical close shell interaction (Table S1†). With the elongation of C1–Cu (0.2978 nm in the product complex), this interaction weakened in the product complex (Table S1† and Fig. 9c), implying that when MMC was formed, it did not adsorb on the catalyst surface with its C1 atom. Following the appearance of a BCP between C1 and O3, a 3-membered ring structure (together with a ring critical point (RCP)) was formed in the TS with C1–O3, C1–Cu and O3–Cu equal to 0.1829, 0.1937 and 0.2161 nm (Fig. 9b and 11b). Fig. 11b shows the contour map of negative values of the Laplacian (−∇2ρb) in the plane that contains the BCPs and RCP of this ring structure; BCP(C1–O3) and BCP(C1–Cu) lie in a zone of decrement of the electronic charge density, that is in the region of ∇2ρb > 0, in correspondence with a closed shell interaction. There is a relatively large negative value of Hb for those two BCPs implying that they are partially covalent and partially electrostatic.21 BCP(C1–O3) and BCP(C1–O4) were found in the product complex and described by relatively large values of ρb, negative values of ∇2ρb and Hb, suggesting that two new formed bonds were covalent in nature. With respect to the isolated carbon monoxide, C1–O5 maintains its triple C–O bond characteristics in the reaction complex and transition state (small ellipticity, large positive value of ∇2ρb and negative value of Hb), but accompanies the formation of MMC, C1–O5 displays typical double bond characteristics in the product complex (large ellipticity, large negative value of ∇2ρb and negative value of Hb). Only one BCP(Cu–O4) exists between MMC and the catalyst (Fig. 9), so we can conclude that upon formation MMC adsorbs on the Cu+ site of the catalyst with only one oxygen atom (O4) through a very weak close shell interaction.
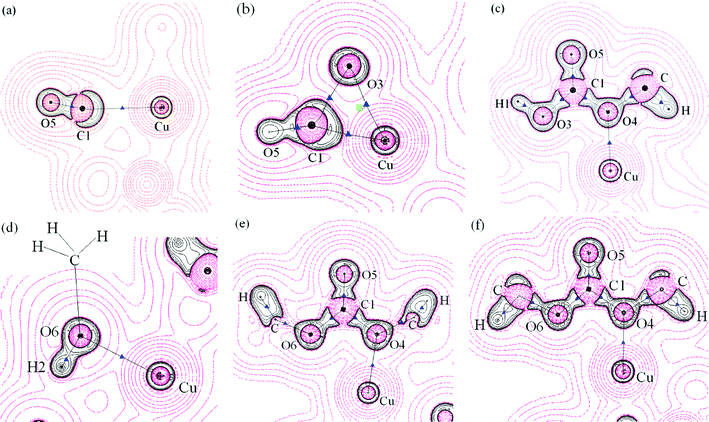 | ||
| Fig. 11 A contour map of the negative values of the Laplacian distribution (−∇2ρb) for some important areas for CO insertion and DMC formation reaction of Path I, black circles: regions of electronic charge concentration, red circles: regions of electronic charge depletion, black solid lines: bond paths, blue triangles: BCPs, green rectangle: RCP, black dots: nuclei (at the plane) and crosses: nuclei (out of the plane). (a): reactant CH3O–OH–CO–Cu(I)/β, (the plane illustrated contains O5, C1 and Cu); (b): transition state (the plane illustrated contains O5, C1 and Cu); (c): product MMC–Cu(I)/β (the plane illustrated contains all C,O atoms of MMC and Cu), (d): reactant MMC–CH3OH–Cu(I)/β, (the plane illustrated contains H2, O6 and Cu), (e): transition state (the plane illustrated contains O6, C1, O4, O5 and Cu), (f): product DMC–Cu(I)/β (the plane illustrated contains all C,O atoms of DMC and Cu). | ||
Formation of DMC. The existence of BCP(Cu–O6) and BCP(Cu–O4) shows that methanol and MMC co-adsorbed on the catalyst at the beginning of this elementary reaction. The topological properties for the BCPs suggest those interactions were very weak and electrostatic dominant (Table S2†). The density value ρb at BCP(C1–O3) decreased from 0.3101 au in the reaction complex to 0.0254 au in the transition state, indicating that the C1–O3 covalent bond changed to a very weak electrostatic interaction (Table S2†). Simultaneously a BCP between C1 and O6 was found in both the TS and product complex, suggesting that a new C1–O6 covalent bond associated with DMC was formed (Table S2†). BCP(O6–H2) disappeared in the TS and product complex, whereas BCP(O3–H2), whose topological properties were similar to BCP(O3–H1), was found in the TS and product complex (Fig. 9e and 9f), implying the TS is “product-like” and H2O was formed. Only one BCP(O4–Cu) (low value of ρb, positive ∇2ρb and Hb close to zero) existed between the product complex and Cu+ site, suggesting that the new formed DMC adsorbed at the Cu+ of the catalyst with a very weak electrostatic interaction via the O4 atom.
Formation of dimethoxide intermediate. The most important topological changes observed upon formation of the dimethoxide intermediate are new BCPs between O5–Cu and O3–H2, and the decrease of the electronic charge density in the BCP at the O3–Cu bond. Fig. 12a shows a weak close shell interaction between Cu and O5 in the reaction complex. The electron density of this BCP increased from 0.0221 au in the reaction complex to 0.0603 au in the transition state, followed by 0.1198 au in the product complex. The Laplacian (−∇2ρb) of this BCP was positive during the whole reaction process, and Hb of this BCP remains negative in the TS and product complex, indicating that O5–Cu was an electrostatic interaction with covalent characteristic (Table S3† and Fig. 12a–c show that BCP(O5–Cu) was located at the region of ∇2ρb > 0). A BCP between O3 and H2 arose in the TS, indicating the formation of O5⋯H2⋯O3 hydrogen bond (Fig. 12b). The BCPs of O5–H2 and O3–H2 involved in the hydrogen bond are described by relatively small values of ρb, negative values of ∇2ρb and Hb, |V(r)|/G(r) > 1, indicating that they were weak shared interaction. In the product complex BCP(O5–H2) disappeared, and the electron density of BCP(O3–H2) increased to 0.3529 au, which is very close to BCP(O3–H1), indicating that H2O was formed. There was almost no interaction between the newly formed H2O and the catalyst in the product complex.
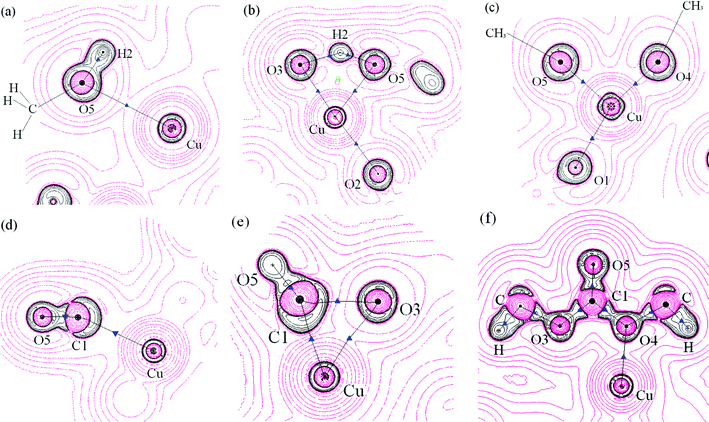 | ||
| Fig. 12 A contour map of the Laplacian distribution −∇2ρb for some important areas for dimethoxide and DMC formation reaction of Path II, black circles: regions of electronic charge concentration, red circles: regions of electronic charge depletion, black solid lines: bond paths, blue triangles: BCPs, green rectangle: RCP, black dots: nuclei (at the plane) and crosses: nuclei (out of the plane). (a): reactant CH3O–OH–CH3OH–Cu(I)/β, (the plane illustrated contains H2, O5 and Cu); (b): transition state (the plane illustrated contains a hydrogen bond composed of O3, H2 and O5); (c): product (CH3O)2–Cu(I)/β (the plane illustrated contains O4, O5 and Cu), (d): reactant (CH3O)2–CO–Cu(I)/β, (the plane illustrated contains C1, O5 and Cu), (e): transition state (the plane illustrated contains C1, O5, O3 and Cu), (f): product DMC–Cu(I)/β (the plane illustrated contains all C,O atoms of DMC and Cu). | ||
Insertion of CO. Similar to that proposed in the formation of MMC for Path I, CO adsorbed at the Cu+ site of the catalyst with the C1–Cu interatomic distance estimated to be 0.2662 nm in the reaction complex. With the changes of interatomic distance between C1–Cu (0.2003 nm in the TS, and 0.2931 nm in the product complex), the charge density ρb of BCP(C1–Cu) increased from 0.0232 au in the reaction complex to 0.0933 au in the TS, then disappeared in the product complex, indicating that there was no interaction between C1 and Cu+ upon the formation of DMC. Changes in the topological properties of BCP(C1–O5) show that carbon monoxide maintains its triple C–O bond characteristic in the reaction complex and TS, with respect to the isolated CO. When DMC is formed, C1–O5 displays double bond characteristic in product complex (Table S4†). Fig. 12d demonstrates a 3-membered ring structure of Cu–C1–O3 (together with an RCP); a new BCP between C1 and O3 appears in the TS, suggesting that C1 is bound with O3. The BCP(C1–O3) is located in an area of decrement of the electronic charge density (∇2ρb > 0) (Fig. 12d), in correspondence with a closed shell interaction, and the bent-bond between C1–O3 also accounts for a weak interaction between them. Typical covalent bonds between C1–O3 and C1–O4 were formed in the product complex, for both BCP(C1–O3) and BCP(C1–O4) have large charge density ρb, and large negative values of ∇2ρb and Hb. ∇2ρb of BCP(O4–Cu) was positive, and ρb(Cu–O4) was relatively small (Table S4†), so there was only a very weak closed shell interaction between the newly formed DMC and the Cu+ of the catalyst.
Conclusions
We have shown employing DFT calculations and AIM analysis that a Cu+ cation anchored to the framework oxygens of the zeolite with closed shell interactions during the whole reaction process. Decomposition of O2 readily occurs on the Cu site. The formed O atoms react with methanol to form (CH3O)(OH)–Cu(I)/β, in which CH3O and OH are coadsorbed on the Cu+ site of the catalyst. The (CH3O)(OH)–Cu(I)/β species then reacts with methanol and carbon monoxide to produce DMC, through two different reaction pathways. In path I, adsorption and insertion of carbon monoxide into the (CH3O)(OH)–Cu(I)/β lead to the formation of monomethyl carbonate species (MMC), which subsequent reacts with methanol to produce DMC and H2O. These results agree with experimental observation reported previously. In path II, the (CH3O)(OH)–Cu(I)/β species react with methanol to produce dimethoxide species (CH3O)(CH3O)–Cu(I)/β, and the formation of DMC is via the insertion of carbon monoxide into the (CH3O)(CH3O)–Cu(I)/β species. For both pathways, carbon monoxide insertion is the rate-determining step. Since the activation energies of this rate-determining step for both pathways are comparable, both pathways would competitively occur in the reaction course.Acknowledgements
The support of this work by the National Natural Science Foundation of China (20876112, 20936003), Specialized Research Fund for the Doctoral Program of Higher Education (SRFDP) (20090032110021) and the Program of Introducing Talents of Discipline to Universities (B06006) is gratefully acknowledged.References
- F. Rivetti, Green Chemistry: Challenging Perspectives, Oxford University Press, Oxford, 2001 Search PubMed.
- M.A. Pacheco and C. L. Marshall, Energy Fuels, 1997, 11, 2 CrossRef CAS.
- O. Yoshio, Appl. Catal., A, 1997, 155, 133 CrossRef.
- O. Yoshio, Catal. Today, 1997, 35, 15 CrossRef.
- S. A. Anderson and T. W. Root, J. Catal., 2003, 217, 396 CAS.
- S. A. Anderson and T. W. Root, J. Mol. Catal. A: Chem., 2004, 220, 247 CrossRef CAS.
- Y. Zhang, D. N. Briggs, E. de Smit and A. T. Bell, J. Catal., 2007, 251, 443 CrossRef CAS.
- Y. Zhang, I. J. Drake, D. N. Briggs and A. T. Bell, J. Catal., 2006, 244, 219 CrossRef CAS.
- I. J. Drake, Y. Zhang, D. Briggs, B. Lim, T. Chau and A. T. Bell, J. Phys. Chem. B, 2006, 110, 11654 CrossRef CAS.
- Y. Zhang and A. T. Bell, J. Catal., 2008, 255, 153 CrossRef CAS.
- M. Richter, M. J. G. Fait, R. Eckelt, M. Schneider, J. Radnik, D. Heidemann and R. Fricke, J. Catal., 2007, 245, 11 CrossRef CAS.
- M. Richter, M. J. G. Fait, R. Eckelt, E. Schreier, M. Schneider, M. M. Pohl and R. Fricke, Appl. Catal., B, 2007, 73, 269 CrossRef CAS.
- S. T. King, J. Catal., 1996, 161, 530 CrossRef CAS.
- S. T. King, Catal. Today, 1997, 33, 173 CrossRef CAS.
- X. Zheng and A. T. Bell, J. Phys. Chem. C, 2008, 112, 5043 CAS.
- J. P. Perdew, K. Burke and M. Ernzerhof, Phys. Rev. Lett., 1996, 77, 3865 CrossRef CAS.
- J. P. Perdew and Y. Wang, Phys. Rev. B: Condens. Matter, 1992, 45, 13244 CrossRef.
- R. F. W. Bader, Atoms in molecules: A quantum theory, Clarendon Press, Oxford and New York, 1990 Search PubMed.
- A. Hinchliffe, Chemical modelling: applications and theory, Royal Society of Chemistry, Great Britain, 2000 Search PubMed.
- R. F. W. Bader, Chem. Rev., 1991, 91, 893 CrossRef CAS.
- M. F. Zalazar and N. M. Peruchena, J. Phys. Chem. A, 2007, 111, 7848 CrossRef CAS.
- R. F. W. Bader and H. J. Essén, J. Chem. Phys., 1984, 80, 1943 CrossRef CAS.
- S. Jenkins and I. Morrison, Chem. Phys. Lett., 2000, 317, 97 CrossRef CAS.
- L. Barbosa and R. van Santen, Catal. Lett., 1999, 63, 97 CrossRef CAS.
- L. A. M. M. Barbosa and R. A. van Santen, J. Mol. Catal. A: Chem., 2001, 166, 101 CrossRef CAS.
- L. A. M. M. Barbosa, G. M. Zhidomirov and R. A. van Santen, Phys. Chem. Chem. Phys., 2000, 2, 3909 RSC.
- L. A. M. M. Barbosa, G. M. Zhidomirov and R. A. van Santen, Catal. Lett., 2001, 77, 55 CrossRef CAS.
- M. V. Frash and R. A. van Santen, Phys. Chem. Chem. Phys., 2000, 2, 1085 RSC.
- S. A. McMillan, R. Q. Snurr and L. J. Broadbelt, Microporous Mesoporous Mater., 2004, 68, 45 CrossRef CAS.
- M. J. Rice, A. K. Chakraborty and A. T. Bell, J. Phys. Chem. B, 2000, 104, 9987 CrossRef CAS.
- A. A. Shubin, G. M. Zhidomirov, V. B. Kazansky and R. A. van Santen, Catal. Lett., 2003, 90, 137 CrossRef CAS.
- A. A. Shubin, G. M. Zhidomirov, A. L. Yakovlev and R. A. van Santen, J. Phys. Chem. B, 2001, 105, 4928 CrossRef CAS.
- G. M. Zhidomirov, A. A. Shubin, V. B. Kazansky and R. A. Van Santen, Int. J. Quantum Chem., 2004, 100, 489 CrossRef CAS.
- A. Chatterjee and T. Iwasaki, J. Phys. Chem. A, 1999, 103, 9857 CrossRef CAS.
- Y. Wang, D. Zhou, G. Yang, S. Miao, X. Liu and X. Bao, J. Phys. Chem. A, 2004, 108, 6730 CrossRef CAS.
- E. Pidko and V. Kazansky, Phys. Chem. Chem. Phys., 2005, 7, 1939 RSC.
- L. A. M. M. Barbosa and R. A. van Santen, J. Phys. Chem. B, 2003, 107, 14342 CrossRef CAS.
- L. A. M. M. Barbosa and R. A. van Santen, J. Phys. Chem. B, 2003, 107, 4532 CrossRef CAS.
- L. A. M. M. Barbosa, R. A. van Santen and J. Hafner, J. Am. Chem. Soc., 2001, 123, 4530 CrossRef CAS.
- M. J. Rice, A. K. Chakraborty and A. T. Bell, J. Catal., 2000, 194, 278 CrossRef CAS.
- L. Benco, T. Bucko, J. Hafner and H. Toulhoat, J. Phys. Chem. B, 2005, 109, 20361 CrossRef CAS.
- V. D. Dominguez-Soria, P. Calaminici and A. Goursot, Theoretical study of the structure and properties of Na-MOR and H-MOR zeolite models, in Studies in Surface Science and Catalysis, ed. P.M. Antoine Gédéon and B. Florence, Elsevier, 2008, pp. 717 Search PubMed.
- D. Zhou, Y. Bao, M. Yang, N. He and G. Yang, J. Mol. Catal. A: Chem., 2006, 244, 11 CrossRef CAS.
- A. Rattanasumrit and V. Ruangpornvisuti, J. Mol. Catal. A: Chem., 2005, 239, 68 CrossRef CAS.
- C.-Y. Sung, L. J. Broadbelt and R. Q. Snurr, Catal. Today, 2008, 136, 64 CrossRef CAS.
- L. Kang, W. Deng, K. Han, T. Zhang and Z. Liu, Int. J. Hydrogen Energy, 2008, 33, 105 CrossRef CAS.
- B. L. Trout, A. K. Chakraborty and A. T. Bell, J. Phys. Chem., 1996, 100, 4173 CrossRef CAS.
- M. H. Groothaert, K. Pierloot, A. Delabie and R. A. Schoonheydt, Phys. Chem. Chem. Phys., 2003, 5, 2135 RSC.
- A. Delabie, K. Pierloot, M. H. Groothaert, B. M. Weckhuysen and R. A. Schoonheydt, Microporous Mesoporous Mater., 2000, 37, 209 CrossRef CAS.
Footnote |
| † Electronic supplementary information (ESI) available. See DOI: 10.1039/c2ra20480k |
| This journal is © The Royal Society of Chemistry 2012 |
