DOI:
10.1039/C2RA20394D
(Paper)
RSC Adv., 2012,
2, 5178-5184
Received
5th March 2012
, Accepted 7th March 2012
First published on 8th March 2012
Abstract
Mesoporous MCM-41 was functionalized using magnesium nitrate hexahydrate (denoted as MM). The adsorption behavior of Cd2+ on functionalized MCM-41 was investigated systematically. The adsorption isotherms of MM for Cd(II) could be described by the Langmuir isotherm model. The adsorption rates were very high and agreed well with pseudo second-order kinetics. The modified MCM-41 adsorbent displayed excellent Cd2+ adsorption efficiency (210.96 mg g−1) and the residual concentration of Cd2+ achieved was in line with drinking water quality standards. The regeneration capacity maintained 99% performance when the initial solution concentration was 5 mg L−1 (5000 ppb) at the eighth cycle, meeting the safe regulatory discharge standard for the first time. Furthermore, regeneration by an ultrasonic cleaning method to remove residual surface Cd2+ can reduce both the cost of traditional desorption agents and damage to the structure of the adsorbent. Therefore, the adsorbent MM has potential as a promising application in the field of water pollution control.
Introduction
Heavy metal pollution in wastewaters is an extremely serious environmental problem. Most heavy metals released into waters are strongly retained and their adverse effects can last for a long time.1 Cadmium contamination is a common co-occurrence in many contaminated environments, including mining areas, soils and sediments.2 Therefore, various technologies and processes have been applied over the years to the elimination of cadmium(II) ions from aqueous solutions including biological treatments, membrane processes, advanced oxidation processes, and chemical and electrochemical techniques. And adsorption procedures are the most widely used methods for removing heavy metal ions from industrial effluents because of their economic advantages, high efficiency and applicability.3 However, they are ineffective for reducing heavy metal concentrations to the low levels required by water quality standards, and the generation of a voluminous toxic waste sludge is a major problem. The adsorption process has received much attention, especially for wastewaters that contain low concentrations of metal and other hazardous substances. The use of low-cost adsorbents and various minerals has been investigated.4–11 However, the efficiency and selectivity of these solid supports are quite low, and improved metal absorbents have been prepared using functional groups anchored to the surface of suitable supports. The following types of functionality have been used: polymer,12 amino,13 tetraborate14 and goethite.15
Some researchers report that metal oxides are the single most important determinant of trace metal adsorption, while others report that organic materials exert a strong effect. Among the main components in surface coatings, manganese oxides, iron oxides and organic materials are recognized as the three most important components affecting the adsorption of trace metals on the solid phase.16 Hence, studies have mainly focused on the adsorption mechanism of trace metals.
Here we report on the synthesis of a novel hybrid mesoporous material based on MCM-41. MCM-41 was used as a matrix for surface modification. The adsorption properties of the modified materials were investigated using a batch method. The effects of various parameters – contact time, pH and temperature – on the removal of Cd2+ were studied in detail. The adsorbent MM displayed the best Cd2+ adsorption efficiency among all the adsorbents tested. This result was attributed to the MgO groups in the framework of the adsorbents combining with Cd2+ and improving the adsorption capacity toward Cd2+. The maximum adsorption capacity of MM for Cd2+ was found to be 210.96 mg g−1 at room temperature and the adsorption capacity for Cd2+ was sufficient to reduce the residual concentration of Cd2+ to drinking water standards. Adsorption cycles were repeated eight times using the same MM adsorbent and the residual concentration of Cd2+ in the solution remained <50 ppb when the initial solution concentration was 5 mg L−1 (5000 ppb). Compared with the acid regeneration method,17–19 regeneration by washing with deionized water only under ultrasonic conditions to remove residual surface Cd2+ can reduce the cost of traditional desorption agents, such as nitric acid, and reduce damage to the functional groups of the adsorbent, and hence prolong the life of the adsorbent.
Experimental
Synthesis of adsorbents
Mesoporous MCM-41 was purchased from Tianjin Chemist Technology Development Co. Ltd., China. Magnesium nitrate hexahydrate, calcium nitrate hexahydrate and barium nitrate hexahydrate were dissolved in deionized water to prepare the respective solutions. These solutions were mixed with MCM-41, and the mixtures agitated at room temperature (298 K) for 1 h to impregnate MCM-41 with the metal ions. The functional MCM-41 products were then rapidly rinsed with de-ionized water, dried in an oven for 3 h at 393 K and calcined in air at 973 K for 3 h. The metal-grafted MCM-41s are referred to as MM, CM, and BM, respectively.
Characterization
Powder X-ray diffraction spectra were collected using a Bruker D8 focus diffractometer, with Cu Kα radiation at 40 kV and 40 mA between 3° and 80° (2θ) with a step length of 1 s. Nitrogen adsorption–desorption isotherms of samples at 77 K were measured using a BEL-MINI adsorption analyzer. The surface area was calculated using a multipoint Brunauer–Emmett–Teller (BET) model. The pore size distribution was obtained via the BJH model using the desorption isotherms, and the total pore volume was estimated at a relative pressure of 0.99, assuming full surface saturation by nitrogen. The amounts of impregnated magnesium, calcium and barium were determined using AAS (TAS-990), respectively, after dissolving MM, CM and BM in HCl solution.
Cd2+ adsorption data from aqueous solutions were obtained using the immersion method. The stock solution of Cd2+ was prepared using deionized water. The experiments were performed in a temperature-controlled water bath shaker, for the given contact time, at a mixing speed of 180 rpm. The effects of contact time, temperature and pH on adsorption data were determined by changing the adsorption conditions. The initial pH of the solution was adjusted by the addition of 12 mol L–1 HCl solution as needed. On completion of the adsorption process, the adsorbent was filtered and then washed with deionized water. The residual concentration of Cd2+ was then determined using AAS. Finally, regeneration of the adsorbent by an ultrasonic cleaning method was also investigated. The percentage removal of Cd2+ was calculated according to the following equation:| |  | (1) |
The adsorption amount (Qe) was calculated according to the following equation:
| |  | (2) |
Where Qe (mg g−1) represents the adsorption amount, V (L) represents the volume of the Cd2+ solution, C0 (mg L−1) and Ce (mg L−1) represent the initial and equilibrium liquid phase concentrations of Cd2+, respectively, and m is the mass (g) of absorbent used in the experiments.
Results and discussion
Characterization of the adsorbents
The typical diffraction peaks of magnesium oxide, calcium oxide and barium oxide are clearly visible in Fig. 1. All peaks of the samples are close to the values reported in the Joint Committee on Powder Diffraction Standards (JCPDS) card no. 77-2364, card no. 77-2010 and card no. 74-1228, which indicate the formation of bulk magnesium oxide, calcium oxide and barium oxide. To observe the peaks of the products more clearly, 20 wt% supported magnesium nitrate, calcium nitrate and barium nitrate were synthesized. The functional groups, alkaline earth metal oxides, had been loaded onto the surface of MCM-41.
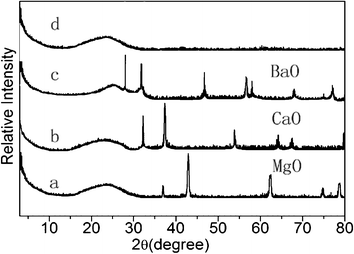 |
| | Fig. 1 The XRD patterns of (a) MM, (b) CM, (c) BM, (d) MCM-41. | |
The porosities calculated from the nitrogen adsorption–desorption data are listed in Table 1. We found that the BET surface area and total pore volume decreased somewhat after functionalization. This was because of the formation of metal oxides, which made the silica gel pore size smaller – some pores even disappeared. These results showed that functional groups were successfully loaded onto the MCM-41 surface. We also found that MM had the highest BET surface area and total pore volume, and BM had the lowest BET surface area and total pore volume. The reason for this is that the barium oxide molecules, which exist mainly in the mesopores, are the largest of the three metal oxide molecules in diameter; magnesium oxide has the smallest molecule diameter.
Table 1 Structural parameters of the samples
| Adsorbent |
BET surface area (m2 g–1) |
Total pore volume (cm3 g–1) |
| MCM-41 |
834.9 |
0.92 |
| MM |
648.5 |
0.71 |
| CM |
586.4 |
0.67 |
| BM |
508.7 |
0.58 |
Adsorption performance of different adsorbents
MO (M = Mg, Ca and Ba) groups in the adsorbents provided the effective adsorption sites. As indicated in Fig. 2, when the initial concentration of cadmium(II) ions was 250 ppm, the Cd2+ adsorption capacity increased gradually with increasing loading of metal oxides. When the same loading of different metal oxides was used, the Cd2+ adsorption capacity of MM (functionalized using magnesium nitrate) was better than those of CM and BM. The reason is that MgO has the smallest diameter among the three alkaline-earth metal oxides, and MM had the highest BET surface area and total pore volume, as shown in Table 1; therefore, the effect in Cd2+ adsorption was more evident. In addition, the adsorption capacity of MM increased until the loading of metal oxides reached 11 wt%. However, the calculated adsorption capacity of Cd(II) ions decreased when the MgO loading was further increased to 12 wt%. The reason is that the suitable loading of metal oxides is vital to the Cd2+ adsorption capacity; channel blocking by MgO molecules is the most likely cause of the reduction of heavy metal adsorption, as illustrated in Fig. 3.
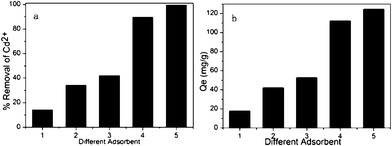 |
| | Fig. 2 The adsorption capacity of different adsorbents. (a) The percentage removal of Cd2+ of different adsorbents. (b) The adsorption amount of different adsorbents. (1) MCM-41, (2) Activated carbon, (3) BM, (4) CM, (5) MM (adsorption conditions: pH = 7, temperature = 298 K, contact time = 2 h, initial Cd2+ concentration = 250 mg L–1, adsorbent dose = 2 g L–1). | |
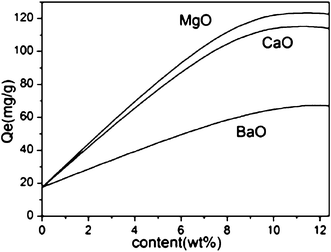 |
| | Fig. 3 Effect of different concentrations of modifier (adsorption conditions: initial Cd2+ concentration = 250 ppm, contact time = 2 h, pH = 7, temperature = 298 K, adsorbent dose = 2 g L–1). | |
As shown in Fig. 4, when the initial concentration of Cd2+ was 45 ppm, the Cd2+ adsorption capacity of MM was better than that of Mg–AC,20 which showed that pore structure plays an important role in the adsorption process. MCM-41 has a high surface area and a large pore volume, with highly ordered, hexagonally packed cylindrical pores.21 Activated carbon has a very wide range of pore sizes, from the Ångstrom scale of micropores to the micrometer scale of macropores.22 Although the Cd2+ adsorption capacity of MCM-41 is lower than that of activated carbon, when functional groups were loaded onto the MCM-41 and activated carbon surfaces, respectively, some pores of activated carbon even disappeared, which reduced the Cd2+ adsorption capacity. As a result, the adsorption capacity of MM for Cd2+ is higher than that of activated carbon. We also found that MM improved the cadmium(II) ions adsorption capacity through a cooperative effect related to the pores of the MCM-41; the MgO groups in pores have more freedom and accessibility to metal ions, as indicated by Fig. 5.
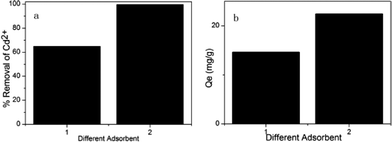 |
| | Fig. 4 The adsorption capacity of different adsorbents. (a) The percentage removal of Cd2+ of different adsorbents. (b) The adsorption amount of different adsorbents. (1) AC–Mg, (2) MM (adsorption conditions: initial Cd2+ concentration = 45 ppm, contact time = 2 h, pH = 7, temperature = 298 K, adsorbent dose = 2 g L–1). | |
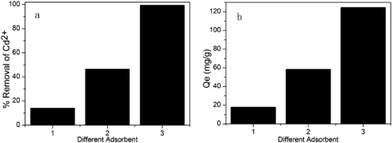 |
| | Fig. 5 The adsorption capacity of different adsorbents. (a) The percentage removal of Cd2+ of different adsorbents. (b) The adsorption amount of different adsorbents. (1) MCM-41, (2) MgO, (3) MM (adsorption conditions: initial Cd2+ concentration = 250 ppm, contact time = 2 h, pH = 7, temperature = 298 K, adsorbent dose = 2 g L–1). | |
These results prove that the MO groups in the adsorbent are the effective adsorption sites and that increasing the number of functional groups increases the Cd2+ adsorption capacity of the modified MCM-41. It is suggested that the dominant mechanism involved in Cd2+ sorption on MM is precipitation of Cd(OH)2, the OH− ions of which are supplied from the dissociation of Mg(OH)2 formed on the surface of MgO particles. The pH of the region near the surface of the material is considered to be higher than that of the bulk solution because the dissociation rate of Mg(OH)2 formed on the surface of MgO particles is low. High pH (OH− concentration) in the region near the material surface is favorable for Cd2+ to precipitate on the material surface as hydroxide, even if the pH of the bulk solution is lower than that at which Cd(OH)2 starts to precipitate (calculated from the Ksp of Cd(OH)2). Precipitation of Cd(OH)2 is more likely to occur in the region near the MCM-41 surface than in the bulk solution (Scheme 1).
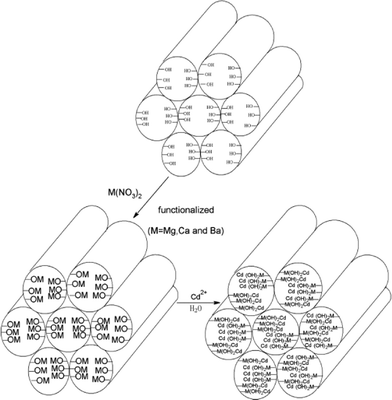 |
| | Scheme 1 Schematic mechanism for Cd2+ absorption. | |
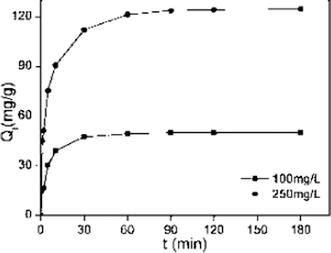 |
| | Fig. 6 Adsorption kinetics data for adsorption of Cd2+ on MM (adsorption conditions: adsorbent dose = 2 g L–1, pH = 7, temperature = 298 K, contact time = 2 h). | |
Pseudo first-order rate expression:
| |  | (3) |
Pseudo second-order rate expression:
| |  | (4) |
Where Q0 is the equilibrium adsorption capacity (mg g−1), Qt is the adsorption capacity over time, k1 is the pseudo first-order rate constant (min−1), k2 is the pseudo second-order rate constant (g (mg min)−1). As shown in Table 2, linear relationships were better developed for MM using the pseudo second-order rate expression. The values of different parameters determined from pseudo second-order and pseudo first-order kinetic models for Cd2+ and their corresponding correlation coefficients are presented in Table 2. The linear correlation coefficient obtained from the pseudo first-order model was not very good, and the calculated equilibrium adsorption capacity Q01 (cal) differed from the actual value, indicating that the adsorption is not pseudo first-order kinetics. It is also clear from Fig. 7a that the pseudo first-order model is not suitable to describe the kinetic profile because of the apparent lack of linear behavior. Conversely, rates of aqueous Cd(II) adsorption over MM material were accurately described by the pseudo second-order equation, as shown in Fig. 7b, in which experimental t/Qt and t data are provided, along with linear correlations for one set of experiments. The linear correlation coefficient, R2, was 0.999 and the calculated equilibrium adsorption capacity Q02 (cal) was very close to the actual Q0 (exp), showing that this model is better in explaining the adsorption kinetics of Cd2+ on MM.
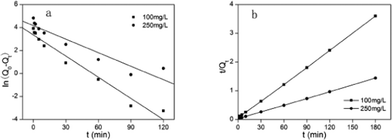 |
| | Fig. 7 (a) Pseudo first-order kinetic plots for the adsorption of Cd2+ on MM. (b) Pseudo second-order kinetic plots for the adsorption of Cd2+ on MM. | |
Table 2 Fitting parameters for Cd2+ adsorption on MM
|
C
0 (mg L–1) |
Q
0(exp) (mg g–1) |
Pseudo first-order |
Pseudo second-order |
|
Q
01(cal) (mg g–1) |
k
1 (min−1) |
R
2
|
Q
02(cal) (mg g–1) |
k
2 (g mg−1 min−1) |
R
2
|
| 100 |
49.94 |
49.88 |
0.133 |
0.984 |
49.96 |
0.008 |
0.999 |
| 250 |
124.72 |
124.28 |
0.141 |
0.949 |
124.66 |
0.006 |
0.999 |
The adsorption isotherms of Cd2+ on MM were studied at three different temperatures (298, 308, and 318 K) to investigate the effect of temperature. As shown in Fig. 8, all of the adsorption isotherms were nonlinear, with curves concave to the abscissa. Each adsorption isotherm initially exhibits a very steep increase, which indicates high-energy adsorption sites, favoring strong adsorption at low equilibrium concentrations.
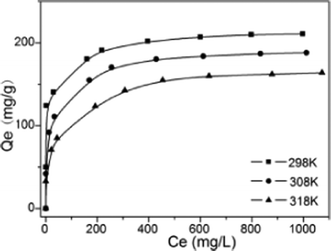 |
| | Fig. 8 Adsorption isotherm data for adsorption of Cd2+ on MM at different temperatures (adsorption conditions: adsorbent dose = 2 g L–1, contact time = 2 h, pH = 7). | |
To describe the adsorption isotherm more scientifically, the Langmuir and Freundlich model equations were selected for use in this study. The Langmuir adsorption isotherm has been successfully applied to many pollutant adsorption processes from aqueous solution. It is commonly represented as:
| |  | (5) |
Where Qe represents the equilibrium adsorption capacity of Cd2+ on the adsorbent (mg g−1), Ce represents the equilibrium concentration in solution (mg L−1), Q0 represents the maximum monolayer capacity of adsorbent (mg g−1) and KL represents the Langmuir adsorption constant (L mg−1) related to the free energy of adsorption. The Freundlich isotherm is an empirical equation describing adsorption on a heterogeneous surface. The common form is:
| |  | (6) |
Where KF (mg g−1 (L mg−1)1/n) and 1/n represent the Freundlich constants corresponding to adsorption capacity and adsorption intensity, respectively. The Langmuir and Freundlich model parameters and linear regression correlations obtained from curve fitting are given in Table 3. It can be seen that linear regression correlations using the Langmuir model were better than those for the Freundlich isotherm for Cd2+, which suggests that the Langmuir model better describes the adsorption of Cd2+ on MM. These results indicated that the adsorption is of a typical monomolecular-layer form. Moreover, the values for 1/n obtained from the Freundlich model were all <1, which is indicative of high adsorption intensity between Cd2+ and the adsorbent.
Table 3 Parameters of adsorption model at different temperatures (MM)
|
T (K) |
Langmuir model |
Freundlich model |
|
Q
0 (mg g–1) |
K
a (L mg–1) |
R
2
|
K
F[mg g–1 (L mg–1)1/n] |
1/n |
R
2
|
| 298 |
210.96 |
0.249 |
0.994 |
33.381 |
0.502 |
0.948 |
| 308 |
186.12 |
0.212 |
0.993 |
32.923 |
0.433 |
0.932 |
| 318 |
164.42 |
0.167 |
0.996 |
32.752 |
0.375 |
0.916 |
The monolayer capacity Q0 of Cd2+ on MM at 298 K (210.96 mg g−1), 308 K (186.12 mg g−1) and 318 K (164.42 mg g−1), respectively, was calculated based on the Langmuir isotherm (Fig. 8). As expected, the maximum adsorption capacity decreased with increasing temperature, indicating that the adsorption process is exothermic (Table 4).
Table 4 Thermodynamic data for adsorption of Cd2+ on MM
|
T (K) |
K
L (L mol–1) |
ΔH (kJ mol−1) |
ΔS (J mol−1 K−1) |
ΔG (kJ mol−1) |
| 298 |
27888 |
−15.69 |
32.42 |
−25.35 |
| 308 |
23774 |
−15.69 |
32.42 |
−25.79 |
| 318 |
18704 |
−15.69 |
32.42 |
−25.99 |
Thermodynamic studies
Using the following equations, the thermodynamic parameters of the adsorption process were determined from the experimental data:
Van't Hoff equation:
| |  | (7) |
Gibbs free energy equation:
Where KL is the distribution coefficient for the adsorption; ΔS, ΔH and ΔG are the changes in entropy, enthalpy and the Gibbs energy, respectively; T (K) is the temperature; R (J mol−1 K−1) is the gas constant; Qe is the equilibrium adsorbate concentration in the aqueous phase (mg g−1); and Ce is the equilibrium concentration in solution (mg L−1). The values of ΔH and ΔS were determined from the slopes and intercepts of the plots of ln KLversus 1/T (as illustrated in Fig. 9), when measured under the same experimental conditions. As expected, the maximum adsorption capacity decreased with an increase in temperature, indicating that the adsorption process is exothermic (Table 4).
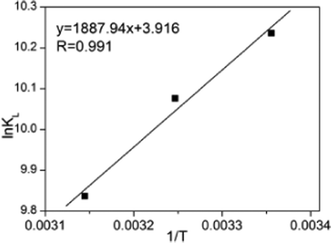 |
| | Fig. 9 Plot of ln KLvs. (1/T) MM. | |
Effect of pH on Cd2+ adsorption
In practical industrial processes, wastewater may be acidic or alkaline, and may contain many contaminants other than cadmium(II) ions. The pH of a solution is one of the most important parameters in the adsorption process. To investigate the effect of pH on the adsorption performance of Cd2+, aqueous solutions were prepared with different pH values, ranging from 1 to 7. As illustrated in Fig. 10, the pH value clearly has a considerable influence on the adsorption capacities of MM. The adsorption capacity was highest at pH 7, and the adsorption capacity for Cd2+ ions clearly decreased with decreasing pH. The significant impact of solution pH on Cd2+ uptake could be explained by changes in both the MgO in the adsorbents and aqueous Cd2+ speciation. In acidic solution, Cd2+ has lower affinity for Mg(OH)2, causing a decrease in Cd2+ adsorption capacity. In addition, at low pH values, the concentration of H+ at the surface is much higher. The large amount of H+ reacted with MgO, and hence the adsorption capacity decreased with decreasing pH. In acid medium, the competition between ion metals and protons causes weak adsorption, and in basic medium, H3O+ can strongly compete with positive metal ions for the adsorption sites.
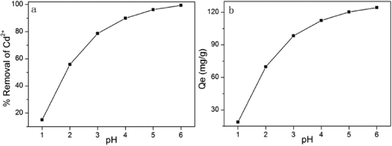 |
| | Fig. 10 Effect of pH on the adsorption of Cd2+ onto MM. (a) The percentage removal of Cd2+ of different pH. (b) The adsorption amount of different pH (adsorption conditions: initial Cd2+ concentration = 250 mg L–1, adsorbent dose = 2 g L–1, contact time = 2 h, temperature = 298 K). | |
Regeneration
We designed a new regeneration method termed an ultrasound regeneration method. In this method, the sorbed Cd2+-loaded samples were placed in deionized water, followed by ultrasonic cleaning for 1 h, and then filtered with deionized water. It is worth noting that MM regeneration via our ultrasound regeneration method is applicable for an initial concentration of Cd2+ ions of 5000 ppb (5 mg L−1); 99% of the adsorption capacity of recycled MM could be maintained, and a residual concentration of Cd2+ <50 ppb (50 ng mL−1) (below regulatory safe discharge standards) could be obtained at the eighth cycle. The adsorption capacity of cadmium(II) ions was sufficient to reduce the residual concentration of Cd2+ to drinking water standards (5 ng mL−1), as indicated in Fig. 11. This result may be explained by a superimposed dynamic process at the microscopic level. Localized areas of high temperature and pressure are generated in the fluid. The former would make the temperature of the system increase slightly and the latter would cause microjets of solvent to be formed perpendicular to the solid surface. In addition, shockwaves are produced as the bubbles collapse, which have the potential of creating microscopic turbulence within interfacial films surrounding nearby solid particles (also referred to as micro streaming). As a result, the acoustic cavitation could produce not only high-speed microjets but also high-pressure shockwaves that impinge incessantly on the surface.23 This action leads to enhanced breaking of the bonds between the adsorbate and the adsorbent surface, and causes more cadmium(II) ions desorbed from the adsorbent to shift into the liquid phase. Simultaneously, the number of metal oxide groups decreases slightly because this ultrasound regeneration method can reduce the extent of structural damage to the adsorbents. Consequently, it is concluded that MM could be used to remove traces of cadmium(II) ions from wastewater in terms of high adsorption capacity and excellent regeneration capacity.
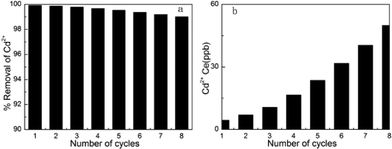 |
| | Fig. 11 (a) The percentage removal of Cd2+ of different cycles. (b) The equilibrium liquid phase concentrations of Cd2+ of different cycles. Regenerated use of MM adsorbent for the removal of Cd2+ (adsorption conditions: initial Cd2+ concentration = 5 mg L–1 (5000 ppb), contact time = 2 h, pH = 7, temperature = 298 K). | |
Conclusions
The adsorption kinetics of Cd2+ showed that the adsorption rates on MM were very high and in good agreement with pseudo second-order kinetics. The adsorption isotherm fitted the Langmuir model well and the maximum adsorption capacity of MM was 210.96 mg g−1.
The higher adsorption capacity of MM compared with DMDDA-41A (191.10 mg g−1),24 NH2-MCM-41 (18.25 mg g−1),25 SiO2–II (69.69 mg g−1),26 NH2-MCM-41 (79.80 mg g−1)27 and Cd(II)-EDDS-Lewatit MonoPlus MP 500 (116.58 mg g−1)28 may be attributable to the ability of Cd2+ to form covalent bonds with the MgO groups to coordinate heavy metal ions. This causes a significant enhancement in the capacity toward cadmium(II) ions. Furthermore, the presence of pore channels enhances the Cd2+ adsorption capacity of MgO groups. The pH has a major impact on Cd2+ adsorption. The adsorbent MM can be regenerated efficiently, which means that it can be used for at least eight cycles without significant change in adsorption capacity when the initial concentration of Cd2+ is 5000 ppb. Regeneration of the cadmium-loaded adsorbent was achieved under ultrasound conditions by washing with deionized water only. The adsorbent MM shows potential for application as an effective and economical adsorbent for the removal of low concentrations of Cd(II) from aqueous solutions.
Acknowledgements
The authors acknowledge financial support from the National Natural Science Foundation of China (Grant Nos. 21073098), the Natural Science Foundation of Tianjin (11JCZDJC21600), and the Research Fund for MOE (IRT-0927), the Doctoral Program of Higher Education (20090031110015), and the Program for New Century Excellent Talents in University (NCET-10-0481).
References
- M. Erdem and A. Ozverdi, Sep. Purif. Technol., 2006, 51, 240 CrossRef CAS.
- J. Liang, R. Xu, Y. Wang, A. Zhao and W. Tan, Chemosphere, 2007, 67, 1949 CrossRef CAS.
- D. Mohan and C. U. Pittman, J. Hazard. Mater., 2006, 137, 762 CrossRef CAS.
- I. F. Nata, M. Sureshkumar and C.-K. Lee, RSC Adv., 2011, 1, 625 RSC.
- J.-X. Wang, R.-S. Yuan, L.-Y. Xie, Q.-F. Tian, S.-Y. Zhu, Y.-H. Hu, P. Liu, X.-C. Shi and D.-H. Wang, RSC Adv., 2012, 2, 1112 RSC.
- Z. Zhu, X.-X. Yang, L.-N. He and W. Li, RSC Adv., 2012, 2, 1088 RSC.
- A. N. Modenes, F. R. Espinoza-Quinones, C. E. Borba, D. E. G. Trigueros, F. L. Lavarda, M. M. Abugderah and A. D. Kroumov, Water Sci. Technol., 2011, 64, 1857 CrossRef CAS.
- S. T. Ramesh, R. Gandhimathi, N. Badabhagni and P. V. Nidheesh, Environ. Eng. Manag. J., 2011, 10, 1667 CAS.
- H.-C. Ge and X.-H. Fan, Chem. Eng. Technol., 2011, 34, 1745 CrossRef CAS.
- P.-X. Wu, Q. Zhang, Y.-P. Dai, N.-W. Zhu, Z. Dang, P. Li, J.-H. Wu and X.-D. Wang, Geoderma, 2011, 164, 215 CrossRef CAS.
- S. Debnath and U. C. Ghosh, Desalination, 2011, 273, 330 CrossRef CAS.
- R.-H. Huang, B. Wang, B.-C. Yang, D.-S. Zheng and Z.-Q. Zhang, Desalination, 2011, 280, 297 CrossRef CAS.
- U. Wingenfelder, B. Nowack, G. Furrer and R. Schulin, Water Res., 2005, 39, 3287 CrossRef CAS.
- E. I. Unuabonah, K.-O. Adebowale, B. I. Olu-Owolabi and L.-Z. Yang, Hydrometallurgy, 2008, 93, 1 CrossRef CAS.
- W. Li, S.-Z. Zhang and X.-Q. Shan, Colloids Surf., A, 2007, 293, 13 CrossRef CAS.
- D.-M. Dong, Y. M. Nelson, L. W. Lion, M. L. Shuler and W. C. Ghiorse, Water Res., 2000, 34, 427 CrossRef CAS.
- C.-H. Xiong, C.-P. Yao, L. Wang and J.-J. Ke, Hydrometallurgy, 2009, 98, 318 CrossRef CAS.
- L. Xiong, C. Chen and J.-R. Nia, J. Hazard. Mater., 2011, 189, 741 CrossRef CAS.
- R. Laus and V. T. D. Favere, Bioresour. Technol., 2011, 102, 8769 CrossRef CAS.
- H. Yanagisawa, Y. Matsumoto and M. Machida, Appl. Surf. Sci., 2010, 256, 1619 CrossRef CAS.
- A. V. Neimark, P. I. Ravikovitch, M. Grün, F. Schüth and K. K. Unger, J. Colloid Interface Sci., 1998, 207, 159 CrossRef CAS.
- K. Nakagawa, S. R. Mukai, T. Suzuki and H. Tamon, Carbon, 2003, 41, 823 CrossRef CAS.
- L. H. Thompson and L. K. Doraiswamy, Ind. Eng. Chem. Res., 1999, 38, 1215 CrossRef CAS.
- A. Benhamou, M. Baudu, Z. Derriche and Z. P. Basly, J. Hazard. Mater., 2009, 171, 1001 CrossRef CAS.
- A. Heidari, H. Younesi and Z. Mehraban, Chem. Eng. J., 2009, 153, 70 CrossRef CAS.
- A. N. Vasiliev, L. V. Golovko, V. V. Trachevsky, G.-S. Hall and J. G. Khinast, Microporous Mesoporous Mater., 2009, 118, 251 CrossRef CAS.
- K. F. Lam, K. L. Yeung and G. Mckay, Environ. Sci. Technol., 2007, 41, 3329 CrossRef CAS.
- D. Kolodynska, Chem. Eng. J., 2011, 168, 994 CrossRef CAS.
|
| This journal is © The Royal Society of Chemistry 2012 |
Click here to see how this site uses Cookies. View our privacy policy here. 


