Improved electrochemical properties of single crystalline NiO nanoflakes for lithium storage and oxygen electroreduction
Suqin
Ci
ab,
Jianping
Zou
a,
Guisheng
Zeng
a,
Qiang
Peng
a,
Shenglian
Luo
*a and
Zhenhai
Wen
*ab
aKey Laboratory of Jiangxi Province for Ecological Diagnosis-Remediation and Pollution Control, Nanchang Hangkong University, Nanchang, 330063, Jiang Xi, China
bDepartment of Mechanical Engineering, University of Wisconsin-Milwaukee, 3200 North Cramer Street, Milwaukee, Wisconsin 53211, USA. E-mail: wenzhenhai@yahoo.cn; sllou@hnu.cn; Fax: 1-414-229-6958; Tel: 1-414-229 3370
First published on 27th March 2012
Abstract
A facile strategy has been developed to realize the controllable synthesis of single crystalline NiO nanoflakes. According to the SEM, TEM and BET analysis, it was found that the m-NiO nanoflakes have a hexagonal structure with an average pore diameter of 4.4 nm, and exhibit a high surface area of 113.4 m2 g−1 and a pore volume around 0.142 cm3 g−1. The m-NiO nanoflakes exhibit a significantly improved electrochemical performance as an anode of lithium-ion batteries (LIBs) compared with bulk NiO based on cyclic voltammograms and galvanostatic measurement. Additionally, the m-NiO nanoflakes showed remarkable advanced activity for catalyzing oxygen reduction reaction (ORR ) relative to the bulk NiO electrode and the bare electrode. Further, rotating disk electrodes demonstrated that the m-NiO nanoflakes, as the support of the Pt nanoparticles, shows significantly improved activity for ORRs.
Introduction
It is widely accepted that nanomaterials with porous structures would have greatly enlarged active surface areas and thus would lead to unusual electronic and robust transport features, which means that they have potential uses in various electrochemical applications and the related regions.1–3 Especially, materials with a two-dimensional (2D) nanostructure, such as graphene, have been reported to have numerous unexpected properties, for instance, electrons may obey a linear dispersion relation and behave less like relativistic particles, which may bring enhanced catalytic, optical and electrochemical properties.4,5 Unfortunately, for this research there are still several key issues which need to be addressed, especially for the controlled synthesis of 2D porous nanostructures and the investigation of their potential applications.3,6Nickel oxide (NiO), as an important transition metal oxide with a p-type semiconductor, has received large amounts of research interest and has been considered as one of the promising materials in fuel cells, advanced batteries, supercapacitors, dye-sensitized photocathodes, optics, and catalysis fields, etc.7–10 Therefore, it is highly desirable to develop a controllable and convenient method to fabricate unique NiO nanostructures and explore their functional properties.11–16 Previous studies on these NiO nanostructures suggest that the controlled growth of NiO nanocrystals usually leads to gradual changes in morphologies and crystal structures, and even alter the physical or chemical properties of the NiO nanocrystals.17,18 To get high quality nanocrystals and achieve porous nanostructures, one usually needs to modulate the growth dynamics of nanocrystals with a certain reaction system. For example, the synthesis of single crystalline NiO nanosheets could be prepared by hydrothermal treatment of nickel acetate and methylamine at a relatively low temperature. However, it is still a big challenge to realize the controlling of the morphology and porous structure if organic sources were not used in the system. 7
Herein, we reported a facile route to the controllable synthesis of single crystalline NiO mesoporous-flake nanostructures. The primary electrochemical measurement revealed that, in comparison with the bulk NiO, the mesoporous NiO (m-NiO) nanoflakes exhibited considerably improved electrochemical properties as both an anode of lithium ion batteries (LIBs) and as the electrocatalyst for oxygen reduction reaction (ORR).
Experimental
Materials and synthesis
All chemicals were of analytical grade from the Beijing Chemical Company, and were used without further treatment. Bulk NiO particles of sizes 10–20 μm were from Sigma. The NiO was prepared by a solvothermal method using an equal volume of alcohol and water as a mixed solvent. In a typical experiment, a quantity of CTAB was dissolved in 30 mL mixed solvent at room temperature to form a homogeneous and clear solution. 0.001 mol urea was then added into the solution under vigorous stirring. Afterwards, 0.005 mol nickel chloride (NiCl2) was slowly added to the above solution with vigorous stirring. The solution was then transferred to a 40 mL Teflon-lined stainless steel autoclave and heated at different temperatures for 5–15 h. The obtained precipitates were filtered and washed six times with distilled water and absolute alcohol to remove all soluble material. The products, after drying, were calcined at 450 °C for 5 h.The Pt nanoparticles were prepared using H2PtCl6 as the Pt source and ethylene glycol (EG) as the reducing agent. Typically, 10 mL 0.1 M H2PtCl6 was slowly dropped into 50 mL of EG under intense stirring. The mixed solution was refluxed in a flask at 110 °C under continuous stirring under a nitrogen atmosphere for 2 h. The Pt nanoparticles were then collected by centrifugation followed by washing with ethanol and deionized water, and drying 80 °C. For the synthesis of the m-NiO nanoflakes supported Pt nanoparticles (Pt/m-NiO nanoflakes), 40 mg m-NiO nanoflakes were dispersed in 1.0 mL ethanol solution under sonication, then 10 mg Pt nanoparticles were added to the mixture under vigorous stirring followed by sonicating for 1 h. Note: The mixture was used for preparing the Pt/m-NiO nanoflakes directly after adding 50 μL Nafion solution (5%).
Characterization
The morphologies of the as-prepared samples, together with selected-area electron diffraction (SAED), were obtained utilizing a Hitachi model H-800 transmission electron microscope (TEM) and a LEO 1530 scan electron microscope (SEM). Power X-ray diffraction (XRD) was performed on a Bruker D8-Advance X-ray powder diffractometer. Specific surface areas were measured at 77 K by Brunauer–Emmett–Teller (BET) nitrogen adsorption–desorption (Shimadzu, Micromeritics ASAP 2010 Instrument).Lithium ion battery measurements
A lithium pellet was utilized for both the counter and the reference electrodes. The working electrode was fabricated by compressing the mixture of active materials (80%), acetylene black (10%), and poly vinylidene fluoride (10%) as a binder dissolved in 1-methyl-2-pyrrolidinone solution onto a copper foil. The pellets were dried in vacuo at 120 °C for 5 h and were then assembled into the half battery in an Ar-filled glove box. Cyclic voltammograms (CVs) were recorded from 3.0 to 0.0 V at a scan rate of 0.1 mV s−1 using a CHI 802B electrochemical workstation. The electrolyte solution was 1 M LiPF6 dissolved in a mixture of ethylene carbonate (EC), dimethyl carbonate (DMC) with the volume ratio of EC![[thin space (1/6-em)]](https://www.rsc.org/images/entities/char_2009.gif) :
:![[thin space (1/6-em)]](https://www.rsc.org/images/entities/char_2009.gif) DMC = 1
DMC = 1![[thin space (1/6-em)]](https://www.rsc.org/images/entities/char_2009.gif) :
:![[thin space (1/6-em)]](https://www.rsc.org/images/entities/char_2009.gif) 1. Galvanostatic measurements were conducted using a Luhua battery tester system (Shenzhen) at room temperature. Discharge–charge curves were recorded at fixed voltage limits between 2.5 and 0.15 V at a current density of 200 mA g−1. Electrochemical impedance spectroscopy (EIS) measurements were also carried out at the open circuit voltage by applying an AC voltage of 5 mV amplitude over the frequency range from 100 kHz to 50 mHz.
1. Galvanostatic measurements were conducted using a Luhua battery tester system (Shenzhen) at room temperature. Discharge–charge curves were recorded at fixed voltage limits between 2.5 and 0.15 V at a current density of 200 mA g−1. Electrochemical impedance spectroscopy (EIS) measurements were also carried out at the open circuit voltage by applying an AC voltage of 5 mV amplitude over the frequency range from 100 kHz to 50 mHz.
Electrocatalysis measurements
Electrochemical measurements were carried out on a CHI 802B electrochemical workstation (CHI Inc., USA) by using Ag/AgCl electrode and platinum wire as the reference and the counter electrodes, respectively. Without special treatment, 0.5 M KOH solutions were used as the electrolyte in all electrocatalytic experiments. The working electrodes were prepared by a simple casting method, in which 5.0 μl bulk NiO or m-NiO nanoflakes turbid solution (0.5 mg ml−1) was pipetted onto the surface of a freshly polished glassy carbon (GC) electrode. The polarization curves for ORR were conducted through the rotating disk electrode (RDE) technique with a scan rate of 5 mV s−1 in 0.5 M KOH solution. The Pt nanoparticles and Pt/m-NiO nanoflakes (20% Pt) electrode were prepared through the same route to the above NiO electrode.Results and discussion
We carried out a series of experiments to study the influence of several parameters (e.g., concentration of CTAB, temperature, time) to the evolution of m-NiO nanoflakes. Fig. 1a–c presents the TEM images of the products obtained at 110 °C through adjusting the reaction time and concentration of CTAB respectively. First, one can find that the NiO with mixed nanostructures, namely the nanorods and nanoflakes structure, were obtained under these reaction conditions. Second, careful comparison of the samples with different CTAB concentration demonstrated that the nanorods seemed to be suppressed and the nanoflakes became the overwhelming majority with an increase of CTAB concentration. In addition, a longer period of reaction time tended to facilitate the formation of the porous structure after heat treatment at 450 °C for 5 h.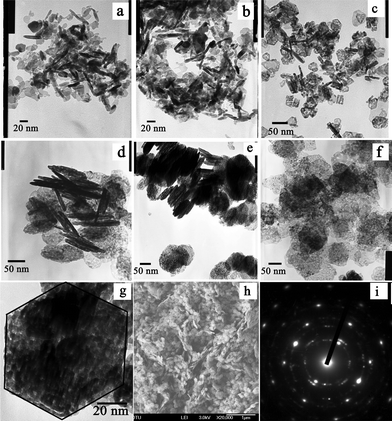 | ||
| Fig. 1 TEM images of the NiO series synthesized at different conditions. (a) 110 °C (0.01 M CTAB, 5 h); (b) 110 °C (0.02 M CTAB, 10 h); (c) 110 °C (0.01 M CTAB, 15 h); (d) 150 °C (0.02 M CTAB, 15 h), (e) 110 °C (0.03 M CTAB, 15 h); (f, g) 150 °C (0.03 M CTAB, 15 h); (h) SEM of the m-NiO nanoflakes; (i) SAED of the m-NiO nanoflakes. | ||
When the reaction temperature was tuned at 150 °C, the as-prepared NiO nanostructures were enlarged possibly due to the fast nucleation or growth processes induced by high temperature (Fig. 1d–f). The mixed morphologies (nanorods and nanoflakes) were also observed with low concentration of CTAB or short period of reaction time (Fig. 1d and 1e). Fig. 1f exhibits the TEM image of the products with “pure phase” m-NiO nanoflakes that obtained at 150 °C with 0.03 M CTAB for 15 h, suggesting that the m-NiO nanoflakes have a size range of 50–100 nm and uniform porous structures. Through the observation of magnified TEM image, it was found that most of the NiO nanoflakes possessed a hexagonal shape with crystalline size of around 5.8 nm and unspecified porous structure (Fig. 1g). Fig. 1h displays the SEM image of the m-NiO nanoflakes, further confirming that the as-prepared m-NiO nanoflakes have a uniform size and flake morphology. Selected area electron diffraction (SAED) proves that the mesoporous NiO nanoflakes had a single crystalline (Fig. 1i).
According to the controlled conditions experiments, a possible mechanism was proposed to explain the formation of m-NiO nanoflakes. At first, the hydrolysis of urea would slowly release OH− under solvothermal conditions; then, Ni(OH)2 would be formed when the Ni2+ met with the produced OH− from hydrolysis of urea through the organization between these ions and the surfactant CTAB. After heat treatment at 450 °C, the NiO nanoflakes with disordered porous structures were formed, attributing to the removal of CTAB and the dehydration reaction. All of the reactions involved during the processes are as following:
| CO(NH2)2 + 3H2O → 2OH− + 2NH4+ + CO2 | (1) |
| 2OH− + Ni2+ →Ni(OH)2 | (2) |
| Ni(OH)2 → NiO + H2O | (3) |
Fig. 2a shows the powder X-ray diffraction pattern of the m-NiO nanoflakes. Three broad peaks at 2θ = 37.2°, 43.2° and 62.6° can be assigned to (111), (200), (220) planes, respectively, which can be well indexed as the cubic structures of NiO with a cell parameter of a = 4.177 Å (JCPDS no. 47–1049). The NiO nanocrystalline size was evaluated to be 6.3 nm based on the Scherrer formula, which was basically consistent with the above TEM result. The low-angle XRD pattern (Fig. 2b) shows at least 2 diffraction peaks, one broad diffraction peak in the range of 0.7–1.0° (2θ) was present in the low-angle region, and another peak centered at around 1.5° (2θ), confirming that the m-NiO nanoflakes possess mesovoids without long-range orders. The nitrogen isotherm curve of the m-NiO nanoflakes through N2 adsorption measurements is shown in Fig. 2c, which exhibits the type IV isotherm with a distinct hysteresis loop in the range of 0.5 to 0.9 P/P0. According to the IUPAC nomenclature, such a characteristic indicates the different processes between adsorption and desorption from the mesopores. Based on the report of nitrogen adsorption–desorption, the m-NiO nanoflakes exhibit a BET surface area of 113.4 m2 g−1 and a total pore volume of 0.142 cm3 g−1. Pore size distribution was also investigated by using the BJH (Barrett–Joyner–Halenda) method to analyze the pore structures of the as-prepared m-NiO nanoflakes, as presented in Fig. 2d, the peak of the pore size were centered at around 4.4 nm, indicating that the m-NiO nanoflakes have an average pore diameter of 4.4 nm.
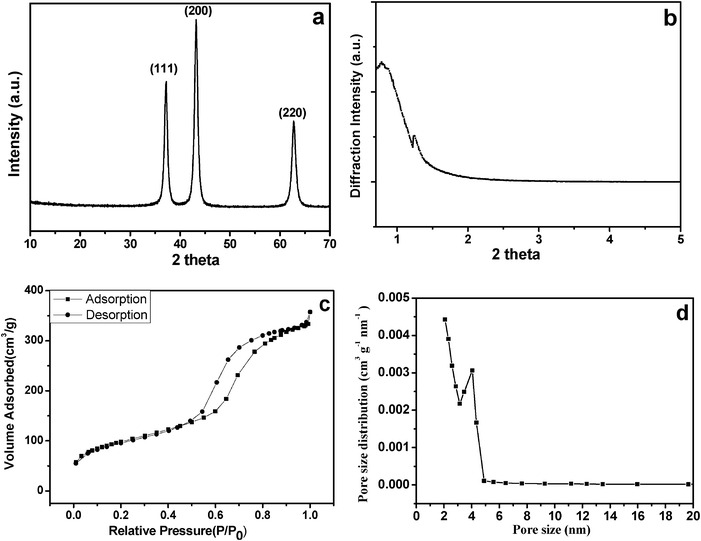 | ||
| Fig. 2 X-ray diffraction patterns (a) and small angle X-ray diffraction patterns (b) of the m-NiO nanoflakes; nitrogen adsorption–desorption isotherms (c) and pore size distribution curve (d) of the m-NiO nanoflakes. | ||
Li-ion batteries (LIBs) have extensively been applied in portable electronic products due to their high energy density and excellent cycle life. 19–21 Nanomaterials could be a promising candidate as they exhibit higher capacity and improve rate capability, attributing to the short diffusion lengths of the lithium ions, large material/electrolyte contact area and good strain accommodation. 7,21–23 Therefore, it is highly interesting to investigate the electrochemical properties of the m-NiO nanoflakes for lithium storage. 15,24,25
Cyclic voltammograms (CVs) were firstly carried out to compare the electrochemical properties of the bulk NiO and m-NiO nanoflakes as an anode in LIBs. Fig. 3a and 3b display the initial two CVs for the bulk NiO and m-NiO nanoflakes, respectively. Generally, the CV curves are consistent with those reported previously. 11 On one hand, there are two cathodic peaks at around 2.0 V and below to 0.3 V in the first scan, corresponding to the formation of solid electrolyte interface (SEI) and the reduction of NiO to Ni, and during the anodic scan, there two anodic peaks appear at 2.25 V and 0.65 V that indicate the decomposition of Li2O and the electrolyte. On the other hand, there is a pronounced decrease of cathodic current between the first and the second CV in both electrodes, which was also observed in previous NiO-based anode and can be attributed to the irreversible reaction and the formation of SEI layer. Obviously, the m-NiO nanoflakes manifest smaller changes in comparison with the bulk NiO, implying that less capacity is lost in the initial two cycles. Eqn (4)–(5) below describe the possible reaction involved during the processes:
| 2Li+ + 2e− + NiO ↔ Li2O + Ni | (4) |
| 2Li ↔ 2Li+ + 2e− | (5) |
| 2Li + NiO ↔ Li2O + Ni | (6) |
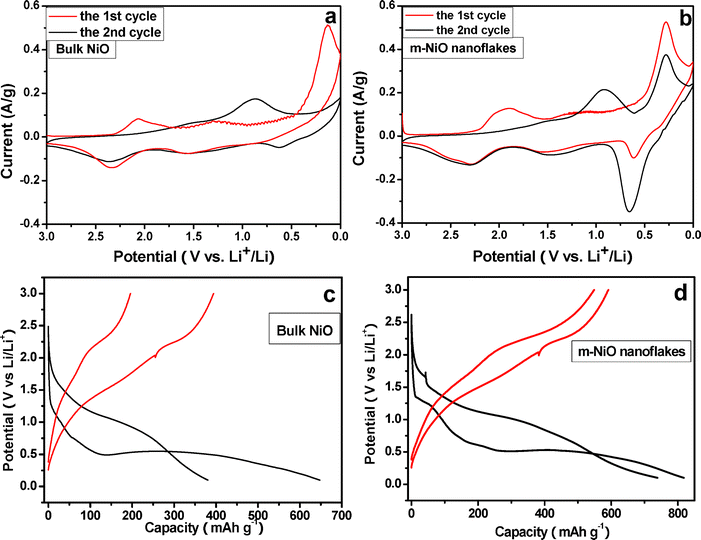 | ||
| Fig. 3 The initial two cyclic voltamograms of (a) bulk NiO, (b) m-NiO nanoflakes conducted at a sweep rate of 0.1 mV s−1. The first and second charge–discharge profiles for (c) bulk NiO and (d) m-NiO nanoflake LIB anodes at a current density of 50 mA g−1. | ||
The lithium storage capacity and cyclability were further examined by using galvanostatic charge/discharge cycling method at a current density of 200 mA g−1. As consistent with the CVs results, the initial two charge/discharge curve change significantly, both the potential of the plateau and the capacity show remarkable difference between the first and the second discharge curve (Fig. 3c, d).
Fig. 4 compares the cycling performance and rate capability of the bulk NiO and m-NiO nanoflakes. As expected, the m-NiO nanoflakes behave a significantly improved performance in terms of the capacity, rate capability and stability. First of all, the m-NiO nanoflakes display a capacity of 817.8 mA h g−1 in the first discharge process, this capacity is much higher than that of bulk NiO (647.6 mA h g−1). In addition, the initial capacity loss is about 10.8% in m-NiO nanoflakes, while the bulk NiO shows a distinct fade of discharge capacity in the initial two cycles (around 50% loss). Although the discharge capacity gradually decreased in the subsequent cycling, the m-NiO nanoflakes discharged a capacity of 411.6 mA h g−1 after 20 cycles, which is larger than the theoretical specific capacity of the commercial graphite anode material. However, for the bulk NiO only a capacity of 99.7 mA h g−1 was delivered after 20 cycles. The reversible capacity decreased slowly with increasing current density to 80 mA g−1. Even at a high rate of 100 mA g−1, the m-NiO nanoflakes still delivered a specific capacity above 300 mA h g−1. Moreover, when the current density was tuned back to 50 mA g−1, the m-NiO nanoflakes reached a reversible capacity of around 410 mA h g−1 and maintained this capacity in the following cycles.
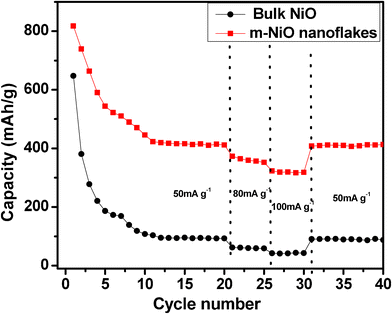 | ||
| Fig. 4 Cyclic performance of bulk NiO (black) and m-NiO nanoflakes (red) at a current density of 50 mA g−1, 80 mA g−1, and 100 mA g−1. | ||
Electrochemical impedance spectroscopy was performed after 20 cycles to understand the resistance associated with the bulk NiO and the m-NiO nanoflakes. Fig. 5 shows the Nyquist plots recorded for the bulk NiO and the m-NiO nanoflakes, which typically consists of a high frequency semicircle corresponding to the charge–transfer resistances (Rct). Nyquist data were then fitted to a hypothetical equivalent circuit (inset of Fig. 5) to evaluate the Rct and the resistance of the film formed on the electrode surface (Rf). It was revealed that Rct and Rf for the m-NiO nanoflakes was 21.78 Ω and 11.63 Ω, respectively, lower than the corresponding Rct (31.95) and Rf (12.01) of the bulk NiO electrode, indicating that the m-NiO nanoflakes can significantly decrease the total impedances, which might be one reason for the m-NiO nanoflakes achieving improved electrochemical performance.
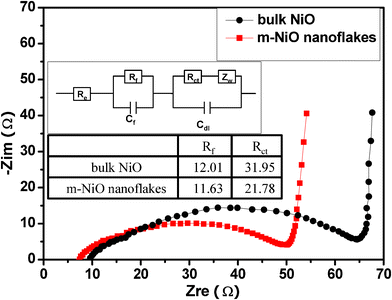 | ||
| Fig. 5 The Nyquist curve of the LIB with NiO (black) and m-NiO nanoflakes (red) as the working electrode. Inset is the equivalent circuit to the corresponding LIBs. | ||
The oxygen reduction reaction (ORR) has been of widespread attention due to its significant role in fuel-cell and metal–air battery systems. 26–28 Various strategies, especially exploring the non-precious or decreased precious metal catalysts, have been proposed for improving the sluggish kinetics of the ORR. 29–31 The preliminary results herein show that the m-NiO nanoflakes can somehow advance the catalytic activity of the ORR, as compared to the bare glassy carbon (GC) electrode and bulk NiO electrode. Furthermore, if loading Pt nanoparticles, the m-NiO nanoflakes make a remarkable improvement for catalyzing the ORR.
CVs were carried out to investigate the electrochemical properties for ORR on m-NiO nanoflakes, the bulk NiO and GC electrodes in 0.5 M KOH electrolyte. Fig. 6a shows CVs recorded from the above three electrodes in N2-saturated electrolyte, respectively. One can observe a significant difference between the NiO modified electrode and GC electrode. On the bare GC electrode, there is no obvious redox peak. For both m-NiO nanoflakes and bulk NiO electrodes, they exhibit a similar CV behavior, in which it was observed that a pair of reversible redox peaks at around 0.25 V was associated with the revisable redox reaction on NiO. Fig. 6b shows a voltammogram curve recorded in O2 saturated 0.5 M KOH solution at the three electrodes. An obvious cathodic peak positioned at about −0.3 V can be observed for the three electrodes, which can be ascribed to the electrochemical reduction of oxygen. Obviously, the cathodic peak current at the m-NiO nanoflakes electrode was much higher than that of the other two electrodes, actually, the peak current (85.6 μA) obtained from the m-NiO nanoflakes electrode was twice that of the bulk NiO electrode (41.4 μA), and four times higher than that of the GC electrode (16.6 μA), suggesting that the m-NiO shows higher activity than the other two electrodes.
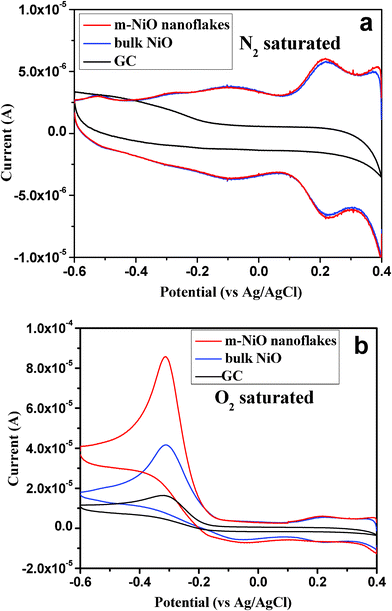 | ||
| Fig. 6 Cyclic voltammograms of the electrodes in N2 (a) and O2 (b) saturated aqueous solution of 0.5 M KOH at a scan rate of 50 mV s−1: m-NiO nanoflakes/GC (red), bulk NiO/GC (blue); bare GC (black) electrode. | ||
Fig. 7 shows typical current density–time responses for the ORR measured at a fixed potential of −0.30 V in O2 saturated 0.5 M KOH solution at the m-NiO nanoflakes, the bulk NiO and bare GC electrodes, respectively. As expected, the current at m-NiO nanoflakes electrode was evidently higher than the other two electrodes. In the steady state region, the m-NiO nanoflakes electrode presented the highest steady-state current (7.5 × 10⁻⁶ A). While the bulk NiO and GC electrode exhibited only a steady-state current of about 4.1 × 10⁻⁶ A and 2.6 × 10⁻⁶ A respectively. This result further demonstrated that the m-NiO nanoflakes had a higher activity and better stability when used as the electrode of ORRs.
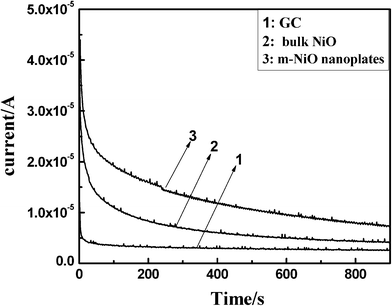 | ||
| Fig. 7 Current–time curves of (1) bare GC electrodes, (2) bulk NiO and (3) m-NiO nanoflakes in O2 saturated 0.05 M KOH at a fixed potential of −0.3 V. | ||
The m-NiO nanoflakes did show a promising route to advance the activity of the ORR, possibly due to its unique structure and large surface area. It should be noted that Pt nanoparticles in the Pt/Fe3O4 nanostructures were reported to show a significant increase in mass activity toward ORR compared with the single component Pt nanoparticles. 32
Fig. 8a,b shows the TEM images of the Pt nanoparticles and the Pt/m-NiO nanoflakes, respectively, one can observe the as-prepared Pt nanoparticles are in the range of 2–5 nm (Fig. 8a), and the Pt nanoparticles were well distributed on the surface of m-NiO nanoflakes (Fig. 8b). The electrochemically active surface area (EASA) was evaluated through the hydrogen adsorption region of CVs technique in 0.5 M KOH, it was found that the Pt/m-NiO flakes shows a slight higher EASA than pure Pt nanoparticles, the larger EASA for the former was possibly attributed to the highly dispersed Pt nanoparticles on m-NiO flakes.
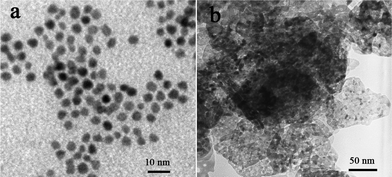 | ||
| Fig. 8 TEM images (a) Pt nanoparticles and (b) Pt/m-NiO nanoflakes. | ||
The electrochemical catalytic activity for ORR in Pt nanoparticles and Pt/m-NiO nanoflakes were then characterized by the rotating disk electrode measurement performed in 0.5 M KOH aqueous solution, as shown in Fig. 9a. Both electrodes exhibit similar polarization curves. Although the Pt mass loading at the Pt/m-NiO nanoflakes electrode is only one fifth of the Pt nanoparticle electrode, the former manifests a slightly higher limited current density, proving that the Pt/m-NiO nanoflakes show 5 fold increase in mass activity toward ORR, as compared with the Pt nanoparticles. Fig. 9b–c presents the RDE voltammograms and the corresponding Koutecky–Levich plots, respectively. The inverse current density (j−1) shows good linearity and parallelism as a function of the inverse of the square root of the rotation rate (ω−1/2) at different potentials, indicating consistent electron transfer and the first-order kinetics with respect to the ORR. Based on the Koutecky–Levich equation, the kinetic current density at −0.20 V was calculated to be 17.9 mA cm−2 based on the intercept of the Koutecky–Levich plots, which is 2 times higher than that of the Pt nanoparticle catalyst (7.20 mA cm−2), and is even higher than that of the Pt/C catalysts (14.20 mA cm−2).33 We further studied the ORR polarization curves for the Pt/m-NiO nanoflakes before and after 100 cycles to evaluate their stability for catalyzing the ORR. After 100 cycles, there was only a 6 mV negative-shift in the half-wave potential on the Pt/m-NiO nanoflakes (Fig. 9d), signifying that the m-NiO nanoflakes supports and also possesses excellent long-term stability. Since the m-NiO nanoflakes not only had a large surface area and showed improved kinetics for the ORR, the synergetic interactions between Pt and m-NiO may lead to higher electron population on Pt, resulting in more activity toward the ORR than the Pt nanoparticle catalyst. It is reasonable to envisage that an optimal catalytic performance for the ORR can be obtained after depositing the Pt nanoparticles on the surface of the m-NiO nanoflakes.
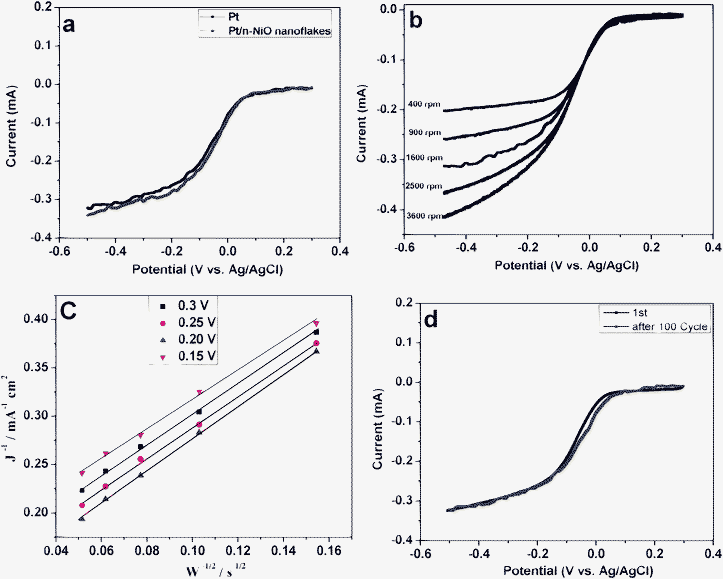 | ||
| Fig. 9 The ORR curves for Pt and Pt/m-NiO nanoflakes through RDE measurements with a rotation speed of 1600 rpm and a scanning rate of 5 mV s−1 in 0.5 M KOH (a); the polarization curves of Pt/m-NiO nanoflakes ORR at different rotating rates (b); Koutecky–Levich (K–L) plot of current density versus w−1/2 at different potentials on the Pt/m-NiO nanoflakes electrode (c); The linear-sweep voltammograms recorded after 0 and 100 CVs cycles in O2 saturated 0.5 M KOH with 1600 rpm and a scan rate of 5 mV s−1 on the Pt/m-NiO nanoflakes, CVs range: −0.8 ∼ 0.4 V, scan rate, 0.1 V s−1 (d). | ||
Conclusion
In summary, we have demonstrated a simple approach to the fabrication of nanoflakes with mesoporous structures. The resulting m-NiO nanoflakes demonstrated improved electrochemical lithium storage as the anode of LIBs, and exhibited improved catalytic activity to promote the ORR. The improved electrochemical properties of the m-NiO nanoflakes could be attributed to the high surface area and mesoporous nanoflake structure. Given the low cost fabrication method, and the intrinsic promising properties, the m-NiO nanoflakes have the potential for extensive applications in various energy storage and conversion systems.Acknowledgements
This work was supported by the National Natural Science Foundation of China (no. 20903055), Humboldt Scholarship Funding and Key Program Foundation of Jiangxi Educational Committee (GJJ09019, GJJ09491) and Natural Science Foundation of Jiangxi Province (2009GZH0085).References
- M. H. Bartl, S. W. Boettcher, E. L. Hu and G. D. Stucky, J. Am. Chem. Soc., 2004, 126, 10826–10827 CrossRef CAS.
- S. Bureekaew, S. Horike, M. Higuchi, M. Mizuno, T. Kawamura, D. Tanaka, N. Yanai and S. Kitagawa, Nat. Mater., 2009, 8, 831–836 CrossRef CAS.
- H. Jiang, T. Sun, C. Li and J. Ma, RSC Adv., 2011, 1, 954–957 RSC.
- F.-R. F. Fan, S. Park, Y. Zhu, R. S. Ruoff and A. J. Bard, J. Am. Chem. Soc., 2009, 131, 937–939 CrossRef CAS.
- K. S. Kim, Y. Zhao, H. Jang, S. Y. Lee, J. M. Kim, K. S. Kim, J.-H. Ahn, P. Kim, J.-Y. Choi and B. H. Hong, Nature, 2009, 457, 706–710 CrossRef CAS.
- S. Yang, X. Feng, L. Wang, K. Tang, J. Maier and K. Muellen, Angew. Chem., Int. Ed., 2010, 49, 4795–4799 CrossRef CAS.
- S. A. Needham, G. X. Wang, H. K. Liu and L. Yang, J. Nanosci. Nanotechnol., 2006, 6, 77–81 CAS.
- P. A. Nelson, J. M. Elliott, G. S. Attard and J. R. Owen, Chem. Mater., 2002, 14, 524–529 CrossRef CAS.
- C. Coudun and J. F. Hochepied, J. Phys. Chem. B, 2005, 109, 6069–6074 CrossRef CAS.
- S. Chen, J. Zhu, H. Zhou and X. Wang, RSC Adv., 2011, 1, 484–489 RSC.
- I. R. M. Kottegoda, N. H. Idris, L. Lu, J.-Z. Wang and H.-K. Liu, Electrochim. Acta, 2011, 56, 5815–5822 CrossRef CAS.
- L. Le Pleux, A. L. Smeigh, E. Gibson, Y. Pellegrin, E. Blart, G. Boschloo, A. Hagfeldt, L. Hammarstrom and F. Odobel, Energy Environ. Sci., 2011, 4, 2075–2084 CAS.
- S. K. Meher, P. Justin and G. R. Rao, ACS Appl. Mater. Interfaces, 2011, 3, 2063–2073 CAS.
- A. Nattestad, M. Ferguson, R. Kerr, Y.-B. Cheng and U. Bach, Nanotechnology, 2008, 19, 295304 CrossRef.
- C. Xu, J. Sun and L. Gao, J. Power Sources, 2011, 196, 5138–5142 CrossRef CAS.
- X. Song and L. Gao, J. Phys. Chem. C, 2008, 112, 15299–15305 CAS.
- D. S. Wang, R. Xu, X. Wang and Y. D. Li, Nanotechnology, 2006, 17, 979–983 CrossRef CAS.
- Z. H. Liang, Y. J. Zhu and X. L. Hu, J. Phys. Chem. B, 2004, 108, 3488–3491 CrossRef CAS.
- B. Scrosati, J. Hassoun and Y.-K. Sun, Energy Environ. Sci., 2011, 4, 3287 CAS.
- F. Cheng, J. Liang, Z. Tao and J. Chen, Adv. Mater., 2011, 23, 1695–1715 CrossRef CAS.
- V. Etacheri, R. Marom, R. Elazari, G. Salitra and D. Aurbach, Energy Environ. Sci., 2011, 4, 3243–3262 CAS.
- Z. Wen, Q. Wang and J. Li, J. Nanosci. Nanotechnol., 2006, 6, 2117–2122 CrossRef CAS.
- Z. Wen and J. Li, J. Mater. Chem., 2009, 19, 8707–8713 RSC.
- X. Wang, Z. Yang, X. Sun, X. Li, D. Wang, P. Wang and D. He, J. Mater. Chem., 2011, 21, 9988 RSC.
- Y. J. Mai, J. P. Tu, X. H. Xia, C. D. Gu and X. L. Wang, J. Power Sources, 2011, 196, 6388–6393 CrossRef CAS.
- Z. Wen, J. Liu and J. Li, Adv. Mater., 2008, 20, 743–747 CrossRef CAS.
- X. Zhao, M. Yin, L. Ma, L. Liang, C. Liu, J. Liao, T. Lu and W. Xing, Energy Environ. Sci., 2011, 4, 2736–2753 CAS.
- Y. Bing, H. Liu, L. Zhang, D. Ghosh and J. Zhang, Chem. Soc. Rev., 2010, 39, 2184–2202 RSC.
- A. Ishihara, Y. Ohgi, K. Matsuzawa, S. Mitsushima and K.-I. Ota, Electrochim. Acta, 2010, 55, 8005–8012 CrossRef CAS.
- C. Ferchaud, J.-C. Grenier, Y. Zhang-Steenwinkel, M. M. A. van Tuel, F. P. F. van Berkel and J.-M. Bassat, J. Power Sources, 2011, 196, 1872–1879 CrossRef CAS.
- F. Jaouen, E. Proietti, M. Lefevre, R. Chenitz, J.-P. Dodelet, G. Wu, H. T. Chung, C. M. Johnston and P. Zelenay, Energy Environ. Sci., 2011, 4, 114–130 CAS.
- C. Wang, H. Daimon and S. Sun, Nano Lett., 2009, 9, 1493–1496 CrossRef CAS.
- Z. Wen, S. Ci, F. Zhang, X. Feng, S. Cui, S. Mao, S. Luo, Z. He and J. Chen, Adv. Mater., 2012, 24, 1399–1404 CrossRef CAS.
| This journal is © The Royal Society of Chemistry 2012 |
