Cu6Sn5–TiC–C nanocomposite alloy anodes with high volumetric capacity for lithium ion batteries
Danielle
Applestone
and
Arumugam
Manthiram
*
Electrochemical Energy Laboratory & Materials Science and Engineering Program, University of Texas at Austin, Austin, Texas 78712. E-mail: rmanth@mail.utexas.edu; Fax: (512) 471-7681; Tel: (512) 471- 1791
First published on 13th April 2012
Abstract
A Cu6Sn5–TiC–C nanocomposite alloy anode has been synthesized by first firing a mixture of Cu, Sn, and Ti metals and then ball milling the resultant material with carbon. X-ray diffraction (XRD), transmission electron microscopy (TEM), scanning transmission electron microscopy (STEM), and scanning electron microscopy (SEM) reveal that these nanocomposites are composed of nanostructured Cu6Sn5 particles in a matrix of TiC and conductive carbon. The presence of TiC and conductive carbon improves the cycle life of Cu6Sn5 anodes compared to that found with plain Cu6Sn5. With a second cycle discharge capacity of 1340 mAh cm−3 (610 mAh g−1) and a tap density of 2.2 g cm−3, the Cu6Sn5–TiC–C nanocomposite anode offers a volumetric capacity that is at least four times higher than that of the graphite anode and 30% higher than what can be achieved with silicon. A conductive Cu framework supports the electrochemically-active Sn particles, resulting in low impedance and good rate capability. TEM data from electrodes that were cycled between 0 and 200 cycles show that the Cu6Sn5 particles do not agglomerate, and the morphology of the particles does not change during extended cycling. Furthermore, this nanocomposite anode material exhibits excellent performance in full cells with manganese-containing cathodes at elevated temperatures, indicating that it may not be poisoned by dissolved Mn.
1. Introduction
Lithium-ion batteries have become the power source of choice for portable devices due to their higher energy density compared to other rechargeable systems. They are now being intensively pursued for electric vehicles (EV) and hybrid electric vehicles (HEV). Lithium-ion batteries currently use graphite as the anode due to its excellent cycling behavior. However, graphite has a limited theoretical capacity of 372 mAh g−1 and is an unsafe choice for vehicle applications. The formation of a solid-electrolyte interphase (SEI) layer by a reaction of the graphite surface with the electrolyte and an operating voltage close to that of Li/Li+ leads to a plating of metallic lithium on the graphite surface, which results in safety problems. These safety issues are exacerbated under high rates of charge/discharge and at low temperatures, as lithium-ion diffusion through the SEI layer becomes difficult. The rate capability and safety of the batteries are critical parameters for vehicle applications. These pitfalls of the graphite anode demand the development of alternate anode materials.1–4Silicon-based anode materials have attracted much attention, due to their extremely high gravimetric capacity (∼ 4000 mAh g−1). However, because of the low tap density of silicon-based anodes (< 0.5 g cm−3), their volumetric capacity is not as impressive.5 For applications where space is a concern, such as in electric vehicles, the volumetric capacity and volumetric energy density are just as important as or more important than the gravimetric energy density. Among the various possible anode alternatives pursued, Sn-based materials have been suggested as one of the most promising candidates to replace graphite due to their high capacity, high packing density, and safe thermodynamic potential compared to the carbonaceous anode materials.6,7 The use of Sn-based anodes in practical lithium-ion cells has generally been plagued by severe capacity fade that arises from a large volume change occurring during the charge–discharge process. The volume change leads to lattice stress and subsequent cracking and crumbling of the alloy particles during cycling, resulting in an abrupt decrease in capacity within a few charge–discharge cycles.8,9 Many attempts have been made to overcome these problems by using nanostructured Sn alloy particles as the active material or by using intermetallic alloys with a composite structure that contains an active or inactive host matrix. The nanostructured materials are expected to offer shorter diffusion lengths for lithium ions and accommodate the strain that occurs during cycling.2,6,10 The active–inactive composite strategy, on the other hand, involves a mixture of two materials, one reacting with lithium while the other acting as an electrochemically inactive matrix to buffer the volume change during the charge–discharge cycling. This paper focuses on a strategy that combines both of the above strategies by creating an active–inactive composite with nanostructured materials.
In a recently published study on a Sn–Ti–C composite, a stable cycle life of 300 cycles at a capacity of 370 mAh g−1 and ∼ 850 mAh cm−3 was achieved.11 The behavior of the Sn–Ti–C material showed that it is possible to circumvent the problem of severe capacity fade by employing a composite strategy with Sn-based materials, while avoiding the use of expensive and toxic Co, as is employed in Sony's Nexelion Sn–Co–C composite material. By increasing the amount of active Sn relative to the inactive portion of the composite, it is possible to improve the capacity of the composite material. The challenge is to maintain the benefit of the buffering effects of the composite while getting as much capacity out of the material as possible. In order to create a composite material with higher, yet still stable capacities, combining the strategies of using nanostructured Sn-based alloys and embedding those Sn-based alloy particles in a matrix of Ti and C might yield a material that performs even better than the published Sn–Ti–C material.
Much work has been done exploring Cu6Sn5 without much success in achieving stable cycle performance or high volumetric capacity.12–15 Part of the reason for this is the significant structural changes that occur when the material transitions from Cu6Sn5 to Li2CuSn to Li4.4Sn. The transition from Li2CuSn to Li4.4Sn is thought to lead to irreversibilities in the capacity, and so when Cu6Sn5 is cycled, it is generally kept above the 200 mV potential at which the Li2CuSn to Li4.4Sn transition occurs. By limiting the amount of lithium inserted into the material to 2 Li per Sn, a drastic reduction in capacity was observed.15 Thorne et al.16 published information that showed that by creating an amorphous or nanostructured material from Cu6Sn5 and carbon, a stable capacity for 100 cycles at 400 mAh g−1 could be achieved.
With an aim to improve the gravimetric and volumetric capacities as well as cycle life, we present here a systematic investigation of the Cu6Sn5–TiC–C nanocomposite, encompassing the active–inactive and nanostructured strategies together. The nanocomposites are prepared by furnace heating of a mixture of Cu, Sn, and Ti metals, followed by a simple high-energy mechanical milling (HEMM) of the Sn–Ti–Cu alloys and carbon. The ultrafine Cu6Sn5 particles dispersed in the TiC + C matrix are characterized by X-ray diffraction (XRD), ex-situ XRD, scanning electron microscopy (SEM), transmission electron microscopy (TEM), scanning transmission electron microscopy (STEM), and electrochemical charge–discharge measurements including impedance analysis.
2. Experimental
The Cu6Sn5–TiC–C nanocomposite was prepared as described below. First, a mixture of Cu–Sn–Ti alloy phases were obtained by heating a mixture of Sn (99.8%, < 45 μm, Aldrich), Cu (99%, 45 μm Acros Organics), and Ti (99.99%, ∼325 mesh, Alfa Aesar) powders in an atomic ratio of 3![[thin space (1/6-em)]](https://www.rsc.org/images/entities/char_2009.gif) :
:![[thin space (1/6-em)]](https://www.rsc.org/images/entities/char_2009.gif) 1
1![[thin space (1/6-em)]](https://www.rsc.org/images/entities/char_2009.gif) :
:![[thin space (1/6-em)]](https://www.rsc.org/images/entities/char_2009.gif) 5 at 900 °C in a flowing Argon atmosphere for 12 h. The mixture of Cu–Sn–Ti phases was then mixed with 20 wt% acetylene black and subjected to high energy mechanical milling (HEMM) for 40 h at a speed of 500 rpm in a vibratory mill at ambient temperature under argon atmosphere to obtain the Cu6Sn5–TiC–C nanocomposite.
5 at 900 °C in a flowing Argon atmosphere for 12 h. The mixture of Cu–Sn–Ti phases was then mixed with 20 wt% acetylene black and subjected to high energy mechanical milling (HEMM) for 40 h at a speed of 500 rpm in a vibratory mill at ambient temperature under argon atmosphere to obtain the Cu6Sn5–TiC–C nanocomposite.
The samples were characterized with a Rigaku Ultima IV X-ray diffractometer with Cu-Kα radiation, Hitachi S-5500 STEM, and JEOL 2010 TEM operating at 300 kV. The STEM and TEM samples were prepared by dispersing the sample in ethanol, depositing it dropwise onto a carbon-coated copper grid, and removing the ethanol at ambient temperature. The electrodes for the electrochemical evaluation were prepared by mixing 70 wt% active material (Cu6Sn5–TiC–C) powder, 15 wt% carbon black (Super P), and 15 wt% polyvinylidene fluoride (PVDF) in N-methylpyrrolidone (NMP) to form a slurry. The slurry was spread onto a copper foil and dried at 120 °C for 2 h under vacuum. The electrodes were then assembled into CR2032 coin cells in an Ar-filled glove box with Celgard polypropylene separator, lithium foil as the counter electrode, and 1 M LiPF6 in ethylene carbonate (EC)/diethyl carbonate (DEC) (1![[thin space (1/6-em)]](https://www.rsc.org/images/entities/char_2009.gif) :
:![[thin space (1/6-em)]](https://www.rsc.org/images/entities/char_2009.gif) 1 v/v) electrolyte. The discharge–charge experiments were performed galvanostatically at a constant current density of 100 mA g−1 of active material within the voltage range of 0–2.0 V vs. Li/Li+ or 0.2 V − OCV vs. Li/Li+. Cycle testing was performed at 25 °C. To investigate the structural changes that may occur during electrochemical cycling, ex-situ XRD data were collected with a Rigaku Ultima IV X-ray diffractometer at a current rate of 100 mA g−1 of active material. Electrochemical cycle testing at 55 °C was also performed with full, coffee-bag type cells with spinel manganese oxide cathodes and layered nickel-manganese-cobalt oxide cathodes with lithium metal as the reference electrode at a constant current density of 100 mA g−1 of active material within the voltage range of 0.2 – OCV vs. Li/Li+. The electrodes for ex-situ XRD evaluation were prepared by mixing 70 wt% active material (Cu6Sn5–TiC–C) powder, 15 wt% carbon black (Super P), and 15 wt% polytetrafluoroethylene (PTFE) with several drops of 2-propanol. The electrodes were pressed into copper mesh and dried at 120 °C overnight under vacuum. Tap density measurements were made with a Quantachrome AT-4 Autotap machine.
1 v/v) electrolyte. The discharge–charge experiments were performed galvanostatically at a constant current density of 100 mA g−1 of active material within the voltage range of 0–2.0 V vs. Li/Li+ or 0.2 V − OCV vs. Li/Li+. Cycle testing was performed at 25 °C. To investigate the structural changes that may occur during electrochemical cycling, ex-situ XRD data were collected with a Rigaku Ultima IV X-ray diffractometer at a current rate of 100 mA g−1 of active material. Electrochemical cycle testing at 55 °C was also performed with full, coffee-bag type cells with spinel manganese oxide cathodes and layered nickel-manganese-cobalt oxide cathodes with lithium metal as the reference electrode at a constant current density of 100 mA g−1 of active material within the voltage range of 0.2 – OCV vs. Li/Li+. The electrodes for ex-situ XRD evaluation were prepared by mixing 70 wt% active material (Cu6Sn5–TiC–C) powder, 15 wt% carbon black (Super P), and 15 wt% polytetrafluoroethylene (PTFE) with several drops of 2-propanol. The electrodes were pressed into copper mesh and dried at 120 °C overnight under vacuum. Tap density measurements were made with a Quantachrome AT-4 Autotap machine.
Electrochemical impedance spectroscopic analysis (EIS) was conducted with a Solartron SI1260 impedance analyzer by applying a 10 mV amplitude signal in the frequency range of 10 kHz to 0.001 Hz. Cu6Sn5–TiC–C served as the working electrode and lithium foil served as the counter and reference electrodes. The impedance response was measured after zero, one, and 20 charge–discharge cycles at 2 V vs. Li/Li+.
3. Results and discussion
3.1. Characterization
Fig. 1 shows the XRD pattern of the Cu6Sn5–TiC–C sample. The sample exhibits peaks corresponding to crystalline Cu6Sn5 (JCPDS No. 00-045-1488) and TiC (JCPDS No. 00-032-1383) and confirms the formation of Cu6Sn5 and TiC. The carbon in the composite is not highly crystalline and does not appear in the XRD pattern. | ||
| Fig. 1 XRD pattern of Cu6Sn5–TiC–C nanocomposite obtained by the mechanochemical reduction reaction, indicating the presence of Cu6Sn5 (JCPDS No. 00-045-1488) and TiC (JCPDS No. 00-032-1383). | ||
Fig. 2 shows the SEM, TEM, and STEM element mapping images of the Cu6Sn5–TiC–C nanocomposite. The SEM image in Fig. 2a shows the secondary particles of carbon (acetylene black) that are approximately 10 μm in size, with the smaller Cu6Sn5 and TiC particles blended and stuck to the carbon. The TEM image in Fig. 2b shows the highly crystalline nature of a ∼ 30 nm Cu6Sn5 particle. The particle in the TEM image appears to be coated with a layer of either carbon or TiC, but lattice fringes could not be observed for TiC. The distribution of particle sizes observed via TEM was between 10 and 200 nm. The STEM images shown in Fig. 2d–f reveal presence of Ti on the Cu6Sn5 particles. The TiC does not appear to be a homogenous coating on the particles but rather is present as heterogeneous marbling on the outside of the particles.
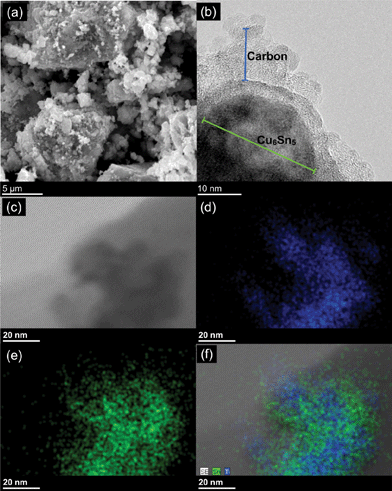 | ||
| Fig. 2 Images and element mapping of Cu6Sn5–TiC–C: (a) SEM, (b) TEM, (c) STEM, (d) element map of Ti, (e) element map of Sn, and (f) a composite element map of Ti and Sn. | ||
3.2. Electrochemical properties
The voltage profile and differential capacity plot of the Cu6Sn5–TiC–C nanocomposite are shown in Fig. 3. When cycled between 0 and 2 V vs. Li/Li+, the nanocomposite exhibits first gravimetric discharge and charge capacities of, respectively, 797 and 629 mAh g−1. When the material is cycled between 0.2 V vs. Li/Li+ and the open circuit voltage (OCV) for the material, the first gravimetric discharge and charge capacities are, respectively, 321 mAh g−1 and 225 mAh g−1. When the operating voltage window is limited to 0.2 − OCV vs. Li/Li+ for the material, the irreversible capacity loss is 96 mAh g−1 and the coulombic efficiency is around 70%. The irreversible capacity loss may be largely associated with the reduction of the electrolyte on the active material surface and the formation of solid-electrolyte interphase (SEI) layer.17 The voltage profile for Cu6Sn5–TiC–C closely resembles the gradual sloping that was observed in the work of Thorne et al.16 on amorphous/nanostructured Cu6Sn5–C. The voltage plateaus for the two-phase regions that are normally observed for Cu6Sn5 are not observed when Cu6Sn5 is nanostructured. Fig. 3 shows that the Cu6Sn5–TiC–C sample does not undergo a two-phase transition during cycling. When Cu6Sn5–TiC–C is cycled down to 0 V vs. Li/Li+, the major peaks in the differential capacity plot (Fig. 3) occur around 0.35 V and 0.13 V vs. Li/Li+. When the sample is cycled between 0.2 V vs. Li/Li+ and the open circuit voltage (OCV) of the material, only one peak is observed at around 0.31 V vs. Li/Li+ in the discharge cycle (inset in Fig. 4). This change in the differential capacity plot and the corresponding reduction in capacity indicate that when the material is discharged down to 0.2 V vs. Li/Li+, the reaction of lithium with Cu6Sn5 is not complete. However, when the lower potential is set at 0.2 V vs. Li/Li+ rather than 0 V vs. Li/Li+, an improvement in the cycle performance of Cu6Sn5–TiC–C is observed (Fig. 4). The improvement in cycle life when the Cu6Sn5 material is kept above 0.2 V vs. Li/Li+ is likely due to the avoidance of the significant structural changes that occur when the final Cu is extruded from the Cu6Sn5 material and Li4.4Sn is formed. | ||
| Fig. 3 Voltage profiles and differential capacity plot of the second cycle for Cu6Sn5–TiC–C at 25 °C and a current of 100 mA g−1 of active electrode material between 0–2 V vs. Li/Li+. | ||
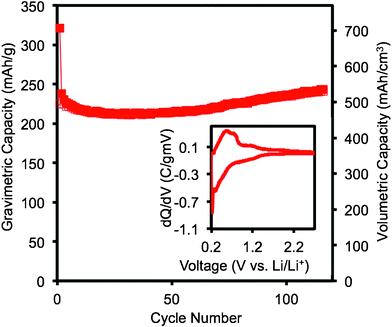 | ||
| Fig. 4 Volumetric and gravimetric discharge (closed symbols) and charge (open symbols) capacities of Cu6Sn5–TiC–C and commercial graphite from 0.2 V–2.7 V (OCV) vs. Li/Li+ at 25 °C and a current rate of 100 mA g−1 of active electrode material and a differential capacity plot of the second cycle (inset). | ||
In order to investigate the structural changes that occur during electrochemical cycling, XRD data were collected on electrodes that had been cycled and then extracted from the cells. Ex-situ XRD patterns recorded with electrodes at various points in the discharge–charge cycle are shown in Fig. 5. The peaks for the Cu6Sn5 phase gradually decrease in intensity during discharge to 0.07 V vs. Li/Li+, and then completely disappear upon full discharge to 0.0 V vs. Li/Li+. The Cu6Sn5 peaks then reappear during the charge cycle. The decomposition and reformation of the Cu6Sn5 phase is consistent with previously published results. The TiC phase is present at all points during the cycle and is inactive towards lithium. At full discharge, the Li–Sn phase that appears has an XRD peak at approximately 39°, which corresponds to a phase that is nearly Li4.4Sn. When Cu6Sn5–TiC–C is discharged to 0.21 V, 0.17 V, and 0.07 V vs. Li/Li+, two peaks emerge at around 33° and 52°. These two peaks are thought to correspond to an intermediate LixCuySn phase where 0 < y < 1 and x gradually increases during discharge. These two peaks disappear when the material is fully discharged. Based upon the ex-situ XRD data and the fact that the voltage profile for Cu6Sn5–TiC–C does not contain any distinct plateaus, the reaction mechanism for the Cu6Sn5–TiC–C nanocomposite is thought to be a gradual blend of the following two reactions:
| 10 Li + Cu6Sn5 → 5 Li2CuSn + Cu | (1) |
| 2.2 Li + Li2CuSn → Li4.4Sn + Cu | (2) |
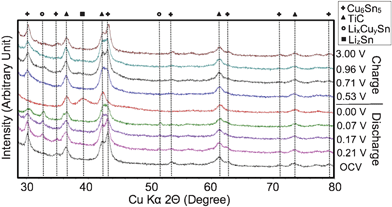 | ||
| Fig. 5 Ex-situ XRD patterns of Cu6Sn5–TiC–C during charge–discharge: LixCuySn represents the intermediate phases where 0 < y < 1 and x gradually increases during discharge. LizSn represents a Li4.4Sn-like phase. | ||
The two steps of the reaction do not happen in a stepwise fashion. Rather, the two steps of the reaction of the Cu6Sn5–TiC–C material with lithium occur somewhat simultaneously. This blended reaction mechanism is consistent with what has been published by Thorne et al.16 for the amorphous/nanostructured Cu6Sn5–C material. When the material is only discharged to 0.2 V vs. Li/Li+, step two of the above reaction mechanism does not occur, and Cu6Sn5–TiC–C does not experience the significant structural change that accompanies the transition from LixCuySn phases to the Li4.4Sn-like phase as the final Cu atoms are extruded.
The ex-situ XRD data also shed light on the increase in capacity that is observed when Cu6Sn5–TiC–C is discharged to 0.2 V vs. Li/Li+. Above 0.2 V, the primary reaction involves the formation of Li2CuSn from Cu6Sn5. Below 0.2 V, the primary reaction involves the formation of Li4.4Sn from Li2CuSn. However, the discharge profile of Cu6Sn5–TiC–C is continuous (Fig. 3) with an overlap of these two reactions over a small voltage range, so it is possible that during extended cycling, a higher fraction Li4.4Sn could be formed above 0.2 V. The higher fraction of Li4.4Sn would cause an increase in the capacity.
Fig. 6 compares the cyclability of Cu6Sn5–TiC–C and graphite at different temperatures and rates of charge. When Cu6Sn5–TiC–C is cycled between 0–2.0 V vs. Li/Li+ at 25 °C and 100 mA g−1 of active electrode material, it shows a volumetric discharge capacity that is four times that of graphite and stable for 70 cycles. The cycle performance of Cu6Sn5–TiC–C at 55 °C and 100 mA g−1 is compared with graphite in Fig. 6c. At 55 °C, the cycle performance of Cu6Sn5–TiC–C is less stable than at 25 °C, but the volumetric discharge capacity is still greater than three times the volumetric capacity of graphite. Fig. 6d compares the excellent rate capability of the Cu6Sn5–TiC–C nanocomposite with that of graphite. Even at a rate of 5 A g−1 of active material, Cu6Sn5–TiC–C shows high capacity.
 | ||
| Fig. 6 (a) Volumetric discharge (closed symbols) and charge (open symbols) capacities of Cu6Sn5–TiC–C and commercial graphite from 0–2.0 V vs. Li/Li+ at 25 °C and a current rate of 100 mA g−1 of active electrode material, (b) gravimetric discharge capacity of Cu6Sn5–TiC–C and commercial graphite from 0–2.0 V vs. Li/Li+ at 25 °C and a current rate of 100 mA g−1 of active electrode material, (c) volumetric discharge capacity of Cu6Sn5–TiC–C and commercial graphite from 0–2.0 V vs. Li/Li+ at 55 °C and a current rate of 100 mA g−1 of active electrode material, and (d) rate capability comparison of Cu6Sn5–TiC–C and commercial graphite at 25 °C between 0–2 V vs. Li/Li+. | ||
The compatibility of Cu6Sn5–TiC–C with commercial manganese-containing spinel and layered cathode materials at 55 °C, 100 mA g−1 of active electrode material, cycled between 0.2–2.8 V vs. Li/Li+ is shown in Fig. 7. The potential window was limited to 0.2–2.8 V vs. Li/Li+ in order to reduce the impact of structural changes and manganese poisoning on the cycle performance. The issue of manganese dissolution and subsequent poisoning of graphite is one of the factors that inhibit the use of graphite anodes with many commercially viable Mn-based cathode materials. Fig. 7 shows that even at high temperatures, Cu6Sn5–TiC–C has a stable capacity for 200 cycles and is compatible with commercial manganese-containing cathode materials. The capacity of both full cells improves slightly after the 100th cycle, and this is consistent with the performance of the half-cells when the cells are cycled above 0.2 V vs. Li/Li+.
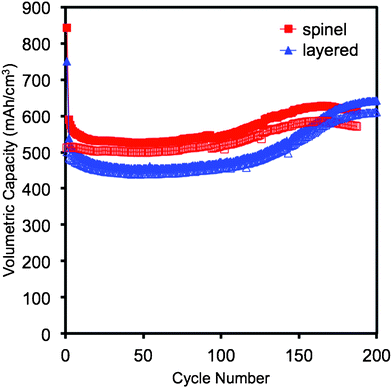 | ||
| Fig. 7 Cycle performance of cells fabricated with the Cu6Sn5–TiC–C anode and two commercial manganese-containing cathode materials (spinel and layered) at 55 °C, 100 mA g−1 of active electrode material, between 0.2–2.8 V vs. Li/Li+. Closed symbols and open symbols refer, respectively, to discharge and charge capacities. | ||
To gain insight into the electrochemical performance of Cu6Sn5–TiC–C, EIS measurements were conducted at 2 V vs. Li/Li+ before cycling, after the 1st cycle, and after the 20th cycle. The EIS data were analyzed based on an equivalent circuit given in Fig. 8.18 In Fig. 8, Ru refers to uncompensated resistance between the working electrode and the lithium reference electrode, CPEs refers to the constant phase element of the surface layer, Rs refers to the resistance of the SEI layer, CPEdl refers to the constant phase element of the double layer, Rct refers to the charge-transfer resistance, and Zw refers to the Warburg impedance. Generally, the EIS spectrum can be divided into three frequency regions, i.e., low frequency, medium-to-low frequency, and high-frequency regions, which correspond, respectively, to the geometric capacitance of the cell, the charge-transfer reaction, and the lithium-ion diffusion through the surface layer. The EIS spectra recorded before cycling, after one cycle, and after 20 cycles in Fig. 8 consist of two semicircles and a line. The diameter of the semicircle in the high-frequency region (lowest Z′ values) is a measure of the resistance Rs of the SEI layer. The diameter of the semicircle in the medium-frequency region (middle Z′ values) is a measure of the charge-transfer resistance Rct, which is related to the electrochemical reaction between the particles or between the electrode and the electrolyte. The portion of the impedance curve that has a linear slope is related to lithium-ion diffusion in the bulk of the active material.
 | ||
| Fig. 8 The equivalent circuit used for the impedance measurements and electrochemical impedance spectra (EIS) of the Cu6Sn5–TiC–C nanocomposite material before cycling (inset), after the 1st cycle, and after the 20th cycle. | ||
Before cycling (Fig. 8, inset), the Cu6Sn5–TiC–C sample exhibits Rs, Rct, and bulk diffusion resistances that are all an order of magnitude larger than the resistances of the Cu6Sn5–TiC–C samples after 1 or 20 cycles. After 20 cycles, the discharge capacity has begun to increase slightly, and this may be due to a decrease in bulk diffusion and surface resistance. When comparing the charge transfer resistance between the first and 20th cycle, it was observed that the charge transfer resistance of the sample that had been cycled 20 times was higher, though not significantly. An increase in the charge transfer resistance after 20 cycles indicates that the electrochemical reactions between the particles or between the electrode and the electrolyte are becoming more difficult.
3.3. TEM and XRD of cycled electrodes
In order to better understand the changes in morphology of the Cu6Sn5–TiC–C material during cycling, XRD and high-resolution TEM were performed on electrode materials that had been fully discharged down to 0 V vs. Li/Li+ and cycled between 0 and 200 cycles. After 200 cycles, the capacity of the Cu6Sn5–TiC–C electrode had been reduced to less than one percent of the original capacity. The XRD patterns for Cu6Sn5–TiC–C electrodes after up to 200 cycles do not change significantly for the electrodes that have been cycled, even after the material stops showing any appreciable capacity. This indicates that the particles are not agglomerating or significantly changing in size. The results of the XRD on cycled Cu6Sn5–TiC–C electrodes are further supported by the TEM images in Fig. 9. The TEM images show that the morphology and size of the Cu6Sn5 particles do not change significantly during cycling, even after the material has failed.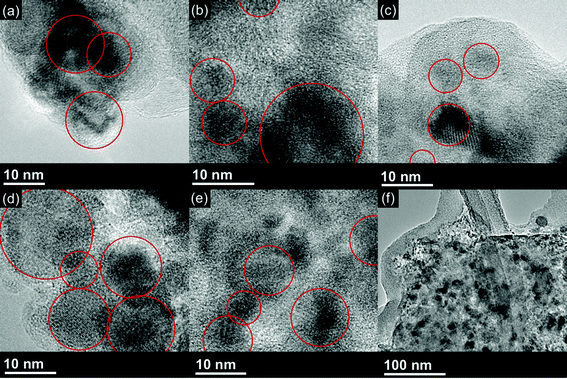 | ||
| Fig. 9 TEM of Cu6Sn5–TiC–C electrodes after (a) 0 cycle, (b) 20 cycles, (c) 50 cycles, (d) 100 cycles, and (e & f) 200 cycles. | ||
4. Conclusions
The Cu6Sn5–TiC–C nanocomposite has been investigated as an anode material for lithium-ion batteries. Characterization data collected on Cu6Sn5–TiC–C with XRD, TEM, and STEM reveal a material that contains highly crystalline Cu6Sn5 particles mixed heterogeneously with crystalline TiC and dispersed within a conductive carbon matrix. When operated between 0–2.0 V vs. Li/Li+, the Cu6Sn5–TiC–C nanocomposite anode shows a four-fold improvement in volumetric capacity over graphite and a stable cycle life of 70 cycles. The length of stable cycle performance is doubled when the material is only discharged to 0.2 V vs. Li/Li+. This improvement in cycle life is due to the avoidance of the structural changes that occur during the transition from Li2CuSn to Li4.4Sn. The exceptionally high tap density of 2.2 g cm−3 of the Cu6Sn5–TiC–C nanocomposite results in a volumetric capacity that is at least four times higher than that of the graphite anode and nearly 30% higher than what can be achieved with silicon. The composition of this novel anode material is bronze alloy, titanium carbide, and carbon, which improve structural integrity of the electrode and are less toxic to the environment than many of the alternatives, including the commercialized Nexelion Sn–Co–C anode. Finally, it may be possible to further improve the cycle life when Cu6Sn5–TiC–C is fully lithiated by further reducing the particle size of the material.Acknowledgements
This work was supported by the Department of Energy Office of Basic Energy Science grant number DE-SC0005397. The authors thank the National Science Foundation (Grant No. 0821312) and (Grant No. 0618242) for funding the Hitachi S-5500 Scanning Electron Microscope/Scanning Transmission Electron Microscope and Kratos Axis Ultra XPS used in this work.References
- Advances in Lithium-ion Batteries, ed. W. van Schalkwijk and B. Scrosati, Kluwer Academic/Plenum, New York, 2002 Search PubMed.
- A. S. Arico, P. Bruce, B. Scrosati, J.-M. Tarascon and W. Van Schalkwijc, Nat. Mater., 2005, 4, 366 CrossRef CAS.
- D. Larcher, S. Beattie, M. Morcrette, K. Edstrom, J.-C. Jumas and J.-M. Tarascon, J. Mater. Chem., 2007, 17, 3759 RSC.
- P. G. Bruce, B. Scrosati and J. M. Tarascon, Angew. Chem., Int. Ed., 2008, 47, 2930 CrossRef CAS.
- A. Magasinski, P. Dixon, B. Hertzberg, A. Kvit, J. Ayala and G. Yushin, Nat. Mater., 2010, 9, 353 CrossRef CAS.
- G. Derrien, J. Hassoun, S. Panero and B. Scrosati, Adv. Mater., 2007, 19, 2336 CrossRef CAS.
- R. Retoux, T. Brousse and D.M. Schleich, J. Electrochem. Soc., 1999, 146, 2472 CrossRef CAS.
- M. Holzapfel, H. Buqa, W. Scheifele, P. Novák and F.-M. Petrat, Chem. Commun., 2005, 1566 RSC.
- M. Winter and J. O. Besenhard, Electrochim. Acta, 1999, 45, 31 CrossRef CAS.
- J.-M. Tarascon and M. Armand, Nature, 2001, 414, 359 CrossRef CAS.
- S. Yoon and A. Manthiram, Electrochim. Acta, 2011, 56, 3029 CrossRef CAS.
- K. D. Kepler, J. T. Vaughey and M. M. Thackeray, J. Power Sources, 1999, 81–82, 383 CrossRef CAS.
- S. Sharma, L. Fransson, E. Sjöstedt, L. Nordström, B. Johansson and K. Edström, J. Electrochem. Soc., 2003, 150, A330 CrossRef CAS.
- T. Sarakonsri, C. S. Johnson, S. A. Hackney and M. M. Thackeray, J. Power Sources, 2006, 153, 319 CrossRef CAS.
- M. M. Thackeray, J. T. Vaughey, C. S. Johnson, A. J. Kropf, R. Benedek, L. M. L. Fransson and K. Edstrom, J. Power Sources, 2003, 113, 124 CrossRef CAS.
- J. S. Thorne, J. R. Dahn, M. N. Obrovac and R. A. Dunlap, J. Electrochem. Soc., 2011, 158, A1328 CrossRef CAS.
- M. Winter, J. O. Besenhard, M. E. Spahr and P. Novák, Adv. Mater., 1998, 10, 725 CrossRef CAS.
- J. Liu and A. Manthiram, Chem. Mater., 2009, 21, 1695 CrossRef CAS.
| This journal is © The Royal Society of Chemistry 2012 |
