Size control of gold nanoparticles by intense X-ray irradiation: the relevant parameters and imaging applications
Sheng-Feng
Lai
ab,
Chia-Chi
Chien
b,
Wen-Chang
Chen
*a,
Yi-Yun
Chen
b,
Chang-Hai
Wang
b,
Y.
Hwu
*bcd,
C. S.
Yang
e and
G.
Margaritondo
f
aDepartment of Chemical and Materials Engineering, National Yunlin University of Science and Technology, Douliou, Yunlin 64002, Taiwan. E-mail: chenwc@yuntech.edu.tw
bInstitute of Physics, Academia Sinica, Nankang, Taipei 11529, Taiwan. E-mail: phhwu@sinica.edu.tw; Fax: +886-2-2789-6721
cDepartment of Engineering and System Science, National Tsing Hua University, Hsinchu, Taiwan
dAdvanced Optoelectronic Technology Center, National Cheng Kung University, Tainan 701, Taiwan
eCenter for Nanomedicine, National Health Research Institutes, Miaoli 35053, Taiwan
fEcole Polytechnique Fédérale de Lausanne (EPFL), CH-1015, Lausanne, Switzerland
First published on 25th April 2012
Abstract
We report the analysis of a reducing-agent-free synthetic method based on intense X-ray irradiation in the presence of 11-mercaptoundecanoic acid (MUA) and their application in biomedical imaging. The method is very effective in controlling the size and size distribution of Au nanoparticles in colloidal solutions: gold nanoparticles (AuNPs) as small as ∼1.2 ± 0.25 nm are synthesized in a one-pot irradiation procedure without reducing agents. We found two coexisting properties of these small AuNPs: a strong visible fluorescence and very high accumulation in cells, which enabled a new type of multimodality imaging using X-ray and visible light microscopies. These properties come as a direct consequence of the precise size control; specifically, they exist only when the particle size is smaller than ∼1.4 nm. We found that this process critically depends on several parameters including the solution pH, the solution temperature and the irradiation time. Most important is the fact that the increase of the irradiation time is not necessarily beneficial, since an optimum value exists to obtain small particles with a narrow size distribution. The 1.4 nm AuNPs are not toxic and significantly accumulate in tumor tissues in animal tests, as confirmed by X-ray imaging and fluorescence microscopy. This biodistribution could open the way for the use of these nanoparticles in X-ray imaging.
Introduction
Gold nanoparticles (AuNPs) are intensively studied because of their multiple potential applications, in particular in nanomedicine.1–6 In most cases, an accurate control of the particle size is highly desirable.7–12 Quite recently, we discovered and tested an effective solution to this problem.13Such control led to the synthesis of a new kind of AuNPs with two coexisting properties that have significant potential for biomedical applications: a strong visible fluorescence and very high accumulation in cells. Specifically, we fabricated very small (<1.4 nm) AuNPs coated with 11-mercaptoundecanoid acid (MUA) with an original one-step synthesis method based on X-ray irradiation of the precursor solution. The nanoparticles exhibited strong red fluorescence not found for larger sizes. Furthermore, we detected a much larger uptake of these MUA-coated AuNPs (MUA-AuNPs) by EMT-6 cells than those of larger size. Combined with other favorable characteristics – such as the absence of cytotoxicity except for very high concentration and the non-interference with cell proliferation – these properties could be rather interesting for potential applications such as multimodal imaging (X-rays and visible lights), tracing or drug delivery.
Specifically, we used these nanoparticles as contrast agents by direct injection into the blood stream, we then followed their pathway in animal circulation using X-ray microradiology. This imaging strategy takes advantage of the enhanced permeation and retention effect14–17 to achieve tumor imaging based on the high accumulation of nanoparticles.
The strong photoluminescence provides simultaneous confirmation of the location of these particles without sophisticated sample preparation. Another approach in multimodality imaging which specifically takes advantage of the high cellular uptake is first loading cancer cells with a high concentration of photoluminescent MUA-AuNPs and then performing X-ray and fluorescent tracing of these cells during their development into tumors. The strong photoluminescence complements the high penetration of X-ray imaging by providing high sensitivity even weeks after the inoculation of AuNP-loaded cells. In general, the MUA coating on these nanoparticles opens up the possibility of strong accumulation for labeling, diagnostic or treatment applications. Note that these properties and applications critically depend on the precise size control; specifically, they exist only when the size is smaller than 1.4 nm and with a narrow size distribution.
The original synthesis method is based on two ingredients: irradiation of the precursor solution with an intense X-ray beam plus the simultaneous presence of MUA. The previous tests demonstrated the effectiveness of this approach in obtaining small particles and in narrowing their size distribution. However, the tests did not probe all the parameters that can influence the process and potentially increase its flexibility and effectiveness. Here we progress in the knowledge of the phenomena by analyzing several key parameters. The tests specifically concern the irradiation time, the pH of the precursor solution and its temperature during irradiation.
The most interesting results were obtained while studying the effects of prolonged X-ray irradiation. We found that the particle size obtained under optimal conditions does not saturate but actually increases with X-ray irradiation time. A model is proposed to explain these results, together with the first steps in its experimental validation.
Experimental
Materials
HAuCl4·3H2O, 11-mercaptoundecanoic acid (MUA), sodium hydroxide and 5,5-dimethyl-1-pyrroline N-oxide (DMPO) were purchased from Sigma-Aldrich. All chemicals were reagent grade. Distilled deionized water was purified with a Millipore Milli-Q water system.Synthesis of MUA-Au NPs
Precursor solutions were prepared with 0.5 mL of 20 mM HAuCl4·3H2O. Then, 0.2 mL of MUA with different concentrations in anhydrous ethanol was added, and volume was increased to 10 mL by adding water. The resulting solution was placed in plastic cuvette for X-ray irradiation, each containing 0.3 mL and the cross section fully illuminated by the X-ray beam. Each solution cuvette was adjusted to a given pH value by adding 0.1 M NaOH. The temperature was then controlled by a refrigerated/heating circulator during the X-ray irradiation. This took place on the BL01A beamline of the National Synchrotron Radiation Research Center (NSRRC), Hsinchu, Taiwan, running at a constant electron current of 300 mA by top-up injection every minute. The X-ray photon energy ranged from 8–15 keV and was centered at ∼12 keV; the dose rate was 4.7 × 10⁵ Gy s−1.18Specimen preparation
Samples for transmission electron microscopy (TEM) were prepared by placing a drop of the solution, after X-ray irradiation, on a carbon-coated copper grid and drying at 40 °C. TEM measurements were performed in a JEM-2100F system at an accelerating voltage of 200 kV. UV-visible spectra were acquired over the 200–800 nm wavelength range using a USB4000 Fiber Optic spectrometer from Ocean Optics (Dunedin, USA) with a 1 cm path length quartz cuvette (Evergreen Scientific, USA).Quantitative analysis of cellular uptake of MUA-AuNPs
After culturing of the EMT-6 cells for 24 h, the bare AuNPs and MUA-AuNPs with different particle sizes were added. After culturing with nanoparticles for another 24 h, the cells were trypsinized, counted and exposed to a freshly prepared aqua regia solution in an ultrasonic bath for 3 h. The Au content of the cells was then measured by ICP-MS (Inductively coupled plasma mass spectrometry) with an Agilent 7500cx Instrument.Fluorescence microscopy observation
After preparing the EMT-6 cell culture with the previous procedures and 32 h culturing, MUA-AuNPs (with a 0.5 mM Au concentration equivalent) with a MUA/Au molar ratio of 3 was added and cultured for 2 h. Afterwards, the cells were washed three times with 1× PBS, fixed in 4% formaldehyde solution for 10 min and placed in a dimethyl sulfoxide (DMSO) solution for optical microscopy observation with Olympus IX51 microscope, a 100 W halogen source and a U-MWU2 Mirror Unit.Tissue specimen preparation for X-ray images
BALB/c mice (20 ± 2 g, 4 week old) were acquired from the National Laboratory Animal Center and fed with sterile food and sterile water with pH kept at 7.0–7.5, while housed in isolated cages with a 12 h light/dark cycle. All the protocols for animal care and experiments related to this article were approved by the Institutional Animal Care and Use Committee (IACUC) of Academia Sinica and National Health Research Institutes, Taiwan.The 26 mg ml−1 of MUA-AuNPs were separately injected (in 200 μl volumes) via tail vein injection and then the mice were sacrificed after 24 h. The tumor, lung, liver and spleen were removed and immersed in 3.7% of paraformaldehyde for 24 h. After washing with 1× PBS three times, the tissue was dehydrated in solutions with increasing ethanol concentration, and then embedded in paraffin. The tissues were sliced into approximately ∼20 μm sections and then immersed in xylene for 5 min. After washing with xylene three times to remove the wax on the sliced tissue, de-waxing tissue samples were rehydrated by sequential treatment with ethanol from high to low concentration. At the end, the tissue specimens were immersed in distilled water. For staining, these tissue section specimens were separated into two groups: one for H&E staining and anther for heavy metal staining. The stained sliced specimens were washed with distilled water three times. Afterward, the sliced samples were dehydrated by sequential treatment with ethanol from low to high concentration. Finally, the tissue samples were embedded in resin.
The X-ray tests were performed on the 32-ID microscopy beamline of the Advanced Photon Source (APS) at the Argonne National Laboratory. Our full-field high resolution X-ray microscopy uses a set of capillary condensers that provide cone shaped illumination of the object with a numerical aperture matching the zone plate objectives.19–22 The condensers are elliptically shaped glass capillaries. The inner diameter of 0.9 mm was chosen to maximize the vertical acceptance of the APS undulator beam at 65 m from the source. The estimated monochromatic X-ray flux [through a Si (111) double crystal monochromator] focused by the condenser was 2 × 10¹¹ photon·s−1 at 8 keV. The high brightness of the APS and the optimized condensers design yielded an excellent imaging throughput of 50 ms per frame with ∼1 × 10⁴ charge coupled device counts per pixel. The microscope system can also operate in a Zernike phase contrast imaging mode with an Au Zernike phase ring placed at the back focal plane of the Fresnel zone plate objective. This phase imaging mode increases the contrast for fine features of tissue sliced in the hard X-ray spectral region.
Biodistribution of MUA-AuNPs in mice
Colloidal solutions containing 0.2 mL of 160 mM of MUA-AuNPs was injected to tumor bearing mice via tail veins. Fifteen mice were sacrificed 2, 12, or 24 h (5 each) after injection. After sacrifice, major organs and tissues (blood, lung, tumor, muscle, brain, heart, liver, spleen and kidney) were collected for ICP-MS analysis.Electron spin resonance (ESR) measurement
In this case, 0.3 mL of the solution to be irradiated was placed in the cuvette with 0.1 M of DMPO; the irradiating beam was attenuated by a 5 mm aluminum plate. Immediately after irradiation, the solution was transferred from the cuvettes to flat cells, and ESR spectra were recorded at room temperature in the X-band with an ADANI PS8400 system.Results and discussion
The procedure to synthesize MUA-AuNPs with the desired properties is based on a recent preliminary study in which we demonstrated that MUA coating combined with very fast reduction of Au ions makes it possible to control the size of Au NPs produced by X-ray irradiation.13 Specifically, we found that the presence of MUA decreases the NP size down to ≈1.18 nm in a controlled way, while preserving the good features from X-ray irradiation (high colloidal concentration, long-term stability and biocompatibility).Two important properties were found when the particle size was smaller than 1.4 nm: strong photoluminescence and high cellular uptake. Fig. 1 shows the strong red emission of 1.4 nm MUA-AuNPs under UV illumination. Such a photoluminescence gives an excellent contrast for in vivo studies similar to the organic labeling agents in bioluminescence imaging.23–25Fig. 2 shows an example of such imaging applications: the nanoparticles were injected into the mouse blood stream via the tail vein and their strong accumulation in the lung was easily visible by their characteristic red photoluminescence.
 | ||
| Fig. 1 Photoluminescence spectra of the bare AuNPs and MUA-AuNPs with different sizes. Inset is the photographs of these solutions with (top) white-light and (bottom) UV illumination. | ||
 | ||
| Fig. 2 Photographs of the chest of a mouse injected with fluorescent MUA-AuNPs and immediately sacrificed taken under (a) white-light and (b) UV illumination. | ||
The other important property present only for very small MUA-AuNPs is the extremely high cellular uptake. Fig. 3 shows a >20 fold increase of the amount of internalized Au per cell after culturing with MUA-AuNPs for 24 h, reaching ∼27 pg/cell for 1.4 nm MUA-AuNPs compared to ∼1 pg/cell for 2.2 nm nanoparticles. The fluorescence microscopy images in Fig. 3(b) qualitatively confirm this high uptake. The mechanism of this strong internalization was not yet clarified, but we can exclude the possibility of cross membrane effects and instead hypothesize an endocytosis process. The high uptake is then probably a consequence of stronger interaction of the 1.4 nm AuNPs with cell surfaces. The ability to load large amounts of the AuNPs in cells allows us to use these nanoparticles as cell labeling agents for X-ray imaging in addition to their generic role as contrast agents.26 The very high level uptake, ∼2 × 10⁹ per EMT-6 cell, without affecting the viability and division, we succeeded in imaging the cells in vivo and to follow their growth and evolution into tumors. Fig. 4 shows an example of this imaging strategy: the dark patches in the mouse thigh area are EMT-6 cells inoculated after being loaded with MUA-AuNPs.
 | ||
| Fig. 3 (a) ICP-MS analysis of MUA-AuNP uptake by EMT-6 cells as a function of the particle size; (b) and its inset are photoluminescence micrographs of MUA-AuNPs uptaken by EMT-6 cells, (c) is the control micrograph. The arrows mark the red luminescence of MUA-AuNPs. | ||
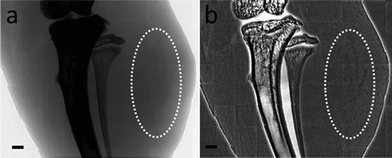 | ||
| Fig. 4 (a) and (b) are projection views of photoluminescent MUA-AuNPs loaded in EMT-6 cells that developed tumors; the MUA-AuNPs could also be viewed by X-ray imaging. (b) was processed by background flattening. | ||
Other types of AuNPs show high uptake by cells, including bare-AuNPs produced by the same X-ray irradiation methods,27–31 but they are not photoluminescent like the small MUA-AuNPs, and therefore not equally effective for imaging. Furthermore, as MUA is a standard linker for surface nanoparticle conjugation, the high surface-to-volume ratio of the small MUA-AuNP could lead to applications in drug delivery.
The potential role as drug carriers is of course facilitated by the strong accumulation at tumor sites due to the enhanced permeation and retention effect.14–17Fig. 5 shows the results of the pharmacokinetic study performed with ICP-MS at 2, 12 and 24 h after injection of 0.2 mL of 160 mM 2.2 nm MUA-AuNPs via the mouse tail vein. The results show that MUA has a similar effect in prolonging the circulation of AuNPs in mice as PEG and produced a ∼24 time higher concentration at tumor sites compared to normal tissue 24 h after injection.31
 | ||
| Fig. 5 ICP-MS analysis shows the biodistribution of the MUA-AuNPs in tumor bearing mice at different times after their injection. The inset shows the tumor/muscle ratio emphasizing its strong increase. | ||
The accumulation of MUA-AuNPs was also detected by high resolution X-ray microscopy.19–22Fig. 6 shows representative results for 2.2 nm MUA-AuNPs in different tissues. The images revealed that the MUA-AuNPs are distributed over large areas of liver (Fig. 6(a)), lung (Fig. 6(b)) and spleen (Fig. 6(c)) tissues and aggregated into clusters of size ∼50–300 nm. Since these clusters are not associated with blood vessels, the aggregation is likely caused by the endocytosis process. This also implies that these MUA-AuNPs can diffuse or penetrate through the vessel walls probably due to their very small size. The MUA-AuNPs were also found in hepatocytes (Fig. 6(a)) indicating that they were not detected by the specialized macrophages of tissues.
 | ||
| Fig. 6 High resolution X-ray micrographs of MUA-AuNPs in different tissues: (a) liver, (b) lung, (c) spleen and (d) tumor. The figures on the right-hand side are magnified versions of the marked boxes of the left images. | ||
Transmission electron microscopy (TEM), with sufficient resolution to directly image our smallest nanoparticles, failed to detect isolated MUA-AuNPs in these tissues: all the observed AuNPs were in aggregated forms. This confirmed the previous conclusion that high resolution X-ray microscopy is sufficient to detect and trace aggregates of our nanoparticles even if the individual nanoparticles are very small.32–34
Since the above favorable properties rely on accurate size control, we systematically investigated the effects of parameters that could have a critical influence. Specifically, we explored the impact of the pH and temperature of the precursor solution and of the X-ray irradiation time.
Fig. 7(a) shows the UV-visible spectra of the precursor solutions with alkaline conditions (pH = 11.28), after X-ray irradiation for 2 s in the presence of MUA at different temperatures. We shall see later that this pH gives optimum results as far as producing small NPs is concerned.
 | ||
| Fig. 7 (a) UV-visible spectra of MUA-AuNP colloidal solutions with pH = 11.28 after X-ray irradiation at different temperatures; (b) A TEM micrograph of the precipitated MUA-AuNP colloidal solution obtained at 55 °C. | ||
There is no significant difference between temperatures below 40 °C, but at 55 °C one can see the Au surface plasmon peak around 500 nm. This spectral feature indicates the presence of sufficiently large NPs, and therefore that larger particles are formed at higher temperatures. Corroborating evidence is provided by the TEM results (see Fig. 7(b)). This temperature effect is reasonable since a rise in temperature typically increases the nucleation rate.
Next, we discuss pH effects. The UV-visible spectra of Fig. 8(a), obtained with 2 s X-ray irradiation, exhibit significant differences over the pH range 2.56–11.28. Specifically, the intensity of the surface plasmon peak decreases as the pH value increases, its position shifts to smaller wavelengths and its width narrows. These results indicate that MUA-AuNPs synthesized under basic conditions have smaller mean sizes and narrower size distributions.
 | ||
| Fig. 8 (a) UV-visible spectra of MUA-Au colloidal solutions obtained by different pH values of the precursors solutions by 2 s of X-ray irradiation at 26 °C; (b) TEM micrographs of precipitated MUA-Au colloidal solutions obtained at (b) pH = 2.56, (c) pH = 6.36 and (d) pH = 11.28. | ||
The results from TEM shown in Fig. 8(b), (c), and (d), corresponding to pH values of 2.56, 6.36, and 11.28, are consistent with these conclusions. In particular, size distributions extracted by counting aggregates with given sizes confirmed that the distribution narrows as the pH increases.
Such findings must be analyzed in light of the previous results of other authors, many of whom reported that the Au NP aggregate size depends on the pH of the reacting solutions that produces different gold complexes influencing the reactivity.35,36 The difference in our case is the intense X-ray irradiation.
We can hypothesize that gold atoms are rapidly formed by the irradiation in large quantities and then nucleate. However, the nucleated NPs do not aggregate in larger clusters due to the formation of reducing agents by X-ray radiolysis. The final particle size is not, therefore, influenced by gold complexes. The TEM observation of particles for all pH values (see in particular Fig. 8(d)) confirms these hypotheses.
The increase of the mean particle size as pH decreases can be explained by the lower solubility of MUA.37 As a result, the Au nucleation is not quickly stopped by MUA surface capping and allows the formation of larger NPs. Such a phenomenon is complementary to the effects of the MUA concentration.13
Another effect of the pH could be via the protonation/deprotonation reactions on the MUA groups (i.e., COOH/COO−). This could affect the particle size and stability by electrostatic attraction or repulsion. Specifically, at high pH COO− groups could be formed on the particle surfaces causing repulsion between particles and avoiding aggregation. At low pH levels, the formation of COOH groups facilitates attraction and aggregation.
These hypotheses are supported by the fact that the mean particle size can be decreased after X-ray irradiation by increasing the pH value. The increase, in fact, enhances the transparency of the solution to visible light. In parallel, the UV-visible spectra show a blue-shift and narrower surface plasmon peak, indicating a smaller particle mean size and a narrower size distribution (ESI, Fig. S1†). These results corroborate the hypothesis that electrostatic attraction and repulsion plays a role in the final particle size.
Finally, we analyze the effects of the X-ray irradiation time for long irradiations. Fig. 9(a) shows the UV-visible spectra for increasing X-ray irradiation times under alkaline condition and at 26 °C. The intensity and the subsequent red-shift of the surface plasmon peak increases with irradiation time. Since very small particles (<2 nm) do not produce a visible peak, the intensity increase implies that more large particles are formed and this corresponds to a larger mean particle size.
 | ||
| Fig. 9 (a) UV-visible spectra of MUA-Au precursor solutions after different X-ray irradiation times, 2, 5, 10, 20, 30, 45, 60 s, at 26 °C, starting from pH = 11.28. (b) and (c) representative TEM micrographs and size histograms (from n > 500 particles in different micrographs) of precipitated MUA-Au precursor solutions after 30 and 60 s irradiation. The inset of Fig. 3(c) shows a high-resolution TEM micrograph revealing lattice planes with the known Au(111) spacing of 0.235 nm. | ||
It should be noted that long irradiations change the pH of the solution by radiolysis. Specifically, the pH becomes 8.02 after 60 s X-ray irradiation. However, the pH change cannot explain the intensity increase of the surface plasmon peak since the particle synthesis is completed within a fraction of a second.13 A possible mechanism allowing an increase in particle size for prolonged irradiation is discussed below.
The TEM micrographs for 30 and 60 s irradiation of Fig. 9(b) and (c) confirm the increase of the mean particle size to 4.1 and 4.9 nm. The high-resolution TEM image reveals a complete crystalline structure of these large nanoparticles (Fig. 9(c), inset). The size distribution histograms extracted from TEM micrographs are quite narrow, indicating a rather uniform size.
Scheme 1 schematically presents an overall pathway to explain the irradiation time phenomena presented above. The pathway includes three stages: first, extremely small MUA-coated Au NPs are synthesized within 1 s of X-ray irradiation. Afterwards, the coating MUA is oxidized to form disulfides (i.e., HOOC(CH2)10–S–S–(CH2)10COOH)) by radiolysis-produced OH· or H2O2. Finally, gold clusters with incomplete MUA coverage collide with each other and can form larger aggregates.
 | ||
| Scheme 1 A possible process explaining the increase in particle size by prolonged X-ray irradiation. | ||
As a preliminary test of this model, we confirmed the formation of hydroxyl radicals in our precursor solution during X-ray irradiation. This was tested by trapping the short-lived hydroxyl radicals with the spin traps DMPO to form relatively stable DMPO–OH, revealed by ESR spectroscopy.38,39 Specifically, the fingerprint is the 1![[thin space (1/6-em)]](https://www.rsc.org/images/entities/char_2009.gif) :2:2:1 four-line ESR spectrum (hyperfine coupling constants: aN = aH = 15 G) (ESI, Fig. S2†). The time dependence of this fingerprint was analyzed by attenuating by 98.6% the X-ray beam with an aluminum sheet. Fig. 10(a) shows EPR DMPO–OH spectra for different irradiation times, and Fig. 10(b) the peak intensity increase with irradiation time.
:2:2:1 four-line ESR spectrum (hyperfine coupling constants: aN = aH = 15 G) (ESI, Fig. S2†). The time dependence of this fingerprint was analyzed by attenuating by 98.6% the X-ray beam with an aluminum sheet. Fig. 10(a) shows EPR DMPO–OH spectra for different irradiation times, and Fig. 10(b) the peak intensity increase with irradiation time.
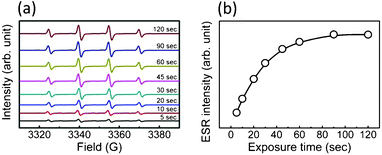 | ||
| Fig. 10 EPR spectra revealing spin adducts DMPO-OH in our precursor solution during X-ray irradiation, for different irradiation times; (b) variation with irradiation time of the ESR peak intensity. | ||
These results clearly prove a steady presence of hydroxyl radicals in our precursor solution, coherent with our model. However, a complete validation of the model requires very extensive additional tests that are currently underway; at this stage, it should still be considered as a plausible hypothesis.
Conclusions
No matter what the results of this validation will be, the empirical conclusions of our present study stand. Specifically, the control of Au NP size by X-ray irradiation in the presence of MUA does depend on several parameters. This increases the flexibility of the method and the chances of optimization for different practical objectives. It should be noted that the mere increase in the X-ray irradiation time is not necessarily beneficial: we discovered that an optimum irradiation time exists, and this point must be taken into account in any practical application of our method. As far as biodistribution is concerned, we found strong accumulation of the nanoparticles in tumor tissues, which could lead to applications in X-ray imaging.Acknowledgements
This research was supported by the National Program for Nanoscience and Nanotechnology, the Thematic Research Project of Academia Sinica, the Biomedical Nano-Imaging Core Facility at National Synchrotron Radiation Research Center (Taiwan), the Fonds National Suisse pour la Recherche Scientifique and by the Center for Biomedical Imaging (CIBM, supported by the Louis-Jeantet and Leenards foundations).References
- E. Boisselier and D. Astruc, Chem. Soc. Rev., 2009, 38, 1759–1782 RSC.
- C. J. Murphy, A. M. Gole, J. W. Stone, P. N. Sisco, A. M. Alkilany, E. C. Goldsmith and S. C. Baxter, Acc. Chem. Res., 2008, 41, 1721–1730 CrossRef CAS.
- R. Arvizo, R. Bhattacharya and P. Mukherjee, Expert Opin. Drug Delivery, 2010, 7, 753–763 CrossRef CAS.
- S. H. Hirn, S. M. Semmler-Behnke, C. Schleh, A. Wenk, J. Lipka, M. Schaffler, S. Takenaka, W. Moller, G. Schmid, U. Simon and W. G. Kreyling, Eur. J. Pharm. Biopharm., 2011, 77, 407–416 CrossRef CAS.
- T. T. T. Ngoc, T. H. Wang, C. Y. Lin, Y. C. Tsai, C. H. Lai, Y. Tai and B. Y. M. Yung, Bioconjugate Chem., 2011, 22, 1394–1401 CrossRef.
- E. Oh, J. B. Delehanty, K. E. Sapsford, K. Susumu, R. Goswami, J. B. Blanco-Canosa, P. E. Dawson, J. Granek, M. Shoff, Q. Zhang, P. L. Goering, A. Huston and I. L. Medintz, ACS Nano, 2011, 5, 6434–6448 CrossRef CAS.
- S. H. Wang, C. W. Lee, A. Chiou and P. K. Wei, J. Nanobiotechnol., 2010, 8, 33 CrossRef CAS.
- W. Jiang, B. Y. S. Kim, J. T. Rutka and W. C. W. Chan, Nat. Nanotechnol., 2008, 3, 145–150 CrossRef CAS.
- B. D. Chithrani and W. C. W. Chan, Nano Lett., 2007, 7, 1542–1550 CrossRef CAS.
- A. Schadlich, H. Caysa, T. Mueller, F. Tenambergen, C. Rose, A. Gopferich, J. Kuntsche and K. Mader, ACS Nano, 2011, 5, 8710–8720 CrossRef CAS.
- T. Kwon, T. Kim, F. Ali, D. J. Kang, M. Yoo, J. Bang, W. Lee and B. J. Kim, Macromolecules, 2011, 44, 9852–9862 CrossRef CAS.
- J. M. Byrne, N. D. Telling, V. S. Coker, R. A. D. Pattrick, G. van der Laan, E. Arenholz, F. Tuna and J. R. Lloyd, Nanotechnology, 2011, 22, 455709 CrossRef CAS.
- S. F. Lai, W. C. Chen, C. L. Wang, H. H. Chen, S. T. Chen, C. C. Chien, Y. Y. Chen, W. T. Hung, X. Q. Cai, E. R. Li, I. M. Kempson, Y. Hwu, C. S. Yang, E. S. Tok, H. R. Tan, M. Lin and G. Margaritondo, Langmuir, 2011, 27, 8424–8429 CrossRef CAS.
- Y. Matsumura and H. Maeda, Cancer Res., 1986, 46, 6387–6392 CAS.
- S. D. Li and L. Huang, Mol. Pharmaceutics, 2008, 5, 496–504 CrossRef CAS.
- C. J. Liu, C. H. Wang, S. T. Chen, H. H. Chen, W. H. Leng, C. C. Chien, C. L. Wang, I. M. Kempson, Y. Hwu, T. C. Lai, M. Hsiao, C. S. Yang, Y. J. Chen and G. Margaritondo, Phys. Med. Biol., 2010, 55, 931–945 CrossRef CAS.
- C. H. Wang, C. J. Liu, C. C. Chien, H. T. Chen, T. E. Hua, W. H. Leng, H. H. Chen, I. M. Kempson, Y. Hwu, M. Hsiao, T. C. Lai, J. L. Wang, C. S. Yang, H. M. Lin, Y. J. Chen and G. Margaritondo, Mater. Chem. Phys., 2011, 126, 352–356 CrossRef CAS.
- C. J. Liu, C. H. Wang, C. L. Wang, Y. Hwu, C. Y. Lin and G. Margaritondo, J. Synchrotron Radiat., 2009, 16, 395–397 CrossRef CAS.
- Y. S. Chu, J. M. Yi, F. De Carlo, Q. Shen, W. K. Lee, H. J. Wu, C. L. Wang, J. Y. Wang, C. J. Liu, C. H. Wang, S. R. Wu, C. C. Chien, Y. Hwu, A. Tkachuk, W. Yun, M. Feser, K. S. Liang, C. S. Yang, J. H. Je and G. Margaritondo, Appl. Phys. Lett., 2008, 92, 103119 CrossRef.
- Y. T. Chen, T. N. Lo, Y. S. Chu, J. Yi, C. J. Liu, J. Y. Wang, C. L. Wang, C. W. Chiu, T. E. Hua, Y. Hwu, Q. Shen, G. C. Yin, K. S. Liang, H. M. Lin, J. H. Je and G. Margaritondo, Nanotechnology, 2008, 19, 395302 CrossRef.
- Y. T. Chen, T. Y. Chen, J. M. Yi, Y. S. Chu, W. K. Lee, C. L. Wang, I. M. Kempson, Y. Hwu, V. Gajdosik and G. Margaritondo, Opt. Lett., 2011, 36, 1269–1271 CrossRef.
- T. Y. Chen, Y. T. Chen, C. L. Wang, I. M. Kempson, W. K. Lee, Y. S. Chu, Y. Hwu and G. Margaritondo, Opt. Express, 2011, 19, 19919–19924 CrossRef.
- S. S. Kelkar and T. M. Reineke, Bioconjugate Chem., 2011, 22, 1879–1903 CrossRef CAS.
- E. J. Sutton, T. D. Henning, B. J. Pichler, C. Bremer and H. E. Daldrup-Link, Eur. Radiol., 2008, 18, 2021–2032 CrossRef.
- C. C. Chien, I. M. Kempson, C. L. Wang, H. S. Chen, Y. Hwu, N. Y. Chen, T. K. Lee, C. Petibois, K. K. C. Tsai, M. S. Liu, K. Y. Chang, C. S. Yang and G. Margaritondo, Biotechnol. Adv., 2011 DOI:10.1016/j.biotechadv.2011.12.001.
- C. C. Chien, C. H. Wang, C. L. Wang, E. R. Li, K. H. Lee, Y. Hwu, C. Y. Lin, S. J. Chang, C. S. Yang, C. Petibois and G. Margaritondo, Anal. Bioanal. Chem., 2010, 397, 2109–2116 CrossRef CAS.
- C. J. Liu, C. H. Wang, C. C. Chien, T. Y. Yang, S. T. Chen, W. H. Leng, C. F. Lee, K. H. Lee, Y. Hwu, Y. C. Lee, C. L. Cheng, C. S. Yang, Y. J. Chen, J. H. Je and G. Margaritondo, Nanotechnology, 2008, 19, 335604 CrossRef.
- X. Q. Cai, C. L. Wang, H. H. Chen, C. C. Chien, S. F. Lai, Y. Y. Chen, T. E. Hua, I. M. Kempson, Y. Hwu, C. S. Yang and G. Margaritondo, Nanotechnology, 2010, 21, 335604 CrossRef.
- C. H. Wang, T. E. Hua, C. C. Chien, Y. L. Yu, T. Y. Yang, C. J. Liu, W. H. Leng, Y. Hwu, Y. C. Yang, C. C. Kim, J. H. Je, C. H. Chen, H. M. Lin and G. Margaritondo, Mater. Chem. Phys., 2007, 106, 323–329 CrossRef CAS.
- C. H. Wang, C. C. Chien, Y. L. Yu, C. J. Liu, C. F. Lee, C. H. Chen, Y. Hwu, C. S. Yang, J. H. Je and G. Margaritondo, J. Synchrotron Radiat., 2007, 14, 477–482 CrossRef CAS.
- C. H. Wang, C. J. Liu, C. L. Wang, T. E. Hua, J. M. Obliosca, K. H. Le, Y. Hwu, C. S. Yang, R. S. Liu, H. M. Lin, J. H. Je and G. Margaritondo, J. Phys. D: Appl. Phys., 2008, 41, 195301 CrossRef.
- X. Q. Cai, H. H. Chen, C. L. Wang, S. T. Chen, S. F. Lai, C. C. Chien, Y. Y. Chen, I. M. Kempson, Y. Hwu, C. S. Yang and G. Margaritondo, Anal. Bioanal. Chem., 2011, 401, 809–816 CrossRef CAS.
- H. H. Chen, C. C. Chien, C. Petibois, C. L. Wang, Y. S. Chu, S. F. Lai, T. E. Hua, Y. Y. Chen, X. Q. Cai, I. M. Kempson, Y. Hwu and G. Margaritondo, J. Nanobiotechnol., 2011, 9, 14 CrossRef CAS.
- F. K. Huang, W. C. Chen, S. F. Lai, C. J. Liu, C. L. Wang, C. H. Wang, H. H. Chen, T. E. Hua, Y. Y. Cheng, M. K. Wu, Y. Hwu, C. S. Yang and G. Margaritondo, Phys. Med. Biol., 2010, 55, 469–482 CrossRef CAS.
- D. V. Goia and E. Matijevic, Colloids Surf., A, 1999, 146, 139–152 CrossRef CAS.
- X. H. Ji, X. N. Song, J. Li, Y. B. Bai, W. S. Yang and X. G. Peng, J. Am. Chem. Soc., 2007, 129, 13939–13948 CrossRef CAS.
- F. Aldeek, L. Balan, J. Lambert and R. Schneider, Nanotechnology, 2008, 19, 475401 CrossRef.
- A. J. Carmichael, K. Makino and P. Riesz, Radiat. Res., 1984, 100, 222–234 CrossRef CAS.
- K. P. Madden and H. Taniguchi, Free Radical Biol. Med., 2001, 30, 1374–1380 CrossRef CAS.
| This journal is © The Royal Society of Chemistry 2012 |