Simple one-pot fabrication of ultra-stable core-shell superparamagnetic nanoparticles for potential application in drug delivery†
Tapas
Sen
*ab,
Sarah J.
Sheppard
ac,
Tim
Mercer
bd,
Maneea
Eizadi-sharifabad
a,
Morteza
Mahmoudi
ef and
Abdelbary
Elhissi
bc
aCentre for Materials Science, School of Forensic and Investigative Sciences, University of Central Lancashire, Preston, PR1 2HE, United Kingdom. E-mail: tsen@uclan.ac.uk; Tel: +44 1772 89 4371; Fax: +44 1772 89 4981
bInstitute of Nanotechnology and Bioengineering, University of Central Lancashire, Preston, PR1 2HE, United Kingdom
cSchool of Pharmacy and Biomedical Sciences, University of Central Lancashire, Preston, PR1 2HE, United Kingdom
dSchool of Computing Engineering and Physical Sciences, University of Central Lancashire, Preston, PR1 2HE, United Kingdom
eNanotechnology Research Center, Faculty of Pharmacy, Tehran University of Medical Sciences, Tehran, Iran
fNanoBio Interactions Laboratory, National Cell Bank, Pasteur Institute of Iran, Tehran, Iran
First published on 29th March 2012
Abstract
Ultrastable superparamagnetic core-shell nanoparticles of average diameter 80 nm have been fabricated via a simple one-pot method involving superparamagnetic iron oxide nanoparticles (SPIONs) core (∼50 nm in diameter) and lipid bilayer shell by high energy ultrasonication. The surface charges (zeta potentials) were measured to be between −15 mV and + 16 mV depending on the batch composition. Anticancer drug mitomycin C (MMC) was loaded into four different samples of variable surface charges in aqueous solution (pH = 6.8) and released in PBS buffer (pH = 7.2) at room temperature. The kinetics of drug loading and releasing data indicated that the stable lipid bilayer coated SPIONs (LBCSPIONs) of nearly neutral surface exhibited the highest loading (10.9 μg of MMC/mg of materials), whereas uncoated or partially coated SPIONs of positive zeta potential exhibited the lowest loading (2.8 and 3.5 μg MMC/mg of materials, respectively). The release behavior of MMC was observed to be highest (5.8 μg MMC/mg of materials) from materials of negative zeta potential compared to materials of near neutral surfaces (3.68 μg MMC/mg of materials). The plausible mechanism of MMC loading and releasing behavior has been explained based on the electrostatic interaction and diffusion through the lipid bilayers. To ensure biocompatibility, the interaction of the prepared SPIONs with human cervical cancer cell line (HeLa) was also investigated using an MTT (3-(4,5-dimethylthiazol-2-yl)-2,5-diphenyltetrazolium bromide) assay and ROS (reactive oxygen species) production assay and the results confirmed the super-compatibility of LBCSPIONs.
1. Introduction
Superparamagnetic iron oxide nanoparticles (SPIONs) have become increasingly important materials for the quick, easy, sensitive and reliable separation of specific bio-molecules and for magnetic hyperthermia agents in medical diagnosis and therapeutics.1–4 The surface properties and the inter-particle interactions are important in order to have a stable suspension of SPIONs. One of the major problems of working on such nanoparticles is their propensity to aggregate. Surface modification of such nanoparticles in suspension raised an important question: “Does the self-assembled coating of magnetic nanoparticles cover individual particles or agglomerates?”.5 A range of materials6–13 including liposomes14–16 have been used for coating SPIONs for the modification of surface charge and stability against aggregation in suspension. Sen et al.17 have reported the stability of magnetic nanoparticles using commercial dispersing agents; however, they lacked bio-compatibility for in vivo applications such as drug delivery, magnetic hyperthermia and magnetic contrasting due to chemical toxicity of the dispersing agents.Amphiphilic phospholipid molecules in water in the form of liposomes have been well known for drug delivery for a long time18–20 and several review papers21,22 have been published on liposomes. Drugs can be entrapped either in the inner aqueous phase or in the lipid bilayer, depending on their hydrophobicity to hydrophilicity ratio. Similarly SPIONs are also well known in the field of drug delivery23 and contrasting agents. The advantage of using SPIONs as a drug carrier is that they can be transported through the vascular system and can be concentrated at a particular point of the body with the aid of a magnetic field.24 Recently, we have reviewed25 the importance of SPIONs (diameter < 100 nm) for chemotherapy and drug delivery as they can diffuse through the cell membrane. Size, morphology and surface charge are three important parameters for drug-loaded nanoparticles and their behaviour in the blood stream when injected intravenously. Gupta et al.26 have reported that nanoparticles ranging in diameter from 10 to 100 nm are most effective for drug delivery because they can evade reticuloendothelial system (RES) and hence their circulation time in blood can be prolonged. Gabizon et al.27 have reported that incorporating polyethylene glycol (PEG) to liposome bilayer results in inhibition of liposome uptake by the reticulo-endothelial system and significant prolongation of liposome residence time in the blood stream. Fabrication of stable bio-compatible SPIONs of diameter 10–100 nm with specific surface charge and hydrophilicity is a challenge for drug delivery due to their multifunctional properties, i.e. biocompatibility and superparamagnetism.
Magnetoliposomes are new class of nanocomposites for drug delivery28–31 as they are biocompatible and magnetic. However, most of the reports involved larger size (>100 nm) liposomes where magnetite or maghemite nanoparticles have been entrapped and hence could have serious diffusional limitation. So it is always desirable to fabricate biocompatible SPIONs under 100 nm in diameter especially for in vivo applications.26
Mitomycin C (MMC) is a molecule that has an anticancer activity and previously been entrapped in liposomes.32 Tokunaga et al.33 have reported the release of MMC into the blood stream through intravenous injection. Mitomycin C is a potent antibiotic-antineoplastic drug for ocular surgery, however it suffers due to ocular toxicity. Chetoni et al.34 have reported that liposomal preparation containing mitomycin C was capable of reducing the corneal healing rate and drug toxicity of a corneal lesion in a rabbit model. Zalipsky et al.35 have reported that mitomycin-C-loaded STEALTH liposome (SL) has enhanced antitumor activity compared to pure mitomycin C, pure doxorubicin or doxorubicin-loaded SL. Recently, Cheung et al. have reported36 the dextran-based microspheres for a loading and release study of mitomycin C. So far no reports are available on loading and release data on core-shell biocompatible SPIONs of diameter less than 100 nm.
Herein is the first study that reports the fabrication of core-shell nanoparticles of average diameter 80 nm via a simple one step coating method involving SPIONs core and lipid bilayer shell by high energy ultrasonication for in vitro loading and release study of mitomycin C under physiological pH. Moreover, the biocompatibility of the SPIONs were probed on human cervical cancer cell line (HeLa) using MTT (3-(4,5-dimethylthiazol-2-yl)-2,5-diphenyltetrazolium bromide) assay and ROS (reactive oxygen species) production assay.
2. Experimental
2.1 Materials
Chloroform was purchased from VWR, UK and soya phosphatidylcholine (SPC) was a gift by Lipoid, Switzerland. All other chemicals were purchased from Sigma-Aldrich and used without further purification.2.2 Methods
Multilamellar liposomes (MLVs) were prepared by dissolving 270 mg of SPC phospholipid in 1 ml chloroform within a 500 mL round bottom flask. The flask containing the phospholipid solution was attached to a rotary evaporator (Buchi Rotavapor R-114, Buchi, Switzerland) and immersed in a 35 °C water bath. Upon evaporation of chloroform, a thin film of lipid formed on the inner wall of the flask. The flask was then flushed with nitrogen gas in order to remove chloroform residue, if any. The film was hydrated with 27 mL of deionized water and shaken manually for 10 min followed by annealing for 2 h at room temperature before it can be used for the preparation of LBCSPIONs. LBCSPIONs suspensions were prepared by mixing SPIONs of various amounts (see Table 1) with the MLV dispersions. The mixture was then placed under strong ultrasonic vibration (titanium horn) for 8 min using a Vibra Cell Sonicator (Sonics and Materials Inc., USA). The mixtures were repeatedly cooled using ice bath during the ultrasonication.
| Batch No | Concentration of prefabricated bare SPIONs (mg mL−1) in the final mixture | Amount of prefabricated multilamellar vesicles (MLV) in mL | Total volume of the suspension during the fabrication process | Visual observation (physical stability in suspension) |
|---|---|---|---|---|
| SS068 | 5 | 0 | 7 | Unstable |
| SS067 | 0.5 | 7 | 7 | Moderately stable |
| SS063 | 2.5 | 7 | 7 | Stable |
| SS069 | 5 | 7 | 7 | Stable |
| SS070 | 10 | 7 | 7 | Moderately stable |
| SS073 | 15 | 7 | 7 | Unstable |
| SS065 | 1.25 | 2.24 | 7 | Stable |
![[thin space (1/6-em)]](https://www.rsc.org/images/entities/char_2009.gif) 000 cells per well in 150 μL of medium and incubated for 24 h. Cells were cultured in Dulbecco's modified Eagle's medium (DMEM) supplemented with 10% fetal bovine serum (FBS) at 37 °C in a 5% CO2 incubator. It is well recognised that the conventional in vitro examination method may contain large errors due to the fact that nanoparticles can cause significant changes in the cell medium, such as adsorption/denaturation of proteins.38,39 In order to obtain reliable and reproducible results, the modified cytotoxicity method was employed.40,41 After the 24 h incubation period, 40 μL of medium containing various concentrations of SPIONs (i.e. 125, 250, and 500 μg ml−1) was added to the wells, and cells were incubated for additional periods ranging from 12 h. Control cells were incubated with the same culture medium without particles. All particle concentrations and controls were each seeded in ten separate wells. Cytotoxicity was assessed using the MTT (3-(4,5-dimethylthiazol-2-yl)-2,5-diphenyltetrazolium bromide) and ROS (reactive oxygen species) assay.
000 cells per well in 150 μL of medium and incubated for 24 h. Cells were cultured in Dulbecco's modified Eagle's medium (DMEM) supplemented with 10% fetal bovine serum (FBS) at 37 °C in a 5% CO2 incubator. It is well recognised that the conventional in vitro examination method may contain large errors due to the fact that nanoparticles can cause significant changes in the cell medium, such as adsorption/denaturation of proteins.38,39 In order to obtain reliable and reproducible results, the modified cytotoxicity method was employed.40,41 After the 24 h incubation period, 40 μL of medium containing various concentrations of SPIONs (i.e. 125, 250, and 500 μg ml−1) was added to the wells, and cells were incubated for additional periods ranging from 12 h. Control cells were incubated with the same culture medium without particles. All particle concentrations and controls were each seeded in ten separate wells. Cytotoxicity was assessed using the MTT (3-(4,5-dimethylthiazol-2-yl)-2,5-diphenyltetrazolium bromide) and ROS (reactive oxygen species) assay.
3. Results and discussion
LBCSPIONs (see Table 1) were stable in suspension (see Fig. 1a) up to the concentration of 10 mg mL−1 of SPIONs during the fabrication. Bare SPIONs (SS068) were unstable even after strong ultrasonication. Increasing the SPIONs concentration from 10 mg mL−1 to 15 mg mL−1 containing the same concentration of MLVs during the fabrication produced unstable suspensions (SS073).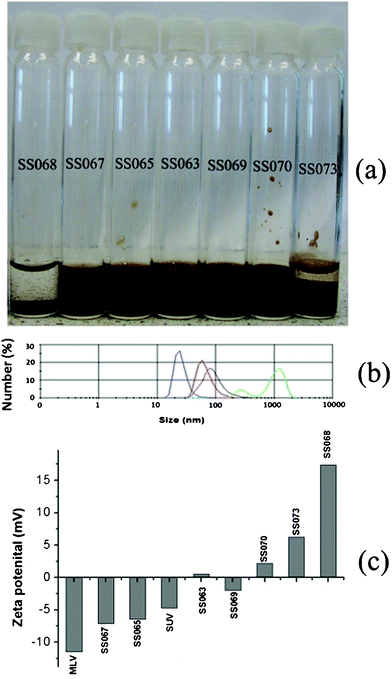 | ||
| Fig. 1 (a) Photographs of various samples (b) size distribution of bare SPIONs after ultrasonication (red), MLV before (green) and after (blue) ultrasonication and LBCSPIONs SS069 (black); (c) zeta potential data of various samples | ||
Fig. 1b represents the particle size distribution of bare SPIONs (SS068), MLVs before and after the ultrasonication and LBCSPIONs (SS069). MLVs before the ultrasonication exhibited a bimodal distribution with particle size ranging from 300 nm to few microns, however monomodal distribution of a size around 30 nm was observed after high energy ultrasonication of the MLVs. Bare SPIONs exhibited a monomodal size distribution of peak centered at around 50 nm. LBCSPIONs (SS069) exhibited a monomodal size distribution of peak centered at approximately 80 nm, indicating a clear shift in the size distribution of SPIONs after coating with the phospholipid bilayer. Fig. 1c presents the zeta potential data of SPIONs and LBCSPIONs. Bare SPIONs exhibited a positive zeta potential whereas MLVs before and after ultrasonication exhibited negative zeta potential values. Coating SPIONs with lipid bilayer decreases the zeta potential from positive to negative values depending on the concentration of SPIONs in solution during the fabrication of LBCSPIONs. Low values of zeta potential were observed on stable LBCSPIONs with optimum concentration of SPIONs in suspension (SS063, 069 and 070). This data indicates that the SPIONs were coated with phospholipid up to an optimum SPIONs concentration and the surface charge of the nanoparticles reversed by coating with lipid.
Transmission electron micrographs (see left panel of Fig. 2) exhibited that bare SPIONs were spherical in morphology of sizes ranging from 30–60 nm in diameter with powder X-ray diffraction peaks (220, 311, 400, 440) of fingerprint of pure magnetite (Fe3O4) in the 2θ range 30 to 75° (see Fig. S3 in ESI†). The low intensity of the peaks is an indication of ultrasmall size of magnetite. Almost closed hysteresis loops with negligible coercivity were observed, which is indicative of the superparamagnetic nature of the iron oxide nanoparticles before and after coating with lipid bilayer (see right panel of Fig. 2). The coating of lipid bilayer had little effect on the saturation magnetization value (∼60 emu g−1).
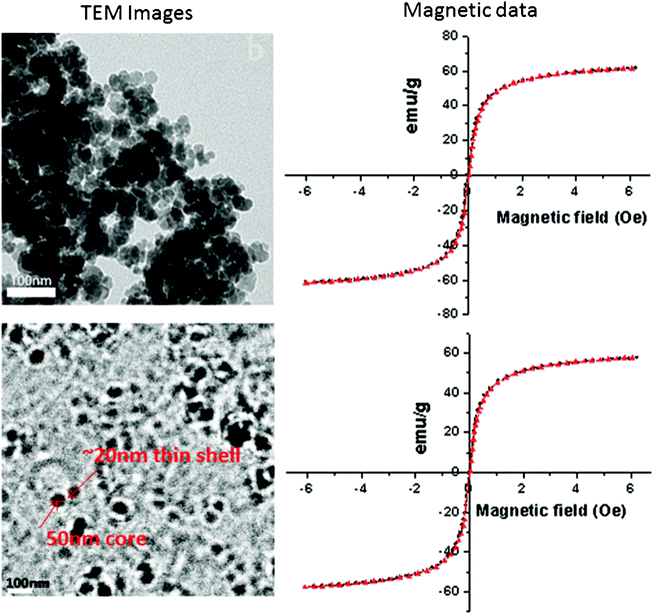 | ||
| Fig. 2 TEM (left panel) of uncoated SPIONs (SS068) at top, LBCSPIONs (SS069) at the bottom; magnetic data (right panel) of bare SPIONs (SS068) at the top and LBCSPIONs (SS069) at the bottom | ||
The uptake of MMC from the solution was plotted against time and presented in Fig. 3a. It was observed that the bare SPIONs (SS068) or LBCSPIONs (SS073) exhibited low uptake values (<12%) of MMC from the solution. The highest uptake (∼43%) of MMC was observed for SS069 whereas SS065 exhibited an intermediate uptake value (∼32%). Saturation of MMC uptake was observed after 24 h of incubation for all samples except for SS065 which exhibited a near saturation of MMC uptake after around 6 h of incubation. SS069 exhibited MMC uptake in two steps. A low uptake value (<10%) was observed in the first seven hours of incubation whereas the uptake value increased to saturation (42%) at 24 h of incubation. The behavior of MMC uptake in four different materials can be explained based on the interaction of MMC and the nanoparticles surface due to their different surface charges (see later).
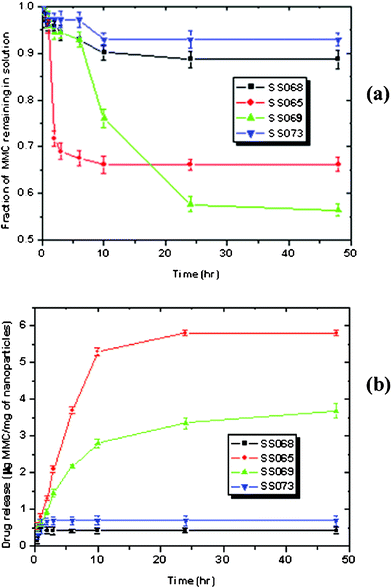 | ||
| Fig. 3 Kinetics of MMC load (a) and release (b) to and from bare SPIONs and LBCSPIONs | ||
When MMC uptake values from four different samples were converted to MMC loading in μg per mg of nanoparticles (see Table S1 in ESI†), it was observed that SS069 exhibited the highest loading (∼11 μg mg−1) at saturation point after 24 h of incubation whereas SS065 exhibited an intermediate value (∼8 μg mg−1). Bare SPIONs (SS068) exhibited the lowest MMC loading (2.8 μg mg−1) and unstable LBCSPIONs (SS073) exhibited slightly higher loading value (3.5 μg mg−1).
Table S2 in ESI presents the MMC releasing data from four different materials in PBS buffer (pH = 7.2) at 25 °C. The amount of MMC released (μg) per mg of nanoparticles were plotted against time (Fig. 3b). MMC release in solution quickly reached to a saturation value within two hours for both the bare SPIONs (SS068) and the unstable LBCSPIONs (SS073) and the values were calculated to be 0.43 and 0.7 μg mg−1, respectively. These values were calculated to be 15.4 and 20% of the loaded MMC in SS068 and SS073 respectively. The quick and low percentage of MMC release from SS068 and SS073 indicate these materials could be poor candidates for drug delivery application. These materials were also observed to be unstable as a suspension (see Fig. 1a) due to the aggregation of nanoparticles and, hence, can be considered unsuitable for in vivo application due to diffusional restriction through reticulo-endothelial system.
SS065 exhibited the highest (∼6 μg mg−1) MMC release and calculated to be 71% of the loaded MMC in SS065. This was achieved within 10 h of incubation (Fig. 3b). SS069 exhibited a gradual release of MMC up to 34% of the loaded drug after 48 h of incubation. The amount of MMC released from SS069 was calculated to be 3.7 μg mg−1 after 48 h of incubation. The highest loading of MMC in SS069 and the slow release could make this material a potential candidate for this drug delivery application in the in vivo context as they are stable against the aggregation, biocompatible and superparamagnetic in nature.
Bare SPIONs exhibited a characteristic peak (Fig. 4a) at 582 cm−1 due to Fe–O stretching in magnetite (Fe3O4), however LBCSPIONs (SS069) exhibited several additional peaks (Fig. 4b) in the region of 800 to 3500 cm−1 indicating the presence of lipid bilayer on SPIONs. Peaks at 2853 and 2922 cm−1 are the characteristics of C–H stretching of organic tail groups. Peaks at 1725 cm1 and 1052 cm−1 are characteristics of C![[double bond, length as m-dash]](https://www.rsc.org/images/entities/char_e001.gif) O stretching of aldehyde and ester groups respectively.
O stretching of aldehyde and ester groups respectively.
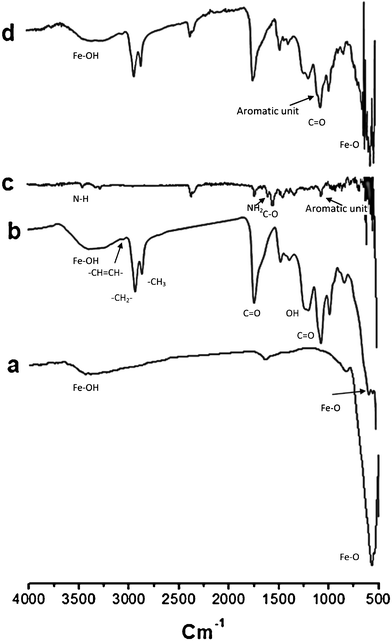 | ||
| Fig. 4 FT-IR spectra of various samples: pure magnetite nanoparticles SS068 (a); bi-layer coated SS069 (b); dry mitomycin C (c); and mitomycin C loaded SS069 (d). | ||
The effect of lipid bilayer shell in LBCSPIONs after MMC release has also been studied by FT-IR (Fig. 4d). Fig. 4c presents the FT-IR spectrum of pure MMC. Several peaks were observed in the region of 1000 to 3500 cm−1 with poor intensity. Peaks at 3200 to 3400 cm−1 are characteristic of MMC reported by Hou et al.44 Peaks in the region of 1500 to 1700 cm−1 are characteristic of C![[double bond, length as m-dash]](https://www.rsc.org/images/entities/char_e001.gif) O stretching and N–H bending due to the presence of amide group. This is consistent with the structure of mitomycin C (see Fig. 5). The FT-IR spectrum of LBCSPIONs was nearly unchanged after MMC release study indicating that the lipid bilayer shell or the SPIONs core was unaffected after MMC loading and release.
O stretching and N–H bending due to the presence of amide group. This is consistent with the structure of mitomycin C (see Fig. 5). The FT-IR spectrum of LBCSPIONs was nearly unchanged after MMC release study indicating that the lipid bilayer shell or the SPIONs core was unaffected after MMC loading and release.
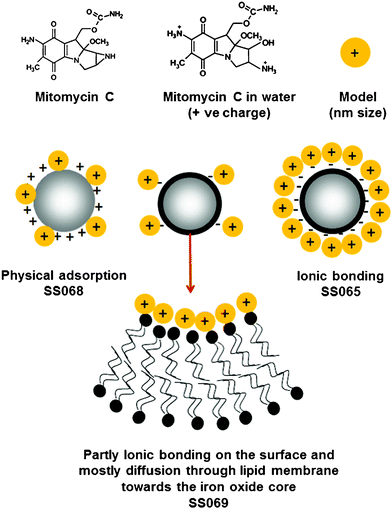 | ||
| Fig. 5 Schematic representation of the structure of MMC and the interactions between MMC and surfaces of bare SPIONs and LBCSPIONs. | ||
Fig. 6 and 7 present the MTT assay and ROS data of HeLa cells. The results clearly show significant differences between various nanoparticles. According to the results, one can conclude that the core material (i.e. sample SS068) has lower biocompatibility value in comparison to the coated particles; the main reason is the creation of free radicals by the bare surface of SPIONs,45 which has also been confirmed by ROS results. Moreover, it was found that the produced amount of ROS in SS069-treated cells is lower than SS063 and SS068, resulting in higher compatibility of SS069 compared to uncoated SS068.
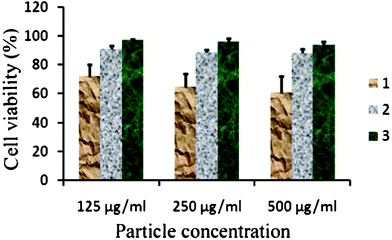 | ||
| Fig. 6 MTT assay values for HeLa cells incubated with various concentrations of different SPIONs. 1: SS068, 2:SS063, 3:SS069. | ||
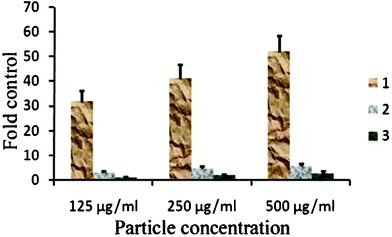 | ||
| Fig. 7 Produced ROS in the HeLa cells after incubation with various concentrations of different SPIONs. 1: SS068, 2:SS063, 3:SS069. | ||
Chemical structure of MMC is reported36 to contain an aziridine ring which opens and forms a primary amine and hydroxyl groups by hydrolysis in water (Fig. 5). Primary amine groups later form NH3+ ions in water and the resultant molecule can be a positively charged species. Loading and releasing MMC to and from LBCSPIONs can be explained based on the interactions between the surface of the nanoparticles and the MMC molecules. These interactions could be described as (i) electrostatic (ionic type), (ii) physical anchoring, and (iii) diffusion through the lipid membrane. Electrostatic interactions could be either attractive (oppositely charged) or repulsive (similarly charged). MMC is positively charged; hence it can be easily bound to the negatively charged surface, resulting in a high loading of MMC. Similarly, positively charged surfaces can be poor for MMC loading due to the repulsive interaction. Electrostatic interactions could dominate the MMC loading behavior; however, diffusion could be a principal pathway for neutral or low surface charge. Diffusion of MMC through the lipid membrane could be a slow process hence loading and release of MMC to and from the surface could have different profile compared to electrostatic interaction. Surface of bare SPIONs (SS068) and LBCSPIONs (SS073) were measured to be positively charged hence a low MMC loading was observed (see Tables S1 and S2 in ESI†) due to the repulsive interaction. A low loading value with quick saturation time could be explained based on the physical adsorption of MMC by anchoring to the surface of SS068. Release behavior of MMC from the surface was observed to be quick indicating no diffusion of MMC through the surface. Quick saturation times during the MMC loading (Fig. 3a) and release (Fig. 3b) to and from LBCSPIONs (SS065) with high percentage of MMC release indicate the interaction of MMC and surface of SS065 could be an electrostatic attractive type (ionic bonding). In water, positively charged MMC can be easily bound to the negatively charged surface of SS065, and can easily be released in the presence of negatively charged phosphate ions in PBS solution.
The surface of LBCSPIONs (SS069) was observed to have a weak negative charge (Fig. 2b), resulting a different pattern of MMC loading and release to and from SS069. A high value of MMC loading with a slower rate (Fig. 3a) indicates that the loading of MMC could be dominated by diffusion of MMC through the membrane due to the strong affinity of drug molecules towards the core magnetite (iron oxide surfaces). Similarly, a low (34%) and slow MMC release profile confirms that the MMC molecules could be entrapped.
4. Conclusions
A series of lipid bilayer coated superparamagnetic nanoparticles (LBCSPIONs) were fabricated by a simple method using high energy ultrasonication for eventual applications in in vivo drug delivery. Loading and releasing of drug (mitomycin C) to and from the LBCSPIONs were related to the surface charges and did not have any effect on the lipid bilayer structure evidenced from FT-IR data. The super-compatibility of LBCSPIONs samples together with their suitable diameters (<100 nm) and slow drug release could introduce them as promising new magnetic materials for in vivo drug delivery.Acknowledgements
SJS thank to the Learning and Development Unit (LDU) of the University of Central Lancashire for funding a summer internship (2009) to perform part of this work. We also thank to Lipoid, Switzerland, for supplying us soya phosphatidylcholine (SPC).References
- Q. A. Pankhurst, J. Connoll, S. K. Jones and J. Dobson, J. Phys. D: Appl. Phys., 2003, 36, R167 CrossRef CAS.
- R. Langer and D. A. Tirrell, Nature, 2004, 428, 487 CrossRef CAS.
- J. M. Perez, Nat. Nanotechnol., 2007, 2, 535 CrossRef CAS.
- T. Sen, A. Sebastianelli and I. J. Bruce, J. Am. Chem. Soc., 2006, 128, 7130 CrossRef CAS.
- R. Prozorov, T. Porozorov and A. Gedanken, Adv. Mater., 1998, 10, 1529 CrossRef.
- A. P. Philipse, M. P. B. Vanbruggen and C. Pathmamanoharan, Langmuir, 1994, 10, 92 CrossRef CAS.
- I. J. Bruce, J. Taylor, M. Todd, M. J. Davies, E. Borioni, C. Sangregorio and T. Sen, J. Magn. Magn. Mater., 2004, 284, 145 CrossRef CAS.
- T. Sen and I. J. Bruce, Microporous Mesoporous Mater., 2009, 120, 246 CrossRef CAS.
- H. L. Liu, S. P. Ko, J. H. Wu, M. H. Jung, J. H. Min, J. H. Lee, B. H. An and Y. K. Kim, J. Magn. Magn. Mater., 2007, 310, e815 CrossRef CAS.
- B. R. Jarrett, M. Frendo, J. Vogan and A. Y. Louie, Nanotechnology, 2007, 18, 035603 CrossRef.
- D. K. Kim, M. Mikhaylova, F. H. Wang, J. Kehr, B. Bjelke, Y. Zhang, T. Tsakalakos and M. Muhammed, Chem. Mater., 2003, 15, 4343 CrossRef CAS.
- M. Brahler, R. Georgieva, N. Buske, A. Muller, S. Muller, J. Pinkernelle, U. Teichgraber, A. Voigt and H. Baumler, Nano Lett., 2006, 6, 2505 CrossRef CAS.
- B. Gaihre, M. S. Khil, D. R. Lee and H. Y. Kim, Int. J. Pharm., 2009, 365, 180 CrossRef CAS.
- S. Pauser, R. Reszka, S. Wagner, K. J. Wolf, H. J. Buhr and G. Berger, Anti-Cancer Drug, 1997, 12, 125 CAS.
- P. Pradhan, J. Giri, R. Banerjee, J. Bellare and D. Bahadur, J. Magn. Magn. Mater., 2007, 311, 208 CrossRef CAS.
- M. Meincke, T. Schlorf, E. Kossel, O. Jansen, C. C. Glueer and R. Mentlein, Front. Biosci., 2008, 13, 4002 CrossRef CAS.
- T. Sen, S. Magdassi, G. Nizri and I. J. Bruce, Micro Nano Lett., 2006, 1(1), 39–42 CAS.
- M. Mezei and V. Gulasekharam, Life Sci., 1980, 26, 1473 CrossRef CAS.
- R. L. Juliano, Trends Pharmacol. Sci., 1981, 2, 39 CrossRef CAS.
- G. Poste, C. Bucana, A. Raz, P. Bugelski, R. Kirsh and I. J. Fidler, Cancer Res., 1982, 42, 1412 CAS.
- T. M. Allen, Drugs, 1997, 54, 8 CrossRef CAS.
- W. T. Al-Jamal and K. Kostarelos, Nanomedicine, 2007, 2, 85 CrossRef CAS.
- S. Goodwin, C. Peterson, C. Hoh and C. J. Bittner, J. Magn. Magn. Mater., 1999, 194, 132–139 CrossRef CAS.
- P. Tartaj, M. D. Morales, S. Veintemillas-Verdaguer, T. Gonzalez-Carreno and C. J. Serna, J. Phys. D: Appl. Phys., 2003, 36, R182 CrossRef CAS.
- M. Mahmoudi, S. Sant, B. Wang, S. Laurent and T. Sen, Adv. Drug Delivery Rev., 2011, 63, 24–46 CrossRef CAS.
- A. K. Gupta and M. Gupta, Biomaterials, 2005, 26, 3995 CrossRef CAS.
- A. A. Gabizon, H. Shmeeda and S. Zalipsky, J. Liposome Res., 2006, 16, 175 CrossRef CAS.
- M. De Cuyper, S. J. H. Soenen, K. Coenegrachts and L. Ter Beek, Anal. Biochem., 2007, 367, 266 CrossRef CAS.
- R. J. Mart, K. P. Liem and S. J. Webb, Pharm. Res., 2009, 26, 1701 CrossRef CAS.
- S. J. H. Soenen, J. Cocquyt, L. Defour, P. Saveyn, P. Van Der Meeren and M. De Cuyper, Mater. Manuf. Processes, 2008, 23, 611 CrossRef CAS.
- S. J. H. Soenen, E. Illyes, D. Vercauteren, K. Braeckmans, Z. Majer, S. C. De Smedt and M. De Cuyper, Biomaterials, 2009, 30, 6803 CrossRef CAS.
- H. Sasaki, Y. Takakura, M. Hashida, T. Kimura and H. Sezaki, J. Pharmacobio-Dyn., 1984, 7, 120 CrossRef CAS.
- Y. Tokunaga, T. Iwasa, Y. Tokunaga, T. Iwasa, J. Fujisaki, S. Sawai and A. Kagayama, Chem. Pharm. Bull., 1988, 36, 3557 CrossRef CAS.
- P. Chetoni, S. Burgalassi, D. Monti, M. Najarro and E. Boldrini, J. Drug Deliv. Sci. Technol., 2007, 17, 43 CAS.
- S. Zalipsky, S. Saad, R. Kiwan, E. Ber, N. Yu and T. Minko, J. Drug Targeting, 2007, 15, 518 CrossRef CAS.
- R. Y. Cheung, Y. M. Ying, A. M. Rauth, N. Marcon and X. Y. Wu, Biomaterials, 2005, 26, 5375 CrossRef CAS.
- R. Massart, E. Dubois, V. Cabuil and E. Hasmonay, J. Magn. Magn. Mater., 1995, 149, 1 CrossRef CAS.
- M. Mahmoudi, I. Lynch, M. R. Ejtehadi, M. P. Monopoli, F. B. Bombelli and S. Laurent, Chem. Rev., 2011, 111, 5610 CrossRef CAS.
- .S. Sharifi, S. Behzadi, S. Laurent, M. L. Forrest, P. Stroeve and M. Mahmoudi, Chem. Soc. Rev., 2012, 41, 2323 RSC.
- S. Laurent, C. Burtea, C. Thirifays, U. O. Häfeli and M. Mahmoudi, PLoS One, 2012, 7, e29997, DOI:10.1371/journal.pone.0029997.
- M. Mahmoudi, A. Simchi, M. Imani, M. A. Shokrgozar, A. S. Milani, R. Hafeli and P. Stroeve, Colloids Surf., B, 2010, 75, 300 CrossRef CAS.
- M. Mahmoudi, A. Simchi, M. Imani, A. S. Milani and P. Stroeve, Nanotechnology, 2009, 20, 225104 CrossRef.
- S. Bolton, Pharmaceutical statistics: Practical and clinical applications, 2nd edn,Marcel Dekker, New York, 1990 Search PubMed.
- Z. Hou, H. Wei, Q. Wang, Q. Sun, C. Zhou, C. Zhan, X. Tang and Q. Zhang, Nanoscale Res. Lett., 2009, 4, 732 CrossRef CAS.
- M. Mahmoudi, H. Hofmann, B. R. Rutishauser and A. P. Fink, Chem. Rev., 2012, 112, 2323 CrossRef CAS.
Footnote |
| † Electronic supplementary information (ESI) available: Standard curves for concentration of mitomycin C vs. absorbance at 365 nm in water (Fig. S1) and PBS buffer (Fig. S2). XRD pattern of bare SPIONs (Fig. S3), Tables S1 and S2. See DOI: 10.1039/c2ra20199b |
| This journal is © The Royal Society of Chemistry 2012 |
