Preparation of poly(ethylene glycol) methacrylate coated CuInS2/ZnS quantum dots and their use in cell staining
Adi
Permadi
a,
Mochamad Zakki
Fahmi
a,
Jem-Kun
Chen
b,
Jia-Yaw
Chang
*ac,
Chun-Yi
Cheng
a,
Guo-Quan
Wang
a and
Keng-Liang
Ou
*cde
aDepartment of Chemical Engineering, National Taiwan University of Science and Technology, Section 4, #43, Keelung Road, Taipei, 106, Taiwan, ROC. E-mail: jychang@mail.ntust.eu.tw; Fax: +886-2-27376644; Tel: +886-2-27303636
bDepartment of Materials Science and Engineering, National Taiwan University of Science and Technology, Taipei, Taiwan, ROC
cResearch Center for Biomedical Devices, Taipei Medical University, 250 Wu Hsing Street, Taipei, 110, Taiwan, ROC. E-mail: klou@tmu.edu.tw
dResearch Center for Biomedical Implants and Microsurgery Devices, Taipei Medical University, 250 Wu Hsing Street, Taipei, 110, Taiwan, ROC
eDepartment of Biomedical Materials and Tissue Engineering, College of Oral Medicine, Taipei Medical University, 250 Wu Hsing Street, Taipei, 110, Taiwan, ROC
First published on 25th April 2012
Abstract
A simple synthesis of poly(ethylene glycol) methacrylate (PEGMA) coated CuInS2/ZnS quantum dots (QDs) has been developed. X-ray diffraction, transmission electron microscopy, and atomic force microscopy observations demonstrated that uniform CuInS2/ZnS QDs were successfully prepared. Fourier transform infrared spectroscopy indicated no new peak after the coating process, indicating that only physical interactions occurred during coating and that PEGMA did not disturb the crystal structure of the CuInS2/ZnS QDs. After PEGMA coating, the photoluminescence spectra of the CuInS2/ZnS QDs red shifted (from 566 nm to 589 nm) and the QD particle size increased. The concentration and molecular weight of PEGMA play important roles in the water solubility and hydrodynamics of the particles. The PEGMA-coated CuInS2/ZnS QDs showed stable emissions for up to 3 weeks. As a demonstration of a potential biomedical application, PEGMA-coated CuInS2-ZnS QDs were used in labeling human liver carcinoma (HepG2) tumor cells.
1. Introduction
Quantum dots (QDs) are semiconducting materials with physical dimensions smaller than the exciton Bohr radius and have unique electronic properties. QDs, generally synthesized with II–IV or III–V elements of the periodic table, have potential biological applications in biological labeling, nano diagnostics, imaging, targeted drug delivery, and photodynamic therapy.1–3 For a QD to be useful in biological imaging, it must be nontoxic and water soluble. It has been reported that QDs can accumulate in the kidney, liver, and spleen for several months after systemic administration.4–6 Since QDs contain toxic materials, understanding the toxicity mechanisms from animal and human bodies must soon become a prominent area of inquiry. Recent studies have indicated that even though QDs did not affect cell morphology, they might change the expression of specific genes. Therefore, the potential risk at the molecular level and the long-term effects of QDs on humans and the environment should be recognized and evaluated extensively. For example, QDs composed of CdS, CdSe, and CdTe have appealing optical properties, but the intrinsic toxicity of Cd has put their future applicability in doubt. Potential alternatives to these QDs are the I–III–VI ternary semiconductor nanocrystals, which are of particular interest for the formation of QDs because they are direct-band-gap semiconductors with high extinction coefficients in the visible-to-near-infrared region and contain no highly toxic elements. Among the I–III–VI semiconductor nanocrystals, CuInS2 has a band gap of 1.45 eV and can be an efficient, stable, and tunable emissive material in the red and near-infrared (NIR) windows, approximately between 600 and 1100 nm.7–9 NIR emission is an ideal property for biological imaging; human tissue has an absorbance window between 700 and 1100 nm, which makes labels that can emit in the NIR particularly important.So far, CuInS2 QDs are mostly synthesized in an organic phase using high-boiling-point solvents, and they display good monodispersity and photoluminescence. However, these QDs are generally capped with hydrophobic capping ligands. Therefore, they are not soluble in the aqueous phase and not compatible with biological systems. To dissolve QDs in aqueous solvents, it is important to change the surface nature from hydrophobic to hydrophilic. The ideal biocompatible QD must fulfill many criteria, such as being colloidally stable in aqueous solvents, exhibiting pH and salt stability, showing high selectivity of specific binding to biological components, having a small hydrodynamic diameter and being receptive to the introduction of chemical functionality to the QD surface to help connect with various chemicals and biomolecules.10,11 Three main techniques for generating biocompatible nanocrystals have been developed: (i) ligand exchange, (ii) silica encapsulation into a water-soluble shell, and (iii) surface coating with a polymer.12,13 Now, because hydrophilic surface treatments are being developed for QDs, their application is spreading quickly to the field of bioimaging.14 Furthermore, the polyethylene glycol (PEG) functional group has been shown to reduce nanoparticle aggregation, reduce nonspecific binding in vivo, and significantly extend blood circulation time.15
In this study, a simple synthesis of poly(ethylene glycol) methacrylate (PEGMA) coated CuInS2/ZnS QDs was developed. Different concentrations and molecular weights of PEGMA and various combinations of Igepal and PEGMA were applied to examine the coating efficiency. In addition, PEGMA-coated CuInS2/ZnS QDs were used in the labeling of human liver carcinoma (HepG2) tumor cells.
2. Experimental
2.1 Materials
Copper acetate (CuAc, 99.995%), Zinc stearate (ZS, 90%), 1-dodecanethiol (DDT,97%), 1-octadecene (ODE, 90%), polyoxyethylene nonylphenylether (Igepal CO-520 and CO-630) and Poly (ethylene glycol) methacrylate (PEGMA, Mn~360 and Mn~526) were purchased from Sigma-Aldrich (Milwaukee, WI, USA) and Indium acetate (InAc, 99.98%) was purchased from Alfa-Aesar (Ward Hill, MA, USA). Zinc chloride (90%) was purchased from Riedel-deHaen AG (Seelze, Germany), All the organic solvents were purchased from EM-Sciences. All the chemicals were used directly without further purification.2.2 Synthesis of CuInS2/ZnS QDs
A mixture of 0.0245 g Cu(Ac)2, 0.17517 g In(Ac)3, 2.5 mL DDT and 5 mL ODE was stirred and purged in a nitrogen atmosphere. After conditioning at 40 °C for 1 h, the mixture was heated moderately up to 240 °C, which led to the formation of a reddish orange solution. Another mixture, made by mixing 0.031 g ZE in 1 mL toluene, 0.1 mL DMF and 0.504 g of ZS in 3 mL ODE, was swiftly injected into the boiling solution. After the injection was complete, the reaction mixture was cooled to room temperature, followed by centrifugation at 6000 rpm for 20 min. The supernatant was then discarded. The precipitate was redispersed in chloroform under sonication and precipitated by the addition of methanol, followed by 20 min of centrifugation at 6000 rpm. The supernatant, which contained unreacted material, was discarded, and the remaining precipitate was then redispersed in hexane.2.3 Preparation of PEGMA-coated CuInS2/ZnS QDs
The surface modification was started by mixing 5 mg of CuInS2/ZnS QDs with 1 mL of Igepal CO-520 and 11.3 mL of cyclohexane in a flask, followed by sonication for 1 min. Afterwards, the solution was mixed for 10 min and then PEGMA solution (540 μL of PEGMA, Mn∼360, dissolved in 100 μL water) was introduced into the solution and stirred for 1 h. In the next step, ethanol was added to the solution until 45 mL, followed by centrifugation at 6000 rpm for 30 min. The supernatant containing the surfactant and cyclohexane was discarded. Meanwhile, 3 mL water was added to the precipitate on the wall of the centrifuge bottle, followed by centrifugation at 6000 rpm for 10 min. Finally, the supernatant, CuInS2/ZnS QDs in the water phase, was passed through a 0.45 μm nylon filter and a 0.22 μm nylon filter. The procedure was repeated for different combinations of Igepal CO-630 and PEGMA (Mn~526).2.4. Cell culture and observation of the intracellular location of QDs in HepG2 cells
The HepG2 cells were cultured in Eagle's Minimum Essential Medium (containing 1.5 g L−1 sodium bicarbonate) supplemented with 1% L-glutamine, 1% antibiotic antimycotic formulation, and 10% fetal bovine serum (FBS). For cell expansion and senescence induction, the cells were cultured in a humidified 5% CO2 atmosphere at 37 °C. HepG2 cells were seeded in a six-well chamber slide (Nalge Nunc, Naperville, IL) with one piece of cover glass at the bottom of each well at a density of 1 × 10⁵ cells per well in 500 μL of complete medium (RPMI-1640 medium) and incubated for 24 h at 37 °C. Five milliliters of the PEGMA-coated CuInS2/ZnS QDs were added to the cells at a concentration of 50 μg mL−1. After 1 h, the cells were washed with phosphate buffered saline (PBS), fixed with 4% paraformaldehyde, and stained with DAPI (1 μg mL−1 in PBS, Roche). The fluorescence images were acquired by confocal laser scanning microscopy (CLSM) (LSM 510 META, Carl Zeiss, Germany).2.5 Characterization
Transmission electron microscopy (TEM) observation was performed by field-emission TEM on a Philips Tecnai G2 F20 microscope (Philips, Holland) operating at an accelerating voltage of 200 kV. The TEM specimen was prepared by dropping the QD solution onto carbon-coated nickel grids by slowly evaporating the solvent in air at room temperature. Atomic force microscopy (AFM) analysis was conducted using an SPM-9600 scanning probe microscope (Shimadzu Co.) in dynamic mode at room temperature. Dynamic light scattering (DLS) data was collected using a Malvern instrument Zetasizer Nanoseries 3000 HS with He/Ne at a 90° scattering angle. X-Ray diffraction (XRD) samples were prepared by depositing the nanocrystals on a Si(100) wafer; XRD measurements were performed by a Rigaku 18 kW rotating anode source X-ray diffractometer with the Cu Kα1 line (λ = 1.54 Å). UV-vis absorption spectra were measured with a JASCO V-670 spectrometer. The measurements of the PL spectra were carried out by using a JASCO FP-6500 spectrofluorometer equipped with a 150 W xenon lamp. Cell imaging was performed on a Leica TCS SP2 inverted confocal microscope (Leica Microsystems) equipped with a 63 × 1.32 NA oil immersion objective (Leica Microsystems). Images were obtained by illuminating the samples with the in-line Ar (488 nm) and He–Ne (543, 633 nm) lasers of the microscope and with a 405 nm Violet laser.3. Results and discussion
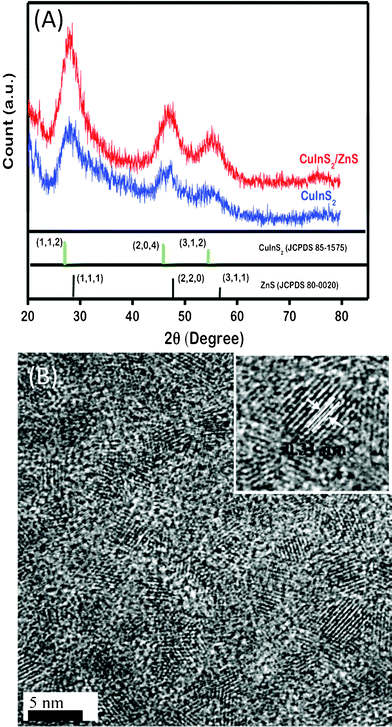
Fig. 1A shows powder XRD patterns of the CuInS2 QDs. The diffraction peaks match well with the standard data of chalcopyrite-type CuInS2 with tetragonal lattice parameters of a = 5.522 Å and c = 11.13 Å (JCPDS card No. 85-1575), indicating that single-phase CuInS2 QDs with chalcopyrite structure have been fabricated. Similar features are observed for CuInS2/ZnS QDs, but all peaks exhibited a shift to larger angles, closer to the characteristic peak positions of bulk cubic ZnS, which could result from the contribution of both ZnS and CuInS2. Similar behavior has been observed for other core/shell systems, such as CdSe/ZnS.16Fig. 1B shows the TEM images of the as-prepared CuInS2/ZnS QDs, and it can be seen that the resultant CuInS2/ZnS QDs are uniform spherical particles with a very narrow size distribution. This demonstrates the high crystallinity of the CuInS2/ZnS QDs. The distances (0.31 nm) between adjacent lattice fringes are the interplanar distances of the CuInS2/ZnS QDs in the (112) plane. | ||
| Fig. 1 (A) XRD pattern of CuInS2 and CuInS2/ZnS QDs and (B) representative TEM images of CuInS2/ZnS QDs. The inset shows a high-magnification TEM image of a CuInS2/ZnS QD. | ||
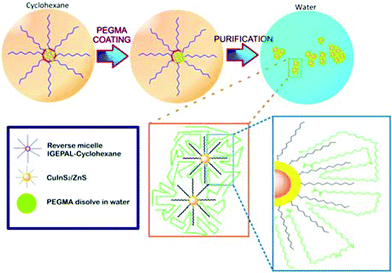
The hydrophilic PEGMA is known to be nonimmunogenic, nonantigenic, nontoxic, and to have good antifouling effect on a wide variety of proteins.17–22 It has been revealed that the PEGMA brushes can provide a steric surface barrier to maintain the stability of micelles and avoid aggregation between micelles during biological circulation. Basiruddin et al.11 have adopted PEGMA to prepare PEGylated nanoprobe-containing magnetic nanoparticles and QDs. In this experiment, we used PEGMA to cover the surface of CuInS2/ZnS QDs to transfer them from the organic phase to the aqueous phase. The coating procedure is based on the interactions of the PEGMA and the QD capping agents (Fig. 2). At the beginning, cyclohexane serves as the solvent for the CuInS2/ZnS QDs and the capping process is promoted by the use of Igepal CO-520. The Igepal CO-520 surfactant centralizes the hydrophobic QDs in the corner of a micelle. Subsequently, PEGMA is introduced into the resulting solution and DDT capping agents of the CuInS2/ZnS QDs interact with the carbon chain of PEGMA by physical adsorption or through the van der Waals force. The outer part of the PEGMA tail, especially the hydroxide groups, functions to improve the solubility of CuInS2/ZnS QDs in water. A purification process involving ethanol can separate Igepal CO-520 and cyclohexane from the solution, and thus PEGMA-coated CuInS2/ZnS QDs can be obtained.
 | ||
| Fig. 2 Schematic diagram showing the preparation of PEGMA-coated CuInS2/ZnS QDs. | ||
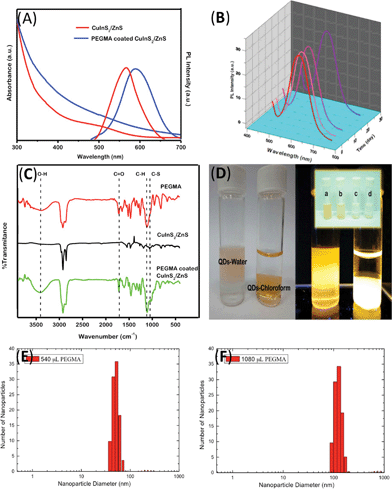
The normalized absorption and PL emission spectra of the CuInS2/ZnS QDs and the PEGMA-coated CuInS2/ZnS QDs are compared in Fig. 3A. After coating with PEGMA, the maximum emission peak of the PEGMA-coated CuInS2/ZnS QDs was shifted to a longer wavelength (600 nm) than that of CuInS2/ZnS QDs in chloroform (560 nm). These phenomena are consistent with previous reports:23–26 the maximum emission peak of the higher levels of aggregated QD doping in small SiO2 beads was also shifted to a longer wavelength than that of QDs in organic solvent. This can be attributed to the aggregation of the CuInS2/ZnS QDs and energy transfer from smaller QDs to larger QDs. This energy transfer occurs when QDs are sufficiently close to one another that their emission and absorption spectra overlap, which is referred to as fluorescence resonance energy transfer. Moreover, the colloidal stability of water-soluble QDs is very important in biological applications. One can see from Fig. 3B that the PEGMA-coated CuInS2/ZnS QDs maintained their initial PL even after 27 days of immersion in water. The luminescence quantum yield (QY) of the PEGMA-coated CuInS2/ZnS QDs were comparatively studied by taking rhodamine 6G (R6G) as a reference fluorescent dye with a known QY (95%) and comparing the integrated fluorescence intensity of the solutions, both recorded exciting samples having the same absorbance (< 0.1 a.u. in order to minimize possible re-absorption effects). This method has been discussed extensively elsewhere.27–29 The PL QYs of the as-prepared QDs were calculated using the following equations: QY = QYR6GIQD/IR6G(ηchloroform/ηethanol) where I and η denote the integral PL intensity and the optical density and reflective index of the solvent, respectively. The luminescence QY of the PEGMA-coated CuInS2/ZnS QDs was ∼0.6% after 1 day of reaction time and decreased to ∼0.4% after 27 days. These results suggest that the long-term stability of the PL might be attributed to appropriate coating of the PEGMA chains, leading to a more efficient insulating barrier on the surface of the CuInS2/ZnS QDs. The FTIR spectra of PEGMA (Fig. 3C) showed adsorption peaks at 3351 cm−1 (O–H), 2872 and 1107 cm−1 (C–H), 1728 cm−1 (C![[double bond, length as m-dash]](https://www.rsc.org/images/entities/char_e001.gif) O) and 1636 cm−1 (C
O) and 1636 cm−1 (C![[double bond, length as m-dash]](https://www.rsc.org/images/entities/char_e001.gif) C). Moreover, the CuInS2/ZnS QDs showed a specific peak at 2921 cm−1 (C–H stretching) and 1049 cm−1 (S–C) from the organic ligands (DDT) of the QDs. PEGMA coating significantly altered the FTIR spectra of the CuInS2/ZnS QDs, especially the O–H peak from hydroxide and the C
C). Moreover, the CuInS2/ZnS QDs showed a specific peak at 2921 cm−1 (C–H stretching) and 1049 cm−1 (S–C) from the organic ligands (DDT) of the QDs. PEGMA coating significantly altered the FTIR spectra of the CuInS2/ZnS QDs, especially the O–H peak from hydroxide and the C![[double bond, length as m-dash]](https://www.rsc.org/images/entities/char_e001.gif) O and C–H peaks from the methacrylate tail. The CuInS2/ZnS spectra after PEGMA coating showed no new peak on the FTIR spectrogram, which indicates that the coating process occurred via physical adsorption without a chemical reaction.
O and C–H peaks from the methacrylate tail. The CuInS2/ZnS spectra after PEGMA coating showed no new peak on the FTIR spectrogram, which indicates that the coating process occurred via physical adsorption without a chemical reaction.
 | ||
| Fig. 3 (A) Absorption and fluorescence emission of the CuInS2/ZnS QDs and the PEGMA-coated CuInS2/ZnS QDs. (B) Temporal evolution of the PL intensity of the PEGMA-coated CuInS2/ZnS QDs for 1, 4, 9, 23, and 27 days. (C) FT-IR spectra of the PEGMA, CuInS2/ZnS QDs, and PEGMA-coated CuInS2/ZnS QDs. (D) CuInS2/ZnS QDs and PEGMA-coated CuInS2/ZnS QDs in chloroform and water, respectively. The top layer was water, and the bottom layer was chloroform. The inset shows CuInS2/ZnS QDs coated with different formulations of Igepal and PEGMA: (a) Igepal CO-520 and PEGMA Mn~360, (b) Igepal CO-520 and PEGMA Mn~526, (c) Igepal CO-630 and PEGMA Mn~360, and (d) Igepal CO-630 and PEGMA Mn~526. The hydrodynamic size distribution of CuInS2/ZnS after coating with (E) 540 μL PEGMA and (F) 1080 μL PEGMA. | ||
Different formulations of Igepal (Igepal CO-520 and Igepal CO-630) and PEGMA (PEGMA with Mn∼360 and Mn∼526) were used in this research. The combination of Igepal CO-520 and PEGMA (Mn∼360) gave the highest PL QYs (0.9%), as shown in Fig. 3D. The QY of the combination of Igepal CO-520 and PEGMA (Mn∼526) is 0.5%, lower than the case using Igepal CO-520 and PEGMA (Mn∼360). Moreover, PEGMA with both Mn∼360 and 526, which was used with Igepal CO-630, failed to cause a phase transfer of the CuInS2/ZnS QDs, even when added with high concentrations of Igepal CO-630. This phenomenon can be understood as follows: the higher molecular weight of Igepal produces a more hydrophilic site on the reverse micelle that limits the placement of QDs in the corner of the reverse micelle. Additionally, the longer chain of PEGMA increases the probability of the QDs aggregating and leads to decreases in the QY. The concentration of PEGMA also affects the water solubility of the CuInS2/ZnS QDs. DLS showed that the as-synthesized PEGMA-coated CuInS2/ZnS QDs were homogeneously suspended in the aqueous solution and had a small size distribution as shown in Fig. 3E and F. DLS measurements on aqueous samples of PEGMA-coated CuInS2/ZnS QDs with 540 μL or 1080 μL showed hydrodynamic mean diameters of 114 nm and 122 nm, respectively, indicating that the concentration of PEGMA dominates the hydrodynamic mean diameters of the QDs.
 | ||
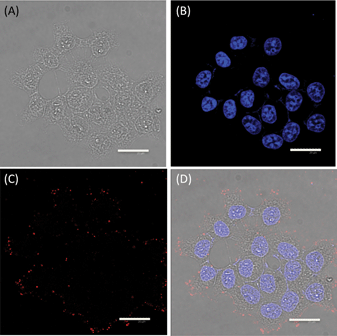
| Fig. 4 Confocal images of HepG2 cells: (A) optical image under visible light; (B) DAPI emission at 460 nm, showing the location of the nuclei of the HepG2 cells; (C) red fluorescence originating from the PEGMA-coated CuInS2/ZnS QDs; and (D) image showing a superposition of Fig. 4A, B, and C. | ||
To demonstrate the potential exploitation of the PEGMA-coated CuInS2/ZnS QDs as cellular fluorescence markers, we incubated them with HepG2 cells for 1 h, washed the cells to remove non-internalized nanoparticles, and subsequently stained them with DAPI to visualize the nuclei. Fig. 4A shows the morphology of the HepG2 cells without fluorescence; this clearly shows the cellular boundaries of the HepG2 cells. In Fig. 4B, blue luminescence from the DAPI is clearly visible in the region around the nuclei of the cells. In Fig. 4C, red luminescence is also clearly visible, indicating that the PEGMA-coated CuInS2/ZnS QDs labeled mainly the cell membrane and revealed punctated QD staining throughout the cytoplasm.
4. Conclusion
We report a simple and rapid method for the preparation of PEGMA-coated CuInS2/ZnS QDs at room temperature and atmospheric pressure without involving inert gas. The whole procedure can be considered “green”, not only because of the reduced energy consumption (reaction at room temperature and atmospheric pressure without involving inert gas), but also because of the associated time savings (reaction within 1 h). Different formulations of Igepal (Igepal CO-520 and Igepal CO-630) and PEGMA (PEGMA with Mn∼360 and Mn∼526) were used to examine the coating procedure. Other important features are that the PEGMA-coated CuInS2/ZnS are stable in water for up to 27 days, and they can be used as HepG2 cellular fluorescence markers. We believe that such a synthetic strategy and mechanism can be readily extended to the fabrication of other I–III–VI ternary systems such as CuInSe2 and AgInS2, which may create new opportunities for bioimaging applications.Acknowledgements
This work was supported in part by the National Science Council of the Republic of China under Contract No. NSC 100-2113-M-011-011, and supported partly by Taipei Medical University under Contract No. 101TMU-BIMD-01. We also thank the Taipei Medical University, National Taiwan University of Science and Technology Joint Research Program for financially supporting this research under Contract No. TMU-NTUST-100-02 and TMU-NTUST-101-06.References
- T. Jamieson, B. Raheleh, D. Petrova, R. Pocock, M. Imani and A. M. Seifalian, Biomaterials, 2007, 28, 4717 CrossRef CAS.
- H. M. E. Azzazy, M. M. H. Mansour and S. C. Kazmier- czak, Clin. Biochem., 2007, 40, 917 CrossRef CAS.
- J. M. Klostranec and W. C. W. Chan, Adv. Mater., 2006, 18, 1953 CrossRef CAS.
- S. J. Soenen, P. Rivera-Gil, J. -M. Montenegro, W. J. Parak, S. C. De Smedt and K. Braeckmans, Nano Today, 2011, 6, 446 CrossRef CAS.
- F. Zhao, Y. Zhao, Y. Liu, X. Chang, C. Chen and Y. Zhao, Small, 2011, 7, 1322 CrossRef CAS.
- H. F. Krug and P. Wick, Angew. Chem., Int. Ed., 2011, 50, 1260 CrossRef CAS.
- L. Li, A. Pandey, D. J. Werder, B. P. Khanal, J. M. Pietryga and V. J. Klimov, J. Am. Chem. Soc., 2011, 133, 1176 CrossRef CAS.
- R. Xie, M. Rutherford and X. Peng, J. Am. Chem. Soc., 2009, 131, 5691 CrossRef CAS.
- Q. Ma and X. Su, Analyst, 2010, 135, 1867 RSC.
- E. E. Lees, T. Nguyen, A. H. A. Clayton and P. Mul-vaney, ACS Nano, 2009, 3, 1121 CrossRef CAS.
- S. K. Basiruddin, A. Saha, N. Pradhan and N. R. Jana, Nanoscale, 2010, 2, 2561 RSC.
- P. Zrazhevskiy, M. Sena and X. Gao, Chem. Soc. Rev., 2010, 39, 4326 RSC.
- J. -C. Hsu, C. -C. Huang, K. -L. Qu, N. Lu, F. -D. Mai, J. -K. Chen and J. -Y. Chang, J. Mater. Chem., 2011, 21, 19257 RSC.
- A. Hoshino, K. Hanaki, K. Suzuki and K. Yama-moto, Biochem. Biophys. Res. Commun., 2004, 314, 46 CrossRef CAS.
- C. E. Mcnamee, S. Yamamoto and K. Higashitani, Biophys. J., 2007, 93, 324 CrossRef CAS.
- B. O. Dabbousi, J. Rodriguez-Viejo, F. V. Mikulec, J. R. Heine, H. Mattoussi, R. Ober, K. F. Jensen and M. G. Bawendi, J. Phys. Chem. B, 1997, 101, 9463 CrossRef CAS.
- S. Jon, J. Seong, A. Khademhosseini, T. T. Tran, P. E. Laibins and R. Langer, Langmuir, 2003, 19, 9989 CrossRef CAS.
- Z. Y. Qin, Y. W. Chen, W. H. Zhou, X. H. He, F. L. Bai and M. X. Wan, Eur. Polym. J., 2008, 44, 3732 CrossRef CAS.
- H. Hussain, K. Y. Mya and C. B. He, Langmuir, 2008, 24, 13279 CrossRef CAS.
- Y. Lu, W. Wang, W. Hu, Z. Lu, X. Zhou and C. M. Li, Biomed. Microdevices, 2011, 13, 769 CrossRef.
- Y. Q. Yang, L. S. Zheng, X. D. Guo, Y. Qian and L. J. Zhang, Biomacromolecules, 2011, 12, 116 CrossRef CAS.
- Y. -C. Chiag, Y. Chang, W. -Y. Chen and R. Ruaan, Langmuir, 2012, 28, 1399 CrossRef CAS.
- C. Graf, S. Dembski, A. Hofmann and E. Ruhl, Langmuir, 2006, 22, 5604 CrossRef CAS.
- R. Han, M. Yu, Q. Zheng, L. Wang, Y. Hong and Y. Sha, Langmuir, 2009, 25, 12250 CrossRef CAS.
- M. Darbandi, R. Thomann and T. Nann, Chem. Mater., 2005, 17, 5720 CrossRef CAS.
- J. -C. Hsu, C. -C. Huang, K. -L. Qu, N. Lu, F. -D. Mai, J. -K. Chen and J. -Y. Chang, J. Mater. Chem., 2011, 21, 19257 RSC.
- L. Qu and X. Peng, J. Am. Chem. Soc., 2002, 124, 2049 CrossRef CAS.
- L. Manna, E. C. Sscher, L. -S. Li and A. P. Alivisatos, J. Am. Chem. Soc., 2002, 124, 7136 CrossRef CAS.
- S. A. Ivanov, A. Piryatinski, J. Nanda, S. Tretiak, K. R. Zavadil, W. O. Wallace, D. Werder and V. I. Klimov, J. Am. Chem. Soc., 2007, 129, 11708 CrossRef CAS.
| This journal is © The Royal Society of Chemistry 2012 |
