CeO2 nanofibers for in situ O2 and CO sensing in harsh environments†
Yixin
Liu
a,
Yu
Ding
a,
Lichun
Zhang
b,
Pu-Xian
Gao
ab and
Yu
Lei
*a
aDepartment of Chemical, Materials and Biomolecular Engineering, University of Connecticut, 191 Auditorium Road, Unit 3222, Storrs, CT 06269, USA. E-mail: ylei@engr.uconn.edu; Fax: +1(860)486 2959; Tel: +1(860)486 4554
bInstitute of Material Sciences, University of Connecticut, 97 North Eagleville Road, Unit 3136, Storrs, CT 06269, USA
First published on 3rd April 2012
Abstract
As the most common type of harsh environment sensors, high temperature gas sensors are of paramount importance to improve combustion efficiency and control emissions. In this study, large scale and polycrystalline CeO2 nanofibers were prepared with an average diameter of 376 ± 55 nm using a facile two-step synthesis route including electrospinning and calcination. The as-prepared CeO2 nanofibers show good morphological and structural stability in high temperature environment (800–1000 °C). CeO2 nanofibers were further employed for in situ, real-time oxygen (O2) and carbon monoxide (CO) sensing at 800 °C and 1000 °C, respectively, both of which showed sensitive, reversible, and reproducible response. The mechanism for distinguishable response towards O2 and CO was discussed. These results indicate that electrospun CeO2 nanofibers are a promising nanomaterial for gas sensing in harsh environments.
Introduction
Environmental pollution from combustion engines and power plants has driven an increasing need for reliable gas sensors that can operate in harsh environments especially high temperatures (>500 °C). In particular, high temperature oxygen (O2) and carbon monoxide (CO) sensors have played a key role in pollution control and fuel consumption efficiency in wide industrial fields, including automobile engine management, control of chemical processes as well as optimization of boilers, steel and cement industries, biological and food processing plants.1,2 For example, oxygen sensors used in automotive exhaust emission control systems are dominating the applications of solid-state gas sensors worldwide.3 The control of the air/fuel ratio in automobile engines can improve the fuel economy efficiency leading to the reduction of the harmful emissions.4 In addition, monitoring all relevant emission components (on-board diagnosis) requires a second oxygen sensor downstream of the catalyst.3 Commercialized oxygen gas sensors are mainly the potentiometric type sensors with a solid electrolyte of ZrO2, which measure different oxygen concentration between a reference electrode and a sensing electrode as a voltage output. A reference gas and electrode are required for sensor operation, therefore this type sensor usually has a complicated configuration.5,6 By contrast, resistive oxygen gas sensors usually have a very simple structure, thus allowing for the size to be reduced. Therefore, resistive oxygen gas sensors have drawn a lot of attention recently. It has been reported that TiO2,7,8 SrTiO3,9,10 Ga2O3,5,11 and CeO26,12,13 can be used as materials for resistive oxygen sensors.Besides high temperature O2 sensors, high temperature CO gas sensors are also in high demand for controlling the emission of CO due to the toxicity of CO to human health. Carbon monoxide is a colorless, odorless, poisonous gas formed when carbon in fuels is not fully burned. Automobile exhaust gases can contribute about 60% of all CO emissions. The U.S. Environment Protection Agency (US EPA) health-based national air quality standard for CO is 9 ppm measured as an annual second-maximum 8 hour average concentration. Therefore, in situ detection of CO is essential to its control from combustion processes. However, CO is a strong reducing agent and could irreversibly interact with many sensing materials, resulting in the loss of the sensing function.
Currently, most of the reported high temperature O2 and CO sensors operate at mild temperatures (<700 °C), and are not suitable for applications at a higher temperature (800–1000 °C). For example, in close proximity to engines, the exhaust gases can reach temperatures close to 1000 °C14 which require superior thermal stability of the sensor device including the sensing material, electrode and also the supporting substrate. In situ high temperature gas sensors, if successfully employed, could save huge amounts of energy across all energy-consuming industries. Up to date, commercially available sensor technology for such harsh environments is extremely limited due to the high requirements for sensing materials and sensor performance. Therefore, there is an urgent need to develop fast, sensitive, robust, and cost-effective high temperature gas sensors for the control of combustion-related processes.
Various metal oxides have been explored for applications in high temperature environments.5–13 Among them, CeO2 is one of the most promising materials in the fabrication of high temperature sensors (especially for oxygen) because CeO2 possesses good thermal stability and exhibits a large diffusion coefficient for oxygen vacancy compared with TiO2, resulting in quick changes of oxygen vacancy concentration in equilibrium state and thus fast response to oxygen.15–17 In addition, CeO2 has good corrosion resistance to corrosive gases (Cl2, SO2 and NO) compared with SrTiO3 and Ga2O3.16,18 In this study, CeO2 nanofibers will be prepared for high temperature gas sensing.
In order to improve the sensing performance, the conventional thin film technology faces its fundamental limits19 because the miniaturization of the sensor device requires simultaneous sensitivity increase to compensate for the loss of total surface area. Therefore, nanostructured materials have emerged as alternatives because they can provide a large specific surface and enhance the sensing performance. Specifically, nanofibers fabricated via electrospinning possess specific surface approximately one to two orders of the magnitude larger than flat films, making them excellent candidates for potential applications in sensors.20 By incorporating metal salts into the polymer, ceramic nanofibers can be fabricated by calcination following electrospinning.21–23 However, the nanostructured sensors encounter certain challenges (e.g., the structure stability) in high temperature environments, given the fact that thermodynamically minimization of surface area is a spontaneous process.
In this report, novel CeO2 nanofibers were successfully prepared by a two-step procedure which consists of electrospinning of Ce(NO3)3-PVP precursor nanofibers and a subsequent calcination process. Scanning electron microscopy (SEM), transmission electron microscopy (TEM) and X-ray diffraction (XRD) were applied to investigate the morphology and structure of the as-prepared sample. The CeO2 nanofibers exhibited good morphological and structural stability at high temperature and showed sensitive, reversible and reproducible responses towards CO and O2 at 800 °C and 1000 °C, indicating its potential application in harsh environments.
Experimental
Reagents
Cerium(III) nitrate hexahydrate (Ce(NO3)3·6H2O) and dimethylformamide (DMF) were purchased from Acros Organics. Poly(vinyl pyrrolidone) (PVP, MW = 1![[thin space (1/6-em)]](https://www.rsc.org/images/entities/char_2009.gif) 300000) were obtained from Sigma-Aldrich. For gas sensing studies, high purity nitrogen (N2, 99.998%), O2/N2 gas mixtures (97 ppm oxygen or 10% O2 in N2), and CO/Ar gas mixture (1% CO in Ar) were ordered from Airgas.
300000) were obtained from Sigma-Aldrich. For gas sensing studies, high purity nitrogen (N2, 99.998%), O2/N2 gas mixtures (97 ppm oxygen or 10% O2 in N2), and CO/Ar gas mixture (1% CO in Ar) were ordered from Airgas.
Preparation of CeO2 nanofibers
0.386 g Ce(NO3)3·6H2O and 0.386 g PVP were dissolved in 3 mL DMF and then stirred to form a homogeneous solution. The final mixture was loaded into a plastic syringe with a 23-gauge needle for electrospinning. The Ce(NO3)3-PVP precursory nanofibers were fabricated by electrospinning with a flow rate of 0.3 mL h−1 at an applied voltage of 20 kV over a collection distance of 15 cm. The precursory nanofibers were then calcined in air as follows: first, calcined at 500 °C for 3 h in order to remove the matrix polymer and generate CeO2 nanofibers; and then calcined at 1000 °C for 3 h to improve the crystal structure and thermal stability of CeO2 nanofibers. The samples obtained after the two calcination steps are denoted as CeO2(500) and CeO2(1000), respectively. To study the thermal stability, the as-prepared CeO2 nanofibers were treated at 1000 °C in air for 5 h followed by naturally cooling down to room temperature, and the whole process was repeated two more times. After three cycles of heating and cooling treatment, the final product was denoted as CeO2(1000×3) and then subject to further characterization for chemical and structural stability.Characterization of CeO2 nanofibers
A JEOL 6335F field-emission scanning electron microscope (SEM) was employed to examine the morphology and the size of the as-electrospun nanofibers before and after calcination. More detailed morphology and selected area electron diffraction (SAED) patterns were studied using a Tecnai T12 transmission electron microscope (TEM) operated at 120 kV. The crystal structures of the samples were characterized by Oxford diffraction XcaliburTM PX Ultra with ONYX detector.Sensor device fabrication
Homemade resistor-type CeO2 nanofibers-based sensor is applied for in situ gas sensing in high temperature environment. Briefly, CeO2(1000) nanofibers, serving as the sensing material, were cast in a small dent (500 μm in depth) on the top of an Al2O3 ceramic tube which has two holes to hold two Pt wires as electrodes. The sensor was connected to a CHI 601C electrochemical analyzer (CH Instruments Inc., USA) through two long Ni–Cr alloy wires and was placed in a furnace with a temperature control to conduct in situ high temperature gas sensing. The current output at a fixed 1 V DC bias was continuously measured.O2 and CO sensing at high temperature
The performance of the CeO2 nanofibers-based gas sensor at high temperatures (800–1000 °C) was evaluated by measuring the resistance/conductance change upon exposure to different concentrations of O2 and CO in a dynamic gas flow system. High purity nitrogen was used as carrier gas to obtain various O2 or CO concentrations. Carrying N2 and gas mixtures with a constant gas flow rate of 1.5 L min−1 were regulated by a computer-controlled gas mixing system (S-4000, Environics Inc., USA). The current in the sensor was continuously measured and the electric resistance of the sensor was calculated by applying Ohm's Law (R = V/I). In a typical O2 sensing experiment, the sensor placed in furnace at 800 or 1000 °C was first exposed to O2/N2 mixture for 7 min, followed by high purity N2 for 18 min to recover the sensor, and then the “exposure/recovery” cycle was repeated. Upon the exposure to O2, the resistance of the CeO2 nanofibers-based sensor increases. The response of the sensor towards O2 was evaluated by resistance ratio Rg/R0, where R0 is the initial electrical resistance of the sensor in high purity nitrogen and Rg is the measured real-time resistance upon exposure to oxygen mixture or pure nitrogen. On the contrary, the resistance of the sensor dramatically drops in the presence of CO, thus reverse responses towards O2 and CO are obtained. As the resistance of the sensor in CO mixture is one to two orders lower than its original resistance, the reverse resistance ratio (R0/Rg) was used to evaluate the CO sensing performance of the sensor. Since the response/recovery of the sensor towards “on/off” of CO is very fast, the exposure and recovery time in the CO sensing experiment are adjusted to 5 min and 10 min, respectively.Results and discussion
Characterization of the material
The morphology changes of the electrospun nanofibers before and after two-step calcination were examined by SEM. As shown in Fig. 1A, the Ce(NO3)3-PVP precursory nanofibers displayed uniform and well-distributed fiber structure with an average diameter of 563 ± 66 nm. After calcination in air at 500 °C for 3 h, the PVP matrix was completely degraded and Ce(NO3)3 was decomposed to form CeO2 (Fig. 1B). It can be observed that the average diameter of calcined nanofibers reduced to 374 ± 52 nm and the surfaces of CeO2(500) nanofibers were not as smooth as the precursory nanofibers, which can be attributed to the loss of PVP, the decomposition of Ce(NO3)3 and the crystallization of CeO2. Further calcination at 1000 °C for another 3 h was carried out to eliminate the impurities and improve the CeO2 crystal phase and stability at high temperature. As shown in Fig. 1C, the CeO2(1000) nanofibers display rougher surfaces compared to CeO2(500) with a similar average diameter of 376 ± 55 nm, which implies no weight loss and improved crystallinity of CeO2 during the calcination process at 1000 °C. More detailed morphology of CeO2(1000) nanofibers was investigated by TEM, as presented in Fig. 2A. The diameter of the nanofiber was ∼386 nm, which was in good agreement with SEM results and small crystallites can be observed in the nanofiber. Selected area electron diffraction (SAED) pattern shows a typical ring pattern, suggesting the polycrystalline structure of the nanofibers (Fig. 2B).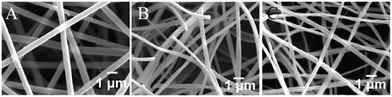 | ||
| Fig. 1 SEM images of (A) Ce(NO3)3-PVP nanofibers; (B) CeO2(500) nanofibers (obtained after calcination of precursor nanofibers at 500 °C); (C) CeO2(1000) nanofibers (obtained after CeO2(500) was further calcined at 1000 °C). | ||
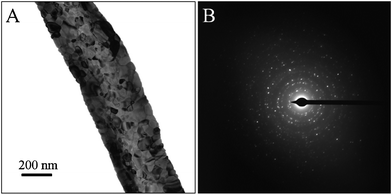 | ||
| Fig. 2 (A) A typical TEM image, (B) SAED pattern of CeO2(1000) nanofibers. | ||
The composition and crystal structure were further characterized by XRD. As shown in Fig. 3, the XRD pattern of CeO2(1000) nanofibers matches the standard spectrum of JCPDS 65-5923. The diffraction peaks at 2θ values of 28.59, 33.13, 47.56, 56.43, 59.18, 69.53, 76.83, 79.21° correspond to CeO2 (111), (200), (220), (311), (222), (400), (331) and (420) crystal planes, respectively. No other diffraction peak was observed, indicating the good phase purity. In order to examine the thermal stability of CeO2(1000) nanofibers, the as-prepared sample was heated/cooled between 1000 °C and room temperature for 3 times. The SEM images (insets of Fig. 3) shows no obvious morphology change between CeO2(1000) and CeO2(1000×3), implying the good morphological stability of CeO2 nanofibers at high temperature. In addition, after thermal treatment at 1000 °C 3 times, the XRD pattern of CeO2(1000×3) nanofibers showed no peak shift compared with that of CeO2(1000) nanofibers, indicating the as-prepared CeO2 nanofibers also possess a good chemical and structural stability at high temperature. Such good thermal stability endows CeO2 nanofibers with the potential application for high temperature resistive-type gas sensing.
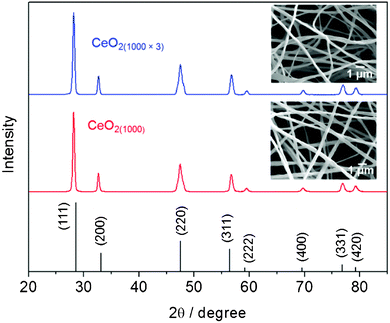 | ||
| Fig. 3 XRD patterns for the as-prepared CeO2(1000) nanofibers, CeO2(1000×3) nanofibers obtained after thermal stability study and the standard values for CeO2. Insets show the SEM images of CeO2(1000) and CeO2(1000×3). | ||
Oxygen and carbon monoxide sensing
The O2 and CO sensing properties of the CeO2 nanofibers-based sensor were examined at operation temperatures of 800 °C and 1000 °C, respectively. The I–V profiles of the sensor at 800 °C and 1000 °C are shown in Fig. S1†, indicating that the sensor obeys Ohm's Law at 1 V which was the applied bias in the sensing experiments. Fig. 4 presents the typical responses of the CeO2 nanofibers as a function of time upon periodic exposure to different concentrations of O2 and CO, respectively at both operation temperatures. As shown in Fig. 4 (top), upon the exposure of CeO2 nanofibers to O2, the resistance ratio Rg/R0 of CeO2 nanofibers increases rapidly and displays the concentration-dependent behavior with a response time (t90, defined as the time when the normalized resistance change reached 90% of the maximum response after the exposure to oxygen) of 30 s at 800 °C and 28 s at 1000 °C (towards 800 ppm O2), respectively. The actual t90 is expected to be shorter by considering the time required to establish the pre-set O2 concentration in furnace. In addition, the sensor responses towards three-time exposure of 500 ppm oxygen exhibited a very small relative standard deviation (RSD) of 0.85% at 800 °C and 2.6% at 1000 °C, indicating high reproducibility. On the contrary, exposure of the same sensor to CO rapidly decreases the resistance of CeO2 nanofibers. One can see from Fig. 4 (bottom) that the reverse resistance ratio (R0/Rg) of the sensor can reach as high as 48.3 towards 100 ppm CO at 800 °C, which means the resistance of the sensor decreases 48.3 folds compared to its original resistance in N2. By purging with carrying gas, the response of CeO2 nanofibers can be completely recovered, indicating the good reusability of CeO2 nanofiber-based sensor. Furthermore, the sensor responses towards three-time exposure of 100 ppm CO also showed good reproducibility with a small RSD of 1.2% at 800 °C and 2.5% at 1000 °C. The reason for initial irregular response to CO can be explained as that the surface may have some unstable species which could interact with CO and finally are stabilized. The CO sensing performance of the CeO2 nanofibers-based sensor in this work was compared with previous reported resistor-type CO sensors, as shown in Table S1†. To the best of our knowledge, this is one of the best results for resistor-type sensor for CO sensing at such high temperature. For multiple “on-off” cycles of O2 or CO at both 800 and 1000 °C, the CeO2 nanofibers show fast, sensitive, reversible, and reproducible responses for all cycles, suggesting that CeO2 nanofibers are good sensing elements in the detection of O2 and CO in high temperature harsh environments. The stable performance and fast response/recovery can be attributed to the porous nanofiber structure, which not only allows the free access of analyte molecules to CeO2 and reduces the diffusion resistance, but also prevents the potential malfunction due to the considerable internal stress caused by thermal-expansion and/or gas molecule adsorption, thus offering an excellent sensing platform with stable performance.24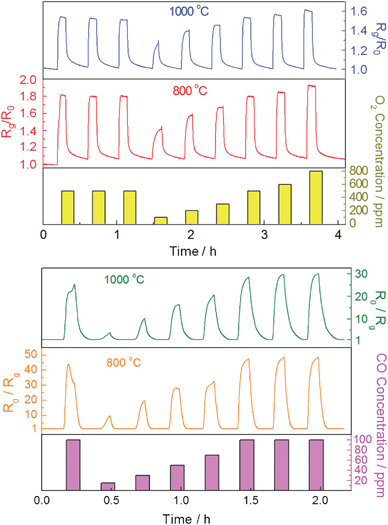 | ||
| Fig. 4 Typical responses of CeO2 nanofibers-based sensor upon periodic exposure to different concentrations of oxygen (top) and carbon monoxide (bottom) at an applied DC bias of 1 V at 800 °C and 1000 °C. | ||
The corresponding calibration curves (response vs. O2 or CO concentration) are presented in Fig. 5 and Fig. 6, respectively. The gas sensing mechanism of CeO2 nanofibers can be illustrated based on the electrical properties of the sensing element and the chemical property of the analyte molecules. In this study, the as-prepared CeO2 is n-type, thus the predominant point defects in CeO2 are the electron trapped by lattice Ce and oxygen vacancy. The classic mechanism of electrical conductivity for CeO2 has been reported as follows:13,25
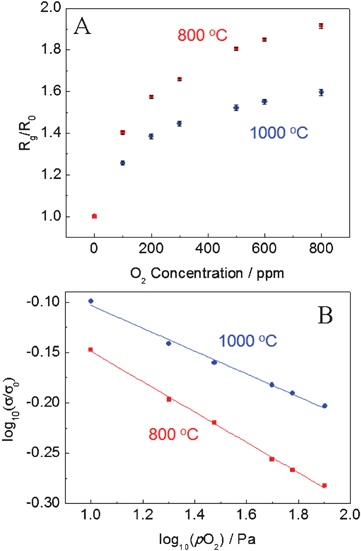 | ||
| Fig. 5 (A) Calibration curve for O2 response of CeO2 nanofibers-based sensor at an applied DC bias of 1 V at 800 °C and 1000 °C. (B) The normalized electrical conductivity of CeO2vs. oxygen partial pressure pO2 at 800 °C and 1000 °C. | ||
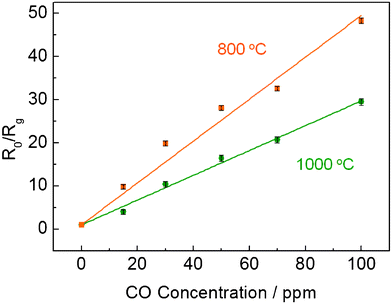 | ||
| Fig. 6 Calibration curve for CO response of CeO2 nanofibers-based sensor at an applied DC bias of 1 V at 800 °C and 1000 °C. | ||
| (1) |
 | (2) |
Therefore, the conductivity of CeO2 nanofibers decreases with the increase of oxygen concentration, in good agreement with the observed results. However, compared to the theoretical value m = 6 in σ ∝ P(O2)−1/m, the obtained m values for CeO2 nanofibers are 6.7 and 8.8 at 800 °C and 1000 °C (Fig. 5B), respectively, which are slightly larger than the theoretical value of 6. Similar phenomenon has been observed for other nanoscale ceria-based oxygen gas sensors.6,16 The reason is not clear and still under study, but may be ascribed to the unique property (e.g., significant ionic conductivity, populated surface oxygen vacancies, etc.) associated with nanoscale CeO2 nanofibers.
For CO sensing, the response of the sensor exhibited a linear tendency with increasing CO concentration, as presented in Fig. 6. N2 is used as the carrying gas because CO and O2 (or O2 in air) could react to form CO2 in the gas phase at the temperature higher than 605 °C which is the autoignition temperature of CO from SIRI Material Safety Data Sheets (MSDS). In the presence of reducing gas such as CO, the resistance of the sensor drops dramatically, which might be ascribed to two effects: First, at the early stage, the surface adsorbed oxygen species will be removed by CO and release the electrons back to the CeO2; Second, after depletion of adsorbed oxygen species, CO will also extract lattice oxygen to form CO2 which will generate more oxygen vacancies and electrons according to eqn (1). Upon the purging of high purity N2, the response can be fully recovered, which is surprising. One possible explanation is the residue oxygen in the high purity N2 gas can be adsorbed again on the CeO2 surface and refill the oxygen vacancies, thus shifting eqn (1) to left side and resulting in the conductivity back to original level.
Operating at extremely high temperature (800 and 1000 °C), the CeO2 nanofibers-based sensors showed very good stability, reversibility, reproducibility and excellent sensitivity towards CO. These good results indicate that electrospun CeO2 nanofibers are a promising nanomaterial for gas detection in harsh environments.
Conclusions
A facile two-step process (electrospinning followed by calcination) has been successfully applied to fabricate CeO2 nanofibers with an average diameter of 376 ± 55 nm. The as-prepared CeO2 nanofibers possess highly porous structure, large surface to volume ratio, and good thermal stability in terms of morphology, chemical structure and crystalline structure, thus offering an excellent sensing material for CO and O2 gas sensing in harsh environments. The fabricated CeO2 nanofibers-based resistive type sensor exhibited sensitive, reversible, and reproducible concentration-dependent behavior to reducing gas (CO) and oxidizing gas (O2) at 800 and 1000 °C. Due to different sensing mechanisms for reducing gas and oxidizing gas, the response to CO and O2 can be easily distinguished based on the observed resistance increase or decrease. The stable performance and fast response/recovery can be attributed to free access of gaseous molecules to CeO2 nanofibers. This study provides a promising route for the facile and cost-effective synthesis of high temperature stable nanomaterial which has great potential application in gas sensing in harsh environments.Acknowledgements
We greatly appreciate the funding support from the Department of Energy (DOE).References
- J. W. Schwank and M. DiBattista, MRS Bull., 1999, 24, 44–48 CAS.
- R. Ramamoorthy, P. K. Dutta and S. A. Akbar, J. Mater. Sci., 2003, 38, 4271–4282 CrossRef CAS.
- J. Riegel, H. Neumann and H. M. Wiedenmann, Solid State Ionics, 2002, 152, 783–800 CrossRef.
- Y. L. Xu, X. H. Zhou and O. T. Sorensen, Sens. Actuators, B, 2000, 65, 2–4 CrossRef.
- M. Ogita, K. Higo, Y. Nakanishi and Y. Hatanaka, Appl. Surf. Sci., 2001, 175, 721–725 CrossRef.
- N. Izu, W. Shin and N. Murayama, Sens. Actuators, B, 2003, 93, 449–453 CrossRef.
- R. K. Sharma, M. C. Bhatnagar and G. L. Sharma, Sens. Actuators, B, 1997, 45, 209–215 CrossRef.
- L. Francioso, D. S. Presicce, P. Siciliano and A. Ficarella, Sens. Actuators, B, 2007, 123, 516–521 CrossRef.
- J. Gerblinger and H. Meixner, Sens. Actuators, B, 1991, 4, 99–102 CrossRef.
- W. Menesklou, H. J. Schreiner, K. H. Hardtl and E. Ivers-Tiffee, Sens. Actuators, B, 1999, 59, 184–189 CrossRef.
- C. Baban, Y. Toyoda and M. Ogita, Thin Solid Films, 2005, 484, 369–373 CrossRef CAS.
- N. Izu, W. Shin, N. Murayarna and S. Kanzaki, Sens. Actuators, B, 2002, 87, 95–98 CrossRef.
- N. Izu, W. Shin, I. Matsubara and N. Murayama, J. Electroceram., 2004, 13, 703–706 CrossRef CAS.
- R. Moos, Int. J. Appl. Ceram. Technol., 2005, 2, 401–413 CrossRef CAS.
- F. Millot and P. Demierry, J. Phys. Chem. Solids, 1985, 46, 797–801 CrossRef CAS.
- N. Izu, N. Oh-hori, M. Itou, W. Shin, I. Matsubara and N. Murayama, Sens. Actuators, B, 2005, 108, 238–243 CrossRef.
- M. Kamiya, E. Shimada, Y. Ikuma, M. Komatsu and H. Haneda, J. Electrochem. Soc., 2000, 147, 1222–1227 CrossRef CAS.
- E. B. Varhegyi, I. V. Perczel, J. Gerblinger, M. Fleischer, H. Meixner and J. Giber, Sens. Actuators, B, 1994, 19, 569–572 CrossRef CAS.
- A. Kolmakov, Y. X. Zhang, G. S. Cheng and M. Moskovits, Adv. Mater., 2003, 15, 997–1000 CrossRef CAS.
- B. Ding, M. R. Wang, J. Y. Yu and G. Sun, Sensors, 2009, 9, 1609–1624 CrossRef CAS.
- D. Li and Y. N. Xia, Nano Lett., 2003, 3, 555–560 CrossRef CAS.
- X. G. Yang, C. L. Shao, Y. C. Liu, R. X. Mu and H. Y. Guan, Thin Solid Films, 2005, 478, 228–231 CrossRef CAS.
- Y. Q. Dai, W. Y. Liu, E. Formo, Y. M. Sun and Y. N. Xia, Polym. Adv. Technol., 2011, 22, 326–338 CrossRef CAS.
- W. Z. Jia, L. Su, Y. Ding, A. Schempf, Y. Wang and Y. Lei, J. Phys. Chem. C, 2009, 113, 16402–16407 CAS.
- H. J. Beie and A. Gnorich, Sens. Actuators, B, 1991, 4, 393–399 CrossRef.
Footnote |
| † Electronic supplementary information (ESI) available: See DOI: 10.1039/c2ra20126g |
| This journal is © The Royal Society of Chemistry 2012 |