DOI:
10.1039/C2RA20099F
(Paper)
RSC Adv., 2012,
2, 4335-4342
Engineered PEI-piperazinyl nanoparticles as efficient gene delivery vectors: evidence from both in vitro and in vivo studies
Received
17th January 2012
, Accepted 23rd February 2012
First published on 29th March 2012
Abstract
A small library of polyethylenimine (PEI) nanoparticles (NPs), wherein PEI was crosslinked with piperazinyl linkers, viz., piperazine-N,N′-dibutyric acid and piperazine-N,N′-dipropanal, yielding piperazine-N,N′-dibutyramide-PEI (PBAP) and piperazine-N,N′-dipropyl-PEI (PPP) nanoparticles, was designed and synthesized. The NPs were in the size range 103–216 nm. DNA complexes of all the NPs had low toxicity and exhibited significant enhancement in transfection efficiency compared to parent PEI and commercial transfection agents. Importantly, the transfection activity of NP/DNA complexes was preserved in the presence of serum. Amongst all the formulations, the PBAP4/DNA complex exhibited the highest transfection efficiency in all the cell lines tested. Also, PBAP4 NPs efficiently protected the complexed DNA against DNase in vitro. Intravenous delivery of PBAP4/DNA complex to male Balb/c mice showed the highest gene expression in spleen cells. The results indicate that PBAP nanoparticles may be used for tissue-specific gene delivery in vivo.
Introduction
Delivery of therapeutic genes in targeted cells has triggered a rapid evolution of gene delivery vectors. Cationic polymers are an attractive candidate owing to their ability to condense DNA into compact molecular complexes.1 Of the various cationic polymers, polyethylenimine (PEI) displays properties that make it a gold standard for gene delivery.2 The high cationic charge in PEI, although responsible for high transfection efficiency, also contributes to toxicity. Primary amines of PEI mostly contribute to the cytotoxicity3,4 whereas, secondary and tertiary amino groups provide good buffering capacity to the system.
In the present investigation, a substantial decrease in the charge associated cytotoxicity of PEI (branched, 25 kDa) and improvement in PEI-mediated gene delivery was achieved by crosslinking PEI with two novel piperazine-based crosslinkers, viz., piperazine-N,N′-dibutyric acid (PBA) and piperazine-N,N′-dipropanal (PP). In one approach, the excess cationic charge on PEI was masked by covalent crosslinking with piperazine-N,N′-dibutyric acid (PBA) that resulted in the partial conversion of primary and secondary amines into amides, while in the second approach, primary amines of PEI were partially converted into secondary amines by using piperazine-N,N′-dipropanal crosslinker. In both the approaches, PEI was converted into NPs. Two series of NPs, viz., piperazine-N,N′-dibutyramide-PEI (PBAP) and piperazine-N,N′-dipropyl-PEI (PPP), were prepared by varying the content of respective crosslinkers in NPs.
These novel nanoparticles were assessed for their ability to deliver DNA in vitro and compared the efficacy with unmodified PEI (25 kDa), Lipofectamine™ and Superfect™. The cytotoxicity of NP/DNA complexes was investigated on various mammalian cells. Among all the NP/DNA complexes prepared, PBAP4/DNA complex showed the highest transfection efficacy. The uptake and intracellular trafficking of labeled PBAP4 and its DNA complex was studied in HeLa cells at different time intervals. The potential of PBAP4 nanoparticles to mediate gene delivery in vivo was demonstrated by higher gene expression in the spleen of Balb/c mice post 7 days of transfection.
Results and discussion
Owing to the numerous strides made in the fields of biochemistry and biotechnology, there has been an enormous progress in gene delivery technology. Non-viral gene delivery vehicles have proved to be a potent alternative to viral gene delivery vehicles. In the present study, novel transfection reagents have been designed based on cationic polymer, branched polyethylenimine, PEI (25 kDa). Although PEI has high transfection efficiency, its in vivo applications are limited by inherent cytotoxicity and non-specific interactions with serum proteins owing to high cationic charge density. It has been documented in the literature that the primary amines of PEI are relatively more toxic than secondary or tertiary amines.3 The present study deals with the circumvention of charge associated toxicity of PEI where some of its cationic charge was either blocked or converted by employing two novel piperazinyl based crosslinkers, PBA and PP (Scheme 1). These linkers were designed as piperazine based monomers, have been used to synthesize polycations which have been shown to be potent transfection agents.5–7 Also, piperazine is an important constituent of many biological buffers.8,9 Previously, our group had reported the effect of different homobifunctional groups on the transfection efficiency of PEI nanoparticles. With this concept, we designed PBA and PP crosslinkers to convert PEI into PBAP and PPP nanoparticles, respectively. The PBA linker, consisting of terminal carboxylic acids, reacted with amino groups of PEI in the presence of 1-ethyl-3-[3-dimethylaminopropyl] carbodiimide hydrochloride (EDAC) and converted these into amide functionalities resulting in the charge reduction on PEI. On the other hand, the PP crosslinker, carrying terminal aldehyde groups, formed Schiff's base selectively with primary amino groups of PEI converting them to secondary amines so that the number of amines on PEI remained unaltered. Moreover, the charge responsible for cytotoxicity (primary amines) was converted into the ‘beneficial’ charge of secondary amines that assisted intracytoplasmic endosome rupture to release the nanoparticle/DNA complexes.10
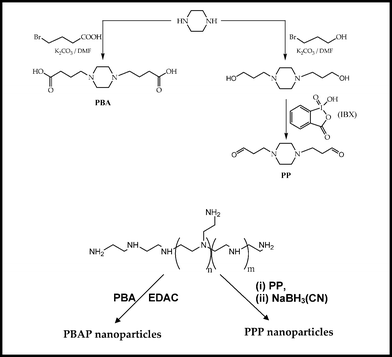 |
| | Scheme 1 Schematic representation of preparation of PBA and PP crosslinkers followed by PBAP and PPP nanoparticles. | |
Characterization of PEI-piperazinyl NPs
PBA reacted with primary and secondary amino groups of PEI in the presence of EDAC resulting in the formation of amide bonds leading to a decrease in the cationic charge density on PEI, although the net reduction in charge was, to an extent, offset by incorporation of piperazine moiety in the crosslinker containing two tertiary amines. In contrast, PP reacted specifically with the primary amines of bPEI to form the Schiff base, which, upon reduction with sodium cyanoborohydride, generated secondary amines, thereby keeping the number of amines in crosslinked PPP nanoparticles unaltered or rather increased due to incorporation of two tertiary amines from a piperazine moiety. Alternatively, the charge responsible for cytotoxicity (primary amines) was converted into the beneficiary secondary amines in case of PPP nanoparticles, which helped in buffering the endosomes to release the nanoparticle/DNA complexes.
The degree of crosslinking in NPs was determined by the 2,4,6-trinitrobenzenesulfonic acid (TNBS) method (Table 1). The percent crosslinking in PBAP NPs, viz., PBAP1, PBAP2, PBAP3, PBAP4, PBAP5, PBAP6 and PBAP7, was found to be 3.8 (5), 6.1 (10), 9.3 (15), 15.7 (20), 17.6 (25), 24.2 (30) and 29.8% (40%) and in the case of PPP NPs, viz., PPP1, PPP2 and PPP3, it was 5.9 (10), 15.5 (20) and 24.4% (30%); values in parentheses indicate the attempted degree of crosslinking.
Table 1 Determination of degree of crosslinking by TNBS method
| Nanoparticles |
Attempted substitution (%) |
Realized substitution (%)± S.D. |
| PPP1 |
10 |
5.9 ±0.23 |
| PPP2 |
20 |
15.5 ±1.16 |
| PPP3 |
30 |
24.4 ±1.75 |
| PBAP1 |
5 |
3.8 ±0.39 |
| PBAP2 |
10 |
6.1 ±0.48 |
| PBAP3 |
15 |
9.3 ±0.76 |
| PBAP4 |
20 |
15.7 ±0.98 |
| PBAP5 |
25 |
17.6 ±1.28 |
| PBAP6 |
30 |
24.2 ±1.98 |
| PBAP7 |
40 |
29.8 ±2.28 |
Particle size and zeta potential measurements
The particle size of NPs and their DNA complexes was determined by DLS (Table 2), TEM and AFM (data not shown). The bigger size of the particles in DLS compared to AFM and TEM might be attributed to the hydrodynamic diameter in DLS studies.11 On increasing the degree of crosslinking, the particle size of PBAP and PPP nanoparticles showed a decreasing trend. However, the size of the NPs increased after complexing with DNA. The zeta potential measurements also showed a decrease in surface charge of all the NPs with increasing crosslinking (Table 2). The decrease in size and zeta potential on increasing the percent crosslinking might be due to the compactness of the polymer and partial charge conversion or masking in NPs. PBAP NPs showed significant decrease in zeta potential compared to their PPP counterparts, which might be due to blockage of amines (primary/secondary) in PBAP NPs, whereas in PPP NPs, the number of amines remained unaltered due to the conversion of primary amines to secondary amines. The small decrease in charge on PPP NPs, on increasing the crosslinking, may be due to the fact that some of the charge on PEI gets buried inside the NPs, hence, unavailable for measurement. Besides, the conversion of primary to secondary amines also contributes to the same. As expected, on complexing NPs with DNA, the zeta potential decreased.12
Table 2 Size and zeta potential measurements of nanoparticles and their DNA complexes
| Samples |
Average particle size in nm (PDI) |
Zeta potential (mV) |
NPs/DNA ratio (N/P) |
| NPs (in H2O) |
NP/DNA complexes (in H2O) |
NP/DNA complexes (in 10% serum) |
NPs in H2O (+) |
NP/DNA complexes (in H2O) (+) |
NP/DNA complexes (in 10% serum) (−) |
|
| PPP Nanoparticles |
| PPP1 |
165.5 ± 3.25 (0.314) |
175.8 ± 2.14 (0.26) |
144 ± 2.13 (0.301) |
27.418 ± 2.25 |
23.14 ± 3.14 |
10.45 ± 1.86 |
15 |
| PPP2 |
151 ± 4.61 (0.29) |
164.4 ± 1.99 (0.184) |
131.78 ± 4.7 (0.107) |
22.4 ± 1.52 |
19.56 ± 1.05 |
10.2 ± 2.01 |
15 |
| PPP3 |
140 ± 2.47 (0.225) |
155.2 ± 3.04 (0.281) |
125.8 ± 3.14 (0.271) |
16.42 ± 1.26 |
14.65 ± 2.11 |
9.61 ± 1.24 |
15 |
| PBAP Nanoparticles |
| PBAP1 |
216 ± 3.04 (0.349) |
230.7 ± 3.78 (0.218) |
197.07 ± 2.61 (0.304) |
25.16 ± 2.05 |
20.09 ± 1.25 |
9.15 ± 0.98 |
15 |
| PBAP2 |
184.7 ± 3.41 (0.256) |
196.14 ± 2.01(0.189) |
161.15 ± 2.01 (0.27) |
23.66 ± 2.21 |
19.7 ± 2.44 |
11.54 ± 0.25 |
15 |
| PBAP3 |
169.46 ± 2.45 (0.228) |
184.2 ± 4.17 (0.276) |
150.24 ± 2.45 (0.110) |
19.87 ± 2.14 |
13.38 ± 1.06 |
10.08 ± 0.66 |
15 |
| PBAP4 |
156.02 ± 3.47 (0.27) |
162.9 ± 2.84 (0.22) |
141.32 ± 2.56 (0.214) |
16.78 ± 1.4 |
12.46 ± 0.97 |
10.75 ± 0.87 |
15 |
| PBAP5 |
134.7 ± 1.42 (0.204) |
147 ± 1.65 (0.199) |
122.75 ± 1.66 (0.166) |
14.56 ± 2.45 |
9.71 ± 0.91 |
9.11 ± 1.9 |
15 |
| PBAP6 |
121 ± 1.98 (0.304) |
137.24 ± 1.55 (0.301) |
110.6 ± 1.69 (0.313) |
11.44 ± 0.61 |
8.43 ± 0.264 |
10.33 ± 1.02 |
15 |
| PBAP7 |
103.06 ± 3.16 (0.191) |
114.87 ± 1.47 (0.333) |
91.79 ± 3.14 (0.224) |
10.65 ± 1.08 |
6.71 ± 0.97 |
9.07 ± 0.15 |
15 |
| PEI |
— |
197.48 ± 1.34 (0.121) |
184 ± 4.11 (0.345) |
30.45 ± 0.47 |
25.9 ± 1.12 |
19.77 ± 1.81 |
8 & 12 |
DNA retardation assay
The DNA binding ability of PBAP and PPP nanoparticles at different N/P ratios, viz., 8, 12, 15, 20, 25, 30 and 35, was assessed on 0.8% agarose gel. PEI retarded pDNA (300 ng) at a N/P ratio of 3, whereas, higher N/P ratios were needed in case of NPs to retard the same amount of DNA (data not shown). This confirmed the shielding of positive charge in NPs, as discussed above.
In vitro transfection
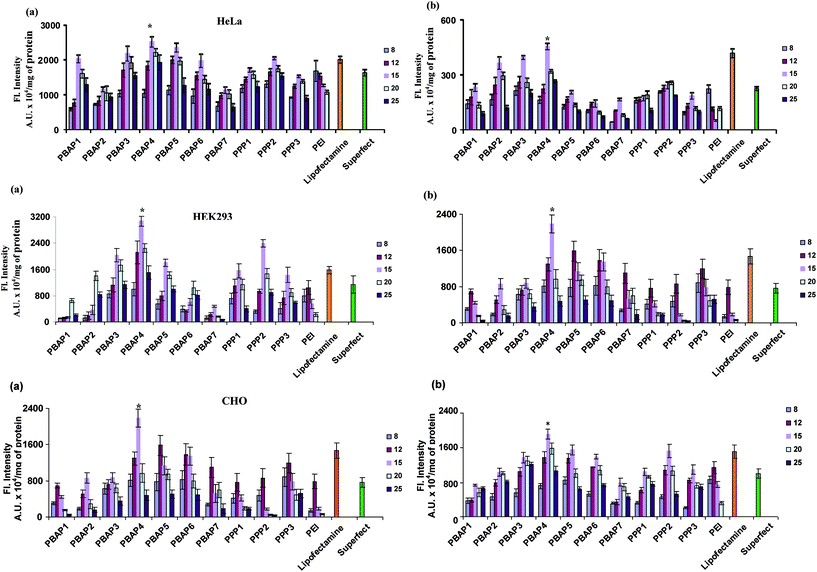
The efficacy of PBAP and PPP nanoparticles to deliver pEGFP was assessed on HEK293, HeLa and CHO cells both in the presence and absence of serum and compared with that of Lipofectamine™ and Superfect™. Transfection efficiency initially increased on increasing the N/P ratio and after attaining an optimal value, showed a decline. The PBAP/DNA complexes exhibited significantly higher levels of gene expression as compared to PPP/DNA complexes (P < 0.05, Fig. 1) with PBAP4/DNA complex mediating the highest GFP expression in cells. In both the series, PBAP4/DNA complex exhibited higher transfection efficiency (1.2–5 folds, P < 0.05) than the native PEI (25 kDa) and selected commercially available transfection reagents such as Lipofectamine™ and Superfect™. Moreover, it was also noticed that the PEI/DNA complex exhibited cell line and N/P ratio dependent transfection efficiency i.e. the highest transfection efficiency at N/P ratio of 8 in HeLa cells, whereas in HEK293 and CHO cells it was observed at N/P ratio of 12. Importantly, the transfection efficiency was significantly higher than commercial reagents in the presence of 10% serum. Fluorescence activated cell sorting (FACS) data also supported the above results and the PBAP4/DNA complex propelled transfection in ∼62% of cells, while it was only ∼32% in the case of PPP2/DNA complex (Fig. 2). The results imply that NPs with a piperazinyl crosslinker having terminal carboxylic acids are better transfection reagents compared to aldehyde counterparts. Our data are in agreement with our previous report where PEI nanoparticles, crosslinked with adipic acid-linker, exhibited higher transfection efficiency in comparison to PEI nanoparticles crosslinked with 1,4-butane dialdehyde, although aldehyde-linker crosslinked PEI NPs displayed better buffering activity than the carboxylic-linker crosslinked PEI NPs.12
 |
| | Fig. 1
In vitro transfection in HeLa, HEK293 and CHO cells at various N/P ratios. (a) and (b) represent transfection in the absence and presence of serum, respectively. The x axis represents the N/P ratios. *P < 0.05 vs. PEI at all N/P ratios and commercial reagents. | |
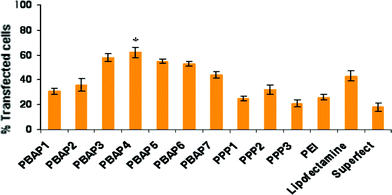 |
| | Fig. 2 Flow cytometry of transfected HeLa cells. *P < 0.05 vs. PEI and commercial reagents. | |
Cytotoxicity assay
Cytotoxicity of PEI/DNA, NP/DNA, Lipofectamine™/DNA and Superfect™/DNA complexes was evaluated on HeLa, HEK293 and CHO cells. PPP/DNA complexes exhibited slightly higher cell viability than their PBAP/DNA counterparts (Fig. 3) at higher N/P ratios. This might be due to the charge conversion from ‘toxic’ primary amines to secondary amines in PPP NPs. In PBAP NPs, where primary and secondary amines of PEI reacted more or less equally with PBA, there could be a higher amount of residual ‘toxic’ primary amines, resulting in comparatively lower cell viability.
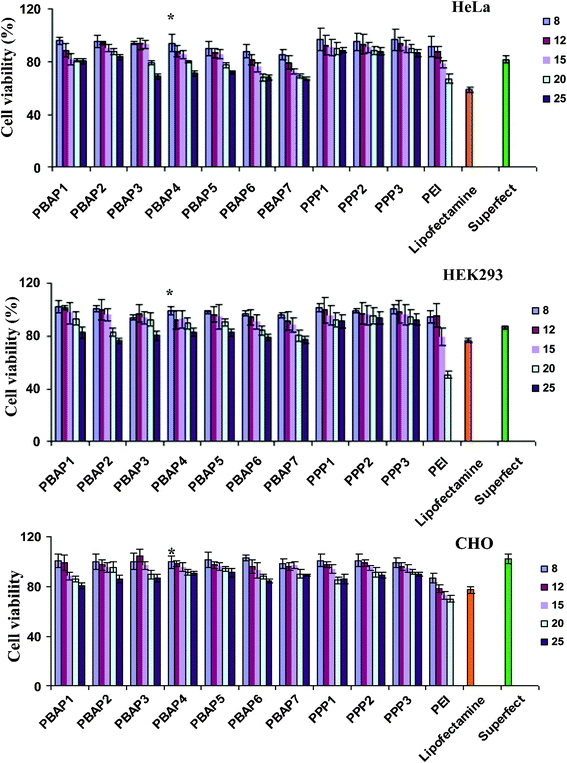 |
| | Fig. 3 Cytotoxicity assay in HeLa, HEK293 and CHO cells. Percent viability of cells is expressed relative to control cells. Each point represents the mean of three independent experiments performed in triplicates. The abscissa represents the N/P ratios. | |
Intracellular trafficking
The cellular uptake of PBAP4/DNA and PPP2/DNA complexes was studied in HeLa cells at different time points. Tetramethylrhodamine labeled PBAP4 and PPP2 nanoparticles and YOYO-1 labeled DNA were used in the present study to follow the uptake of polyplexes in cells. The results showed a higher uptake in case of PBAP4/DNA complex compared to PPP2/DNA complex (data not shown). The results support the FACS analysis, which showed a similar trend. In the case of PBAP4, very few particles were observed inside the cell after 30 min of treatment, which increased with time of exposure (Fig. 4). After 1 h of treatment, the labeled particles as well as complex were seen inside the nucleus. The results showed that modification of PEI with PBA did not hamper the nuclear localization of the complex and was in agreement with our earlier report that showed accumulation of PEI in the nucleus.13
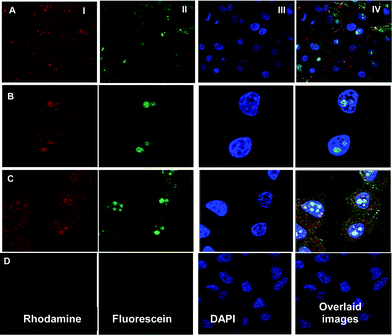 |
| | Fig. 4 Uptake of dual labeled PBAP4/DNA complex in HeLa cells at different time points: (A) 30 min (B) 1 h (C) 3 h and (D) represents the control cells. | |
DNase I protection assay
The efficacy of the projected NPs to protect complexed DNA against nucleases at different time points was examined in vitro. The estimation of DNA, released from their respective complexes after DNase I treatment, was carried out on 0.8% agarose gel. PBAP4 NPs were found to be more efficient in protecting complexed DNA than PPP2 NPs (Fig. 5). The amount of DNA protected by PBAP4 and PPP2 NPs was found to be ∼78 and 65%, respectively, after 2 h of treatment.
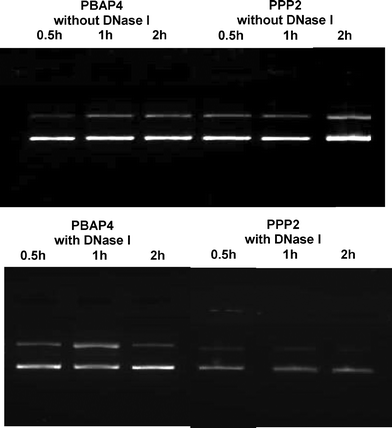 |
| | Fig. 5 DNase I protection assay of PBAP4/DNA and PPP/DNA complexes against DNase I at different time intervals. | |
In vivo gene expression
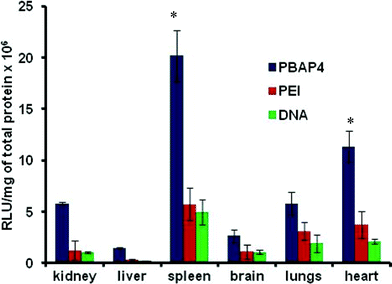
In vivo delivery of pGL3 coding for luciferase expression by PBAP4 NPs (the best working system in terms of transfection efficiency) was studied on Balb/c mice and the results were compared with PEI/DNA complex and naked DNA alone. Naked DNA being susceptible to degradation by nucleases exhibited a significantly low (P < 0.05) level of expression in all the organs, whereas PBAP4/DNA complex showed higher transgene expression in all the organs compared to PEI/DNA complex, which was in accordance with the in vitro results (Fig. 6). The highest gene expression observed in the spleen of mice is intriguing and at present, we do not have any plausible explanation for the same. Further studies are warranted to examine the significance of such expression.
 |
| | Fig. 6
In vivo luciferase expression in various organs of Balb/c mice harvested after seven days of treatment with PBAP4/DNA, PEI/DNA and naked DNA. *P < 0.05 vs. PEI and DNA in respective organs. | |
Experimental
Materials
Branched polyethylenimine (bPEI, av. MW 25 kDa), piperazine, 3-bromopropanol, 4-bromobutyric acid, 1-ethyl-3-(3-dimethylaminopropyl) carbodiimide hydrochloride (EDAC), 2,4,6-trinitrobenzenesulfonic acid (TNBS), sodium dodecyl sulphate (SDS), 3-(4,5-dimethylthiazol-2-yl)-2,5-diphenyltetrazolium bromide (MTT), agarose, Tris, ethidium bromide, xylene cyanol, bromophenol blue, tetramethylrhodamine isothiocyanate (TRITC), 4′,6-diamidino-2-phenylindole dilactate (DAPI) and plasmid DNA encoding for firefly luciferase expression (pGL3) were bought from Sigma (USA). Commercial transfection agents, viz., Lipofectamine™ and Superfect™, were procured from Invitrogen (USA) and Qiagen (France), respectively. Cell culture products were purchased from Gibco-BRL-Life Technologies (UK). Plasmid isolation kit was purchased from Qiagen (France). The plasmid pEGFPN3 was procured from Clontech (USA). The particle size and zeta potential of nanoparticles and their DNA complexes were determined on Zetasizer Nano-ZS (Malvern instruments, UK). The size and morphology of nanoparticles and DNA complexes were determined by Atomic Force Microscopy (AFM) (PicoSPM System, Molecular Imaging, USA). Transmission Electron Microscopic (TEM) images of nanoparticles were recorded on a Fei-Phillips, Morgagni 268D microscope (USA). GFP reporter gene expression was detected under Nikon Eclipse TE 2000-S inverted microscope (Japan). Green fluorescent protein (GFP) was analyzed on a NanoDrop® ND-3300 spectrofluorometer (USA) at an excitation wavelength of 488 nm and emission at 509 nm. Fluorescent activated cell sorting (FACS) was carried out on a Guava EasyCyte Plus™ flow cytometry system (USA). Labeled nanoparticles and nanoparticle/DNA complexes were monitored on a LSM 510 Meta fitted to an inverted microscope (Axio Observer, Zeiss, Germany). Nuclear magentic resonance (NMR) spectra (1H and 13C) were recorded on a Varion Inova 600 MHz spectrometer equipped with actively shielded Z-gradient triple resonance probe. Spectra were processed by using the VNMRJ ver 2.1c software. LC-MS mass spectra were obtained from QuattroMicro API Triple Quaderpole mass spectrometer (Waters, USA).
Animals
Male Balb/c mice (6–7 weeks old, 25±3 g) were acquired from the animal breeding colony of the Indian Institute of Toxicology Research (IITR), Lucknow (U.P., India) and acclimatized under standard laboratory conditions. They were provided a commercial pellet diet (Ashirwad Industries, Chandigarh, India) and water ad libitum. Animals were housed in plastic cages on rice husk bedding and maintained at 22±2 °C with 12 h dark/light and 50–60% humidity as per the standard husbandry conditions practised at IITR. Further, these animals were cared for humanely as per the guidelines laid down by the Animal Ethics Committee of the Institute.
Preparation of PBAP and PPP nanoparticles
Synthesis of piperazine-N,N′-dibutyric acid (PBA).
PBA was synthesized by reacting piperazine (80 mg, 0.93 mmol) with 4-bromobutyric acid (0.4 g, 2.4 mmol) in the presence of potassium carbonate (0.4 g, 2.8 mmol) in dry DMF (25 ml). The reaction mixture was stirred for 16 h at 100 °C. Subsequently, dilute HCl (0.5N, 40 ml) was added and the reaction mixture concentrated in vacuo. The syrupy residue was triturated with EtOAc (3 × 10 ml) and after removal of traces of solvent, the crude compound was further purified by silica gel chromatography using a gradient of chloroform-methanol. The fractions containing the pure compound were pooled together and concentrated to obtain PBA in ∼73% yield, which was characterized by its 1H-NMR [D2O, δ: 1.15 (m, 4H, 2 x–CH2–), 2.82 (t, 4H, 2 x –CH2CO–), 3.08 (m, 8H, 4 x –CH2N), 3.38 (m, 4H, 2 x–NCH2–), 13C-NMR [δ:41.45 (–CH2–),46.65 (–CH2CO–), 53.17 (–NCH2–), 58.6 (–NCH2–)] and LC-MS [m/z, calcd.: 258; found: 295 (M+K+-2H+)]
Synthesis of piperazine-N,N′-dipropanal (PP).
Similarly, PP was synthesized, as described above, except that 3-bromopropanol (0.35 g, 2.5 mmol) was used instead of 4-bromobutyric acid. The product, piperazine-N,N′-dipropyl alcohol, was obtained in ∼78% yield. In the next step, it was oxidized with 2-iodoxybenzoic acid following the standard protocol14 to yield PP in ∼92% yield, which was characterized by 1H-NMR [CD3OD, δ: 2.8–2.9 (m, 16H, 6 x–CH2–N, 2 x–CH2CO–), 8.06 (2H, 2 x–CHO)], 13C-NMR [δ: 38.99 (–CH2CO–), 47.1–48.0 (–NCH2–), 168.69 (–CHO)] and LC–MS [m/z, calcd.: 198; found: 200 (M+2H)].
Synthesis of piperazine-N,N′-dibutyramide-PEI (PBAP) and piperazine-N,N′-dipropyl-PEI (PPP) nanoparticles.
PBAP and PPP NPs were prepared by reacting a solution of PEI (50 mg, 1 mg ml−1 of H2O) with an aqueous solution of piperazine-N,N′-dibutyric acid (15 mg, 1 mg ml−1, for 10% crosslinking) in the presence of 1-ethyl-3-(3-dimethylaminopropyl) carbodiimide hydrochloride (EDAC, 25 mg) and piperazine-N,N′-dipropanal (12 mg, 1 mg ml−1, for 10% crosslinking) for 2 h followed by the addition of sodium cyanoborohydride (10 mg), respectively. The reaction mixtures were stirred overnight, dialyzed using 12 kDa cut off membrane against water for two days followed by lyophilization to obtain PBAP and PPP NPs. Similarly, other PBAP (degree of crosslinking: 15, 20, 25, 30 and 40%) and PPP (degree of crosslinking: 20 and 30%) NPs were prepared.
The degree of crosslinking in NPs was determined by 2,4,6-trinitrobenzenesulfonic acid (TNBS) method.4 Briefly, wells of an ELISA plate were charged with PBAP nanoparticle suspensions (50 μl) with different concentration and added solutions of NaHCO3 (4%, 50 μl) and TNBS (0.1%, 50 μl). The plate was incubated for 2 h at 40 °C and subsequently, SDS (10%, 50 μl) and HCl (1N, 25 μl) were added to each well and absorbance read at 420 nm. The residual amino groups in nanoparticles were calculated from a standard calibration curve drawn by taking known concentrations of PEI.
Preparation of nanoparticle/DNA complexes
NP/DNA complexes were formed by mixing pDNA (0.3 μg μl−1) and NPs at different N/P ratios (8, 12, 15, 20, 25, 30, 35) in 5% dextrose and incubated for 30 min at ambient temperature prior to their use in biophysical studies or transfection experiments.
Size and zeta potential measurements
The particle size and zeta potential of PBAP and PPP nanoparticles and their DNA complexes were measured. Lyophilized nanoparticles were suspended in water and particle size and zeta potential determined by DLS using Zetasizer Nano-ZS. Similarly, their DNA complexes were prepared and measured their size and zeta potential. Particle size of nanoparticles and DNA complexes was also determined by AFM operating in acoustic mode, using SPIP software15 and TEM. All the measurements were carried out in triplicates with 20 subruns.
DNA retardation assay
The DNA binding ability of PBAP and PPP nanoparticles at N/P ratios of 8, 12, 15, 20, 25, 30, 35, was assessed on 0.8% agarose gel. DNA complexes of PBAP, PPP and PEI were formed, as described earlier, and electrophoresed. Samples (20 μl) were mixed with 2 μl xylene cyanol (in 20% glycerol), electrophoresed (100 V, 1 h) on 0.8% agarose, stained with ethidium bromide and visualized on a UV transilluminator.
In vitro transfection studies
Plasmid DNA encoding for enhanced green fluorescent protein (EGFP) was complexed with PEI, PBAP and PPP nanoparticles. The complexes were prepared at N/P ratios of 8, 12, 15, 20 and 25 keeping the amount of DNA fixed (300 ng). DNA complexes were also prepared with Lipofectamine™ and Superfect™, as prescribed in the manufacturers' protocols. The complexes were subsequently transfected in various mammalian cells, viz., HEK293, HeLa and CHO, as described in the literature.11 The transfection was also carried out in the presence of 10% fetal bovine serum (FBS) wherein, the polyplexes formed were diluted with DMEM containing 10% FBS. After 36 h of transfection, the expression of GFP reporter gene was observed under an inverted fluorescent microscope at 10× magnification and the cellular GFP was quantified on a NanoDrop® ND-3300 spectrofluorometer. For quantification, cells were washed with 1× PBS (2 × 100 μl), lysed (10 mM Tris, 1 mM EDTA and 0.5% SDS pH 7.4, 100 μl) and agitated for 20 min at 25 °C. Cell lysate (2 μl) was estimated spectrofluorometrically for GFP at an excitation wavelength of 488 nm and emission at 509 nm and corrected for background and auto-fluorescence by mock-treated cells. Total protein content in cell lysate from each well was estimated using Bradford reagent using BSA (Bangalore Genei, India) as the standard. The GFP fluorescence was expressed as arbitrary units/mg protein. All the experiments were repeated at least thrice. Also, the percent HeLa cells expressing GFP was estimated by fluorescence activated cell sorting assay (FACS). Post 36 h transfection, cells were removed by trypsinization and assessed for percent transfection. All experiments were carried out in triplicate.
Cytotoxicity assay
The cytotoxicity of nanoparticles was tested in HEK293, HeLa and CHO cells. Cells were transfected with PBAP/DNA, PPP/DNA, PEI/DNA, Lipofectamine™/DNA and Superfect™/DNA complexes, as described in the transfection studies. After 36 h of transfection, the media was replaced with 0.2 ml MTT reagent (0.5 mg dissolved in 1.0 ml of DMEM) and incubated (2 h). The supernatant was removed and formazan crystals, thus formed, were suspended in 100 μl isopropanol containing 0.06 M HCl and 0.5% SDS. Cells, without treatment with DNA complexes, served as controls with 100% viability, while wells with MTT reagent alone were used as blanks to calibrate the spectrophotometer. The cell viability (%) was estimated as [abs]transfected/[abs]control × 100. All experiments were repeated at least thrice.
Confocal laser scanning microscopic studies
The intracellular trafficking of PBAP4 nanoparticles (the best working system) and its DNA complex was studied by confocal microscopy in Hela cells. For this, the nanoparticles and pDNA were labeled with tetramethylrhodamine (TMR) and YOYO-1, respectively, as described previously.11 The HeLa cells at a cell density of 1.4 × 10⁵ cells/well were seeded on cover slips in six-well plates and allowed to adhere for 16 h. Cells were incubated with a suspension of labeled nanoparticles and dual labeled complex for 30 min, 1 h and 3 h. After each time interval, the media was aspirated out and the plates were washed three times with sterile 1× PBS. At predetermined time intervals, the cells were fixed with 4% (v/v) paraformaldehyde in 1× PBS for 10 min at 25 ± 2 °C and washed four times with 1× PBS. Individual coverslips were stained with DAPI and then mounted on a clean glass slide with fluorescence-free glycerol-based mounting medium (UltraCruz™ Mounting Medium, Santa Cruz Biotechnology, USA) and observed under a confocal microscope.
DNase I protection assay
The ability of nanoparticles to confer protection to complexed DNA against nucleases was investigated by a DNase I protection assay. Native DNA, PBAP4/DNA and PPP2/DNA complexes (N-P ratio 15) were treated with 1 μl DNase I (1 unit/μl in a buffer containing 100 mM Tris, 25 mM MgCl2 and 5 mM CaCl2) and incubated for different time intervals. Samples treated with PBS alone served as a control. After incubation, 5 μl of 100 mM EDTA was added to inactivate DNase I and incubated at 75 °C for 10 min. The mixture was further incubated for 2 h at 25 ± 2 °C with 10 μl heparin (5 mg ml−1) to dissociate DNA complexes. The resulting samples were electrophoresed on 0.8% agarose gel, stained with EtBr, visualized and photographed on the Alpha Imager (Alpha Innotech, San Leonardo, CA). The amount of DNA released from complexes after heparin treatment was estimated by densitometry.
In vivo gene expression
PBAP4 and PEI were complexed with pGL3 (25 μg) at w:w ratios 4 and 1, respectively, and incubated for 30 min at 25 ± 2 °C. The final volume was made upto 100 μl using normal saline. The complexes and pGL3 alone (25 μg) were injected in Balb/c mice through the tail vein using a syringe of 40U with needle size 0.30 × 8 mm. After injection, the animals were kept for seven days on a normal diet, after which they were sacrificed by cervical dislocation and all the vital organs were dissected out. The organs were washed with chilled normal saline, weighed, chopped and made 25% w/v homogenate in 1x cell lysis buffer (Promega, USA) containing 1x protease inhibitor cocktail (Sigma, USA). After three cycles of freezing and thawing, the homogenate was centrifuged at 10![[thin space (1/6-em)]](https://www.rsc.org/images/entities/char_2009.gif) 000g for 10 min at 4 °C. From each sample, 100 μl of the cell lysate was assayed for luciferase activity by adding 100 μl luciferin substrate on the luminometer (Berthold, Germany). A standard curve was drawn using luciferase enzyme provided with the kit. The experiment was carried out in triplicate.
000g for 10 min at 4 °C. From each sample, 100 μl of the cell lysate was assayed for luciferase activity by adding 100 μl luciferin substrate on the luminometer (Berthold, Germany). A standard curve was drawn using luciferase enzyme provided with the kit. The experiment was carried out in triplicate.
Conclusions
The series of novel PBAP and PPP nanoparticles show significant improvement in transfection efficiency over the commercial transfection agents in vitro. These novel nanoparticles exhibited minimal toxicity and PBAP nanoparticles scored higher compared to PPP counterparts in mediating GFP expression in cells, whereas PPP series displayed higher cell viability. The confocal imaging of intracellular trafficking of PBAP and PPP nanoparticles indicate the internalization by cells within 30 min of exposure. PBAP4 protected complexed DNA very efficiently in vitro, which makes it suitable to be used for in vivo gene delivery. In Balb/c mice, the PBAP4/DNA complex showed differential gene expression in harvested organs with the highest expression in the spleen. These studies imply that piperazinyl based PEI nanoparticles may be further improved for targeted gene delivery especially to the spleen.
Acknowledgements
The authors acknowledge the financial support from CSIR Task Force Project (NWP035).
References
- K. Tan, P. Cheang, I. A. Ho, P. Y. Lam and K. M. Hui, Gene Ther., 2007, 14, 828–835 CrossRef CAS.
- K. Zwiorek, J. Kloeckner, E. Wagner and C. Coester, J. Pharm. Pharm. Sci., 2005, 7, 22–28 Search PubMed.
- D. Fischer, Y. Li, B. Ahlemeyer, J. Krieglstein and T. Kissel, Biomaterials, 2003, 24, 1121–1131 CrossRef CAS.
- W. C. Tseng, C. H. Tang and T. Y. Fang, J. Gene Med., 2004, 6, 895–905 CrossRef CAS.
- S. A. Chew, M. C. Hacker, A. Saraf, R. M. Raphael, F. K. Kasper and A. G. Mikos, Biomacromolecules, 2009, 10, 2436–2445 CrossRef CAS.
- S. Barua, A. Joshi, A. Banerjee, D. Matthews, S. T. Sharfstein, S. M. Cramer, R. S. Kane and K. Rege, Mol. Pharmaceutics, 2009, 6, 86–97 CrossRef CAS.
- R. U. Islam, J. Hean, W. A. L. Otterlo, C. B. Koning and P. Arbuthnot, Bioorg. Med. Chem. Lett., 2009, 19, 100–103 CrossRef CAS.
- T. R. Theodore, R. L. Van Zandt and R. H. Carpenter, Cancer Biother. Radiopharm., 1997, 12, 351–353 CrossRef CAS.
- S. K. Wiedmer, M. Jussila, R. M. S. Hakala, K. H. Pystynen and M. L. Riekkola, Electrophoresis, 2005, 26, 1920–1927 CrossRef CAS.
- X. Gao and D. Liu, Mol. Ther., 2005, 11, S427–S428 CrossRef.
- S. Patnaik, M. Arif, A. Pathak, R. Kurupati, Y. Singh and K. C. Gupta, Nanomed.: Nanotechnol., Biol. Med., 2010, 6, 344–354 CrossRef CAS.
- A. Swami, R. Goyal, S. K. Tripathi, N. Singh, N. Katiyar, A. K. Mishra and K. C. Gupta, Int. J. Pharm., 2009, 374, 125–138 CrossRef CAS.
- W. T. Godbey, K. W. Kenneth and A. G. Mikos, Proc. Natl. Acad. Sci. U. S. A., 1999, 96, 5177–5181 CrossRef CAS.
- J. D. More and N. S. Finney, Org. Lett., 2002, 4, 3001–3003 CrossRef CAS.
- A. Mann, R. Richa and M. Ganguli, J. Controlled Release, 2008, 125, 252–262 CrossRef CAS.
|
| This journal is © The Royal Society of Chemistry 2012 |
Click here to see how this site uses Cookies. View our privacy policy here. 


![[thin space (1/6-em)]](https://www.rsc.org/images/entities/char_2009.gif) 000g for 10 min at 4 °C. From each sample, 100 μl of the cell lysate was assayed for luciferase activity by adding 100 μl luciferin substrate on the luminometer (Berthold, Germany). A standard curve was drawn using luciferase enzyme provided with the kit. The experiment was carried out in triplicate.
000g for 10 min at 4 °C. From each sample, 100 μl of the cell lysate was assayed for luciferase activity by adding 100 μl luciferin substrate on the luminometer (Berthold, Germany). A standard curve was drawn using luciferase enzyme provided with the kit. The experiment was carried out in triplicate.
