Diffusion–diffraction using singlet spin states and various NMR coherences in a J-coupled AX spin system
Allan M.
Torres
*,
Bahman
Ghadirian
and
William S.
Price
Nanoscale Organisation and Dynamics Group, University of Western Sydney, Penrith, NSW 2751, Australia. E-mail: a.torres@uws.edu.au; Fax: (61 2) 4620-3025; Tel: (61 2) 4620-3459
First published on 13th January 2012
Abstract
The diffusion–diffraction decay profile of singlet states and various NMR coherences in a J-coupled AX spin system was studied using capillaries with internal diameters ranging from 20 to 450 μm. A pulsed gradient diffusion sequence based on the singlet state NMR diffusion sequence was used for generating longitudinal spin-pair order, zero-quantum and double-quantum coherences. The degree of definition in diffusion–diffraction profiles was observed to be dependent on the type of coherence and the sequence employed. Singlet states, longitudinal spin-pair order and zero-quantum coherences produced diffusion–diffraction profiles that were similar and had more pronounced features than those obtained from transverse and longitudinal magnetisations using standard spin-echo (i.e., PGSE) and stimulated echo (i.e., PGSTE) based pulsed gradient sequences. Although PGSTE provides a higher signal-to-noise ratio at shorter diffusion times, the singlet state sequence affords better diffusion–diffraction profiles and an enhanced signal-to-noise ratio at longer diffusion times. These developments allow pores with macroscopic dimensions to be probed, which was previously only possible using gas-phase NMR diffusion measurements.
Introduction
Diffusion NMR is a popular technique that is now routinely used to study various molecular properties, processes and interactions occurring in solution.1 This important analytical tool which can provide detailed information about molecular binding and aggregation can also be valuable in NMR imaging as well as for characterising microscopic geometries.2 The latter application is possible since the diffusion of chemical entities in restricted microscopic geometries is generally slower and in restricted geometries, such as in suspensions of red blood cells and polystyrene beads in various solvents, diffusion–diffraction like NMR signal decay profiles can be obtained.3,4 To increase the applicability of the NMR diffusion method it is important to increase its robustness and performance. Recent efforts in our laboratory have included efforts to minimise the deleterious effects of J-evolution5,6, background gradients,7 multi-quantum extensions8 and others.9The most common pulse sequences used in diffusion NMR are the pulsed gradient spin-echo (PGSE)10 and pulsed gradient stimulated echo (PGSTE)11 (see Fig. 1A and 1B).12 Both sequences have their own strengths and weaknesses depending on the type of system being investigated or information required. The main difference between the two sequences is the type of coherence or magnetisation used during the diffusion period, Δ. PGSE uses transverse magnetisation (i.e., Ix or Iy), whilst PGSTE uses predominantly longitudinal magnetisation, Iz. Hence, the relaxation of the magnetisation during the Δ delay in PGSE is characterised by the transverse relaxation time constant T2, whilst in PGSTE it is primarily determined by the longitudinal relaxation time constant T1. Thus, for measurements of large biomolecules, where T2 ≪ T1, PGSTE is preferred over PGSE. On the contrary, in dilute samples containing small molecules, PGSE is favoured over PGSTE as it can provide up to twice the NMR signal-to-noise (S/N).
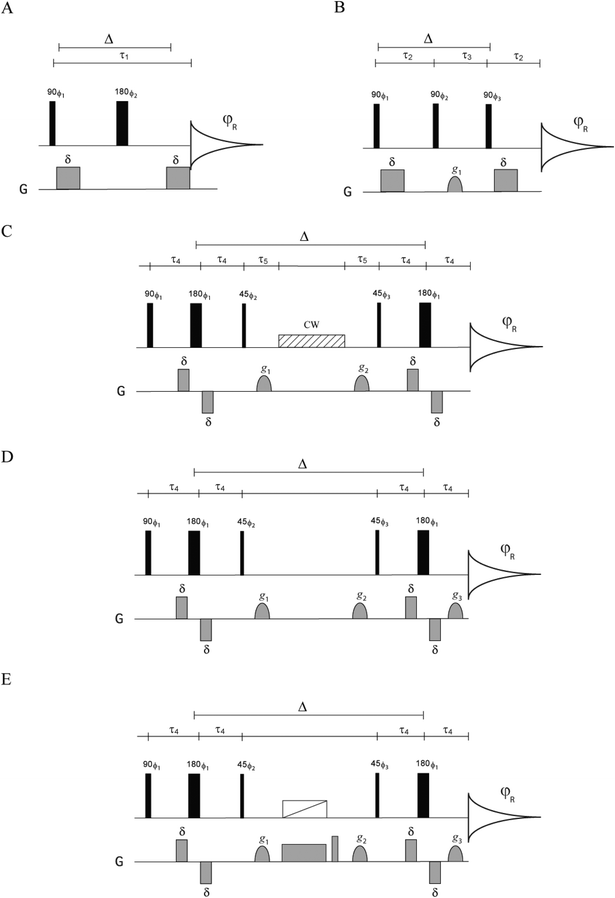 | ||
| Fig. 1 Standard and specialised diffusion pulse sequences for the selection of various coherences: (A) PGSE, (B) PGSTE, (C) singlet state, (D) general diffusion sequence for selecting various coherences and spin order, and (E) longitudinal spin-pair order diffusion sequence. The singlet state sequence (C) developed by Vasos and Cavadini19 was used as a template for sequences (D) and (E). φR refers to the receiver phase. For PGSE, ϕ1 = x, −x; ϕ2 = x, −x, y, −y, −x, x, −y, y; φR = x, −x, −x, x. For PGSTE, ϕ1 = x; ϕ2 = x, y, −x, −y; ϕ3 = x, y, −x, −y, −x, −y, x, y; φR = −x, x, −x, x, x, −x, x, −x. For all other sequences; ϕ1 = x; ϕ2 = x, y, −x, −y; ϕ3 = x, y, −x, −y, −x, −y, x, y; φR = x, x, x, x, −x, −x, −x, −x. G describes the magnetic pulse field gradient implementation in the pulse sequence. | ||
Recently, long-lived singlet spin states13–17 have been utilized in diffusion18–21 and diffusion–diffraction studies.22 The big advantage of exploiting this type of spin order or state for NMR diffusion studies is that it has significantly longer lifetimes16,23,24 (in the order of tens of seconds to a minute) making it feasible to study extremely slowly diffusing molecules. In diffusion–diffraction studies, long lived singlet states can potentially be useful for probing structures with larger characteristic distances (e.g., the radius in the case of a sphere) as it allows the time over which diffusion is measured (Δ) to be greatly expanded. Indeed, the use of singlet states allows porous media with macroscopic characteristic distances to be studied, which was previously only possible with gas phase NMR diffusion measurements.25 This was demonstrated in our latest study22 in which diffraction patterns for parallel planes separated by 200 μm and for glass capillaries with an internal diameter of 800 μm were obtained using a sample of 50% 2,3-dibromothiophene in CDCl3. This study also demonstrated that the singlet state diffusion–diffraction profile is different to that of the longitudinal magnetisation profile as obtained in PGSTE.
In this paper, we extend our q-space imaging study of singlet states on restricted geometries composed of micro capillaries of different sizes in order to better characterise their diffusion–diffraction profiles and understand their relaxation properties. We also studied the diffusion–diffraction profiles of longitudinal spin-pair order, zero-quantum and double-quantum coherences in micro capillaries for comparison with those of singlet spin states and conventional magnetisations.
Theory
Pulse sequences for generating various coherences and spin order
In 2008 Cavadini and Vasos19 introduced three diffusion sequences for generating the long lived singlet states that can be used for studying slow diffusion. Sequence B in their paper (Fig. 1C) is useful for our purposes as the first part of it generates the various coherences considered in this study. A general pulse sequence for generating various coherences or spin order for diffusion based on sequence B is presented in Fig. 1D. To illustrate the mechanics of this sequence and its utility, we first consider a sample containing homonuclear J-coupled spins I and S (or A and X) and follow the transformation of coherences during the first part of the pulse sequence up to the first 45° RF pulse. This sequence, which can be written as| 90°0 − τ4 − 180°90 − τ4 −45°90 | (1) |
| Iz + Sz → 2IxSx − 2IzSz ≡ DQx + ZQx − 2IzSz | (2) |
| Coherence(s) during diffusion period | Values of g1, g2 and g3 |
|---|---|
| DQx + ZQx − 2IzSz | g 1 = 0; g2 = 0; g3 = 0 |
| DQx | g 3 = 2g1; g2 = 0 or |
| g 3 = 2g2; g1 = 0 | |
| ZQx − 2IzSz | g 1 + g2 ≠ 0; g3 = 0 |
The singlet state diffusion sequence
The combination of zero and longitudinal spin-pair order, ZQx − 2IzSz, obtained from the transformation in (2) can be converted to singlet states by appending a precession delay τ5 = π/|ωI − ωS| to convert (ZQx − 2IzSz) to −(ZQx − 2IzSz) and this is then followed by an RF continuous wave (CW) or composite pulse decoupling (CPD).19 The singlet state diffusion sequence, which comprises sequence B of Cavadini and Vasos19 with more elaborate phase cycling, is presented in Fig. 1C.The longitudinal spin-pair order diffusion sequence
The longitudinal spin-pair order 2IzSz can be selected from ZQx − 2IzSz by eliminating the zero-coupling, ZQx coherence; this can be achieved by the application of a chirp based z-filter during the diffusion delay Δ (Fig. 1E). A similar approach has been applied by various workers15,19,28 for removing the ZQ coherence contribution to singlet state diffusion.PGSE attenuation in cylindrical capillaries
The experimental diffusion–diffraction profiles in the capillaries can be simulated using the echo signal attenuation expression for particles diffusing in a cylinder given by29 | (3) |
| βnkJ'(βnk)/Jn(βnk) = −Ma/D. | (4) |
 | (5) |
Methods
Experimental
Experiments were performed at 298 K on a Bruker Avance 500 wide bore spectrometer with a 5 mm TXI inverse probe and a Bruker Avance 400 spectrometer equipped with a 5 mm BBO probe. The TXI probe incorporates a triple axis gradient system capable of achieving maximum gradient strengths of 45.1, 46.6 and 60.3 G cm−1 in the x-, y- and z-axes, respectively, whilst the BBO probe incorporates a single axis z-gradient capable of achieving a maximum gradient strength of ∼53 G cm−1. In typical experiments, the 1H 90° pulse length was ∼8–14 μs and the number of scans ranged from four to sixteen. The homospoil gradient applied in the PGSTE sequence had a strength of 2.7 G cm−1 and a duration τh = 10 ms. The chirp pulse was calibrated according to the recommendation of Thrippleton et al.,30 and was set to have an RF field strength of 1 kHz, duration τc = 30 ms and was swept through 20 kHz. The samples used were 2,3-dibromothiophene 10% (v/v) in CDCl3 for the free diffusion and 50% (v/v) in CDCl3 for the restricted diffusion measurements. The homonuclear J-coupling delay τ4 was set to 43.4 ms corresponding to JIS = 5.76 Hz while a CW RF field strength of 1 kHz was applied to lock the singlet states. As the chemical shift difference between the two coupled protons of 2,3-dibromothiophene is only 0.31 ppm (which corresponds to 155 Hz at a proton resonance frequency of 500 MHz), this spin locking RF field nutation frequency was sufficient to effectively suppress intramolecular dipole–dipole relaxation.23A 10 m length of flexible 20 μm i.d. capillary was obtained from Polymicro Technologies (TSP020150; Phoenix AZ) and cut into 4–5 cm lengths. These capillaries were then stacked in a 4 mm EPR tube which was then filled with 50% (v/v) 2,3-dibromothiophene in CDCl3; this vessel was finally inserted into a regular 5 mm NMR tube. Glass capillaries (Drummond Microcaps; Broomall, PA) of 140, 280 and 450 μm i.d. with internal volumes of 0.5, 2 and 5 μL, respectively were obtained from Sigma-Aldrich. All of the three types of capillary were 32 mm in length. Stacks of glass capillaries were put in 5 mm Shigemi tubes (BMS-005, Tokyo, Japan) and were submerged in 50% (v/v) 2,3-dibromothiophene in CDCl3. The inner glass plunger was then inserted to the NMR tube and was set to rest on top of the capillary tubes. Schematic diagrams of the two capillary stack samples used in this study are presented in Fig. 2. The presence of substantial amounts of liquid sample containing CDCl3 outside the capillaries allowed the NMR experiment to be performed with deuterium locking thereby facilitating shimming of the magnetic field to obtain better line shape and sensitivity.
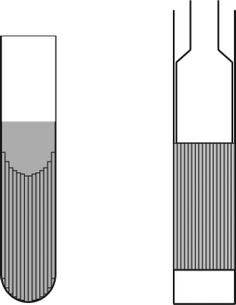 | ||
| Fig. 2 Schematic diagram of the NMR samples containing stacked capillaries. Left: flexible capillaries in a 4 mm EPR tube; right: glass capillaries in a 5 mm Shigemi tube. | ||
Simulations and data fitting
Diffraction profiles were simulated using eqn (3) and were regressed onto the experimental data using non-linear least squares fitting with programs written in MathCad (PTC, MA, USA). To provide better fitting of the simulated data to the experimental results, Gaussian distributions of the capillary diameters were included, and also contributions from free diffusion between the capillaries were considered as fitting parameters.Results and discussion
Echo attenuation profiles of freely diffusing 2,3-dibromothiophene
To determine the suitability of the various pulse sequences for diffusion–diffraction studies, a preliminary assessment of their performance was undertaken using a sample of 10% 2,3-dibromothiophene in CDCl3 in a regular 5 mm NMR tube. This test sample represents a freely diffusing molecule which incorporates a proton AX or IS J-coupled spin system. The normalised diffusion signal decay profiles are the sum of the two protons in 2,3-dibromothiophene using the pulse sequences presented in Fig. 1 and are presented in Fig. 3. The diffusion coefficient D can be obtained from the experimental echo attenuation data by non-linear least squares fitting of the normalized spin-echo attenuation function,10| exp(−γ2Dg2δ2(Δ − δ/3)). | (6) |
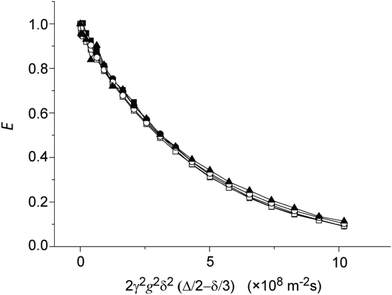 | ||
| Fig. 3 1H echo signal attenuation of 2,3-dibromothiophene diffusing freely in CDCl3 using different diffusion sequences for coherence selection: ■ Iz (PGSTE), ● DQx, □ ZQx − 2IzSz, ○ singlet and ▲ 2IzSz. | ||
As shown in Fig. 3, each sequence gave a similar diffusion signal decay profile and within experimental error a diffusion coefficient of 2.2 × 10⁻⁹ m2 s−1. The slight differences in the measured D values can be attributed to minor instrumental errors such as small RF pulse imperfections and that the various NMR coherences behave differently under RF pulses and delays.
Diffusion–diffraction in flexible capillaries
Unlike the flexible tube system studied by Avram and co-workers31 in which the diffusing species was only present inside the tube, the capillary systems used in this part of the study contained diffusing species inside and outside the tube. Thus, this system is characterised by restricted diffusion inside the tube (cylinder) and a ‘somewhat unrestricted diffusion’ outside the tube wherein, on the same time scale, molecules are less restricted in the outer domain than what they are inside the capillaries.Diffusion–diffraction data obtained using various coherences in flexible capillaries are presented in Fig. 4. In this experiment, Δ was set to 1 s and 2 s with δ = 5 ms. Diffusion–diffraction was observed for all coherences except for DQ (results not shown) as the signals for this type of coherence were barely detectable. The single minimum occurring during the later part of the diffusion decay at q ∼ 6 × 10⁴ m−1 is the (first) characteristic diffusion–diffraction minimum whose value is inversely related to the characteristic distance of the capillary. The separation of the minima in the diffusion–diffraction is inversely proportional to the internal diameter or the radius of the capillaries. The change in the slope or inflection early in the signal decay can be ascribed to two possible causes. Firstly, it could be caused by the summation of two types of diffusion: (i) free diffusion which dominates the first few points of the decay giving it a steeper slope and (ii) restricted diffusion which gives the subsequent gentler slope. Secondly, this inflection point for diffusion outside the capillaries which is analogous to multi-slit diffraction–interference is due to pore hopping.3,32,33 Visual inspection of the capillary set-up reveals that the sample tube is not completely packed with flexible capillaries so that substantial regions in the sample contained free (unrestricted) solution—similar to the case shown in Fig. 5. Thus, the first part of the diffusion curve is likely dominated by free diffusion (the first possible cause).
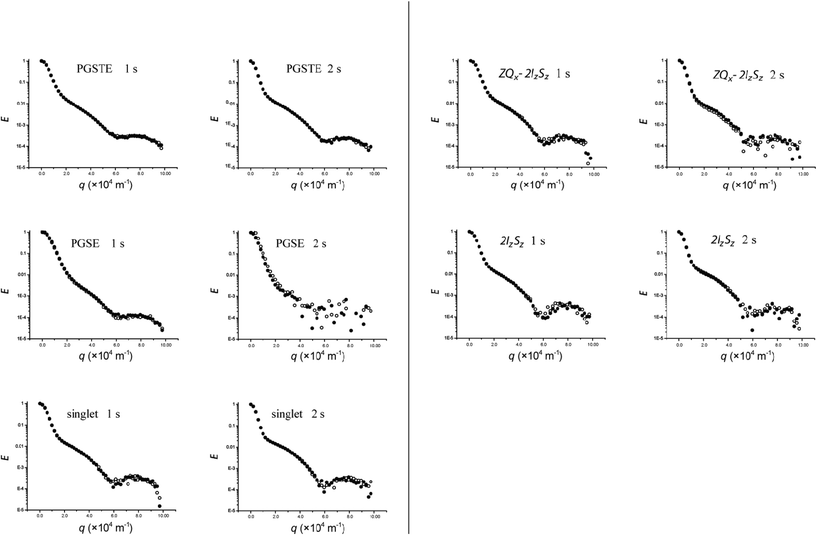 | ||
| Fig. 4 1H echo signal attenuation plots of 2,3-dibromothiophene diffusing in a stack of 20 μm i.d. flexible capillaries using various diffusion sequences at Δ = 1 and 2 s. ● first doublet, ○ second doublet. | ||
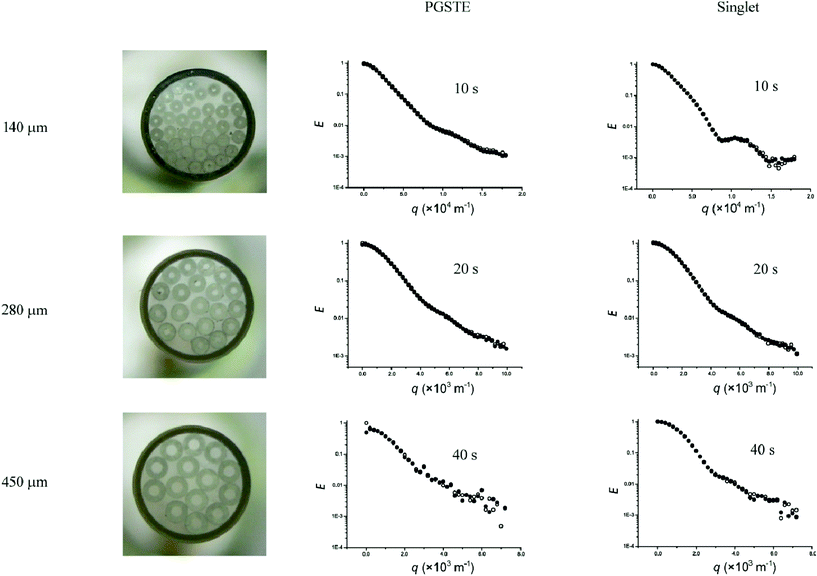 | ||
| Fig. 5 1H echo signal attenuation plots of 2,3-dibromothiophene diffusing in a stack of glass capillaries with internal diameters of 140, 280 and 450 μm using PGSTE and singlet state diffusion sequences. ● first doublet, ○ second doublet. | ||
The sensitivity of the sequences can be better compared at Δ = 2 s than at 1 s as the noise becomes more evident at Δ = 2 s (see Fig. 4) with PGSTE > singlet state > PGSE. The low sensitivity of the PGSE sequence resulted from the rapid transverse relaxation and the deleterious effects of J-coupling modulation. Consequently the PGSE sequence has only limited utility compared to the PGSTE and singlet state sequences for measuring diffusion–diffraction at long Δ values.
Careful comparison of the diffusion–diffraction curves in Fig. 4 for Δ = 1 s reveals that while the PGSTE and PGSE sequences displayed very similar profiles, the other sequences (singlet, ZQx − 2IzSz and 2IzSz) produced distinctly different profiles wherein the diffusion–diffraction features are more pronounced. This is in agreement with our previous study on singlet states where it was observed that its diffusion–diffraction was more defined than that of the conventional PGSTE sequence.22 The differences in profile between the two sequences were thought to be due differences in relaxation behaviour of the coherences at the surfaces of the restricting geometry. An increase in the relaxivity parameter M in eqn (3) leads to a more pronounced diffusion–diffraction profile and thus the coherences or a particular coherence utilised in the singlet states, ZQx − 2IzSz and 2IzSz sequences, could have greater relaxivity at the surface than those used in the PGSTE and PGSE sequences.
To further investigate the differences in the diffusion–diffraction profile, it is important to compare the relaxation behaviour of singlet states to those of other coherences or magnetisations and also examine the methods used to generate them. In contrast to longitudinal magnetisation (used in PGSTE) and transverse magnetisation (used in PGSE), singlet states are not relaxed by intramolecular dipole–dipole interactions13,24 and this is the main reason that they are long lived. A recent study of the singlet state of N2O in blood and other solvents showed that its relaxation is dominated by spin-rotation and paramagnetic interactions34 while another recent study showed singlet states are indeed susceptible to paramagnetic relaxation but are two to three times less sensitive to this effect than conventional magnetisations.35 In this restricted diffusion study in capillary systems, surface relaxation is expected to be significant and can be assumed to be mainly caused by interactions with paramagnetic centres on the wall.36 It is however unclear why singlet states could be more susceptible to this type relaxation (as suggested by the higher relaxivity parameter M) than longitudinal or transverse magnetisations in these capillary systems.
Singlet, 2IzSz and ZQ may share some similar relaxation mechanisms at the surface of the capillaries as their diffusion–diffraction profiles are similar and the relaxation pathways could be distinctly different to those of longitudinal and transverse magnetisations. Indeed, it has previously been noted that, unlike longitudinal and transverse magnetisations, the longitudinal spin-pair order 2IzSz relaxation is of special interest for studies in real systems (e.g., the intracellular milieu of biological cells) where the intermolecular relaxation contributions cannot be controlled since it is not susceptible to random field relaxation (including intermolecular dipole–dipole relaxation).37,38
It is also possible that the differences in the diffusion diffraction profile of various coherences could be explained by the differences in the pulse sequence employed (see Fig. 1). Recently, differences in diffusion–diffraction profiles between regular PGSTE and the fast bipolar stimulated spin-echo (BPSTE) sequence have been observed and attributed to differences in the implementation of the two pulse sequences, particularly the introduction of the gradient recovery delay in the bipolar gradient pulses.39 As shown in Fig. 1, the singlet, 2IzSz and ZQ pulse sequences are similar to each other but are very different from the PGSTE and PGSE pulse sequences. The introduction of four extra delays, τ = 43 ms, for the interconversion of in-phase (Iz + Sz) to anti-phase magnetisation (2IxSz + 2IzSx) in the singlet, 2IzSz and ZQ sequences introduce a substantial period of time that could lead to more relaxation. In addition, the inclusion of more RF pulses could also lead to the selection of a smaller effective sample volume selection and thus greater homogeneity of the applied magnetic gradients40 and consequently better definition of the diffusion–diffraction profile. Clearly, further study is needed to investigate the observed difference in diffusion–diffraction profiles of the different coherences and spin order.
Lastly, as predicted by eqn (3), singlet and PGSTE diffusion–diffraction profiles were slightly more pronounced at Δ = 2 s than at Δ = 1 s (see Fig. 4), with the singlet state diffusion–diffraction profile being more pronounced than that of PGSTE. Due to the low S/N at Δ = 2 s, it was not possible to observe this trend for 2IzSz and ZQx − 2IzSz.
Diffusion–diffraction in glass capillaries with various internal dimensions
It is clear from the above data that PGSTE and singlet state diffusion sequences provide the highest S/N at longer Δ and are thus more suitable for studying restricted systems with larger dimensions. We compared the efficiency of these two sequences in microcapillaries with internal diameters of 140, 280 and 450 μm. To obtain distinct diffraction minima, Δ was set, depending on the diameter, to 10 s (140 μm), 20 s (280 μm) and 40 s (450 μm) while δ was set to 1 ms in all cases. The diffusion–diffraction profiles for the various glass capillaries using PGSTE and singlet state sequences are shown in Fig. 5. Comparison of the diffraction profile definition with capillary size shows that for both sequences the 140 μm i.d. capillaries gave the most distinct profiles. The singlet states sequence provided a more defined profile than PGSTE which is consistent with the results obtained with the 20 μm i.d., flexible capillaries. The 280 μm capillaries produced profiles that were comparable for both sequences. The 450 μm i.d. capillaries gave the least discernible diffusion–diffraction profiles. More detailed comparison of the diffusion profiles of the 280 and 450 μm i.d. capillaries also revealed similar more distinct diffusion–diffraction minima produced by singlet state sequence. More importantly, for the 450 μm i.d. capillaries, the singlet states sequence gives better S/N than PGSTE.Diffusion–diffraction simulation
To better analyse and explain the experimental diffusion–diffraction data, a theoretical diffusion–diffraction curve based on eqn (3) was simulated and fitted to the experimental data. In the first instance, M was set to zero in the simulated curve and contributions from diffusion outside the capillaries were not included. The experimental and simulated diffraction pattern for the 140, 280 and 450 μm i.d. cylinder for both singlet state and PGSTE experiments are presented in Fig. 6. Although the minima of the simulated and experimental diffusion profiles (which are related to the capillary dimension) were very close to each other, their profiles were significantly different. Clearly the simulated curves were more defined than the experimental curves. There are two possible reasons for this discrepancy. First, spin relaxation on the wall could be significant and this could explain the difference in the singlet and PGSTE diffusion profiles. Secondly, there is substantial geometrical inhomogeneity both with respect to the internal diameter and the extra-cylindrical space. The latter situation is very feasible as the capillaries were unlikely to be orientated perfectly parallel to each other.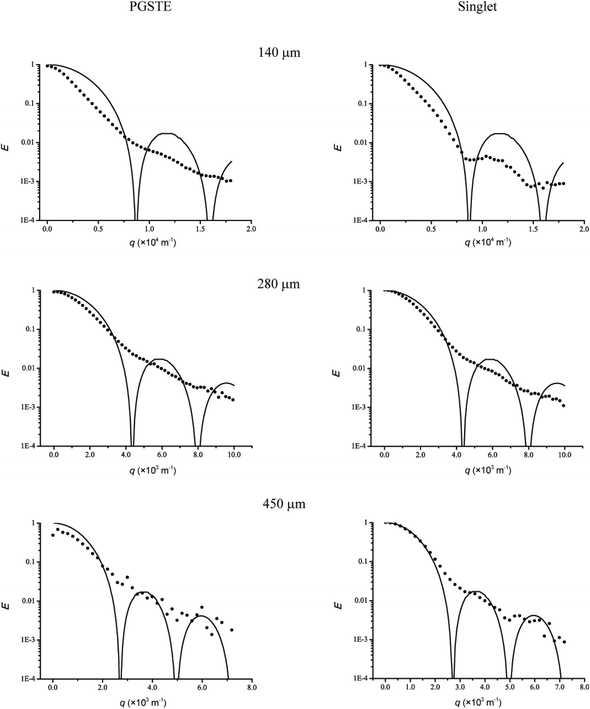 | ||
| Fig. 6 Echo attenuation profiles of cylindrical pores with inner diameters of 2a = 140, 280 and 450 μm for PGSTE and singlet state pulse sequences. In each profile the experimental data is represented by • and the solid lines represent the simulations. In all cases the relaxivity were set to zero (i.e. M = 0). | ||
A better fit to the experimental data was obtained when relaxivity and structural inhomogeneity were included in the simulations. Non-linear least squares fitting of eqn (3) whilst floating the value of the relaxivity parameter M successfully matched the minima of the simulated profiles with the experimental profiles but there were still significant differences. A Gaussian distribution of the inner radius μ was assumed with a corresponding variance σ2 as a curve fitting parameter to account for non-homogeneity of the cylinder diameter. A contribution from diffusion outside of the capillaries was also included as another fitting parameter. Simulated diffusion profiles are presented in Fig. 7 and the closer correspondence between simulation and experimental data through the inclusion of M and σ2 as compared to Fig. 6 can be clearly seen. The higher relaxivity for the singlet state profile was in accordance with our previous hypothesis22 and this could account for the better profile definition when compared to those obtained in conventional PGSTE.
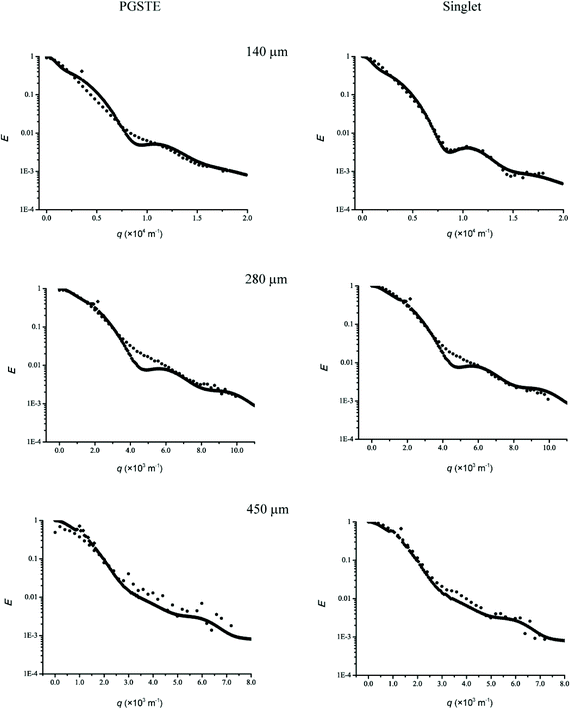 | ||
| Fig. 7 Echo attenuation of AX spin-coupled 2,3-dibromothiophene in 2a = 140, 280 and 450 μm i.d. cylindrical capillaries by using PGSTE and singlet spin state sequences. Characterising the non-homogeneity of the cylinder diameter by a Gaussian distribution afforded good correspondence between the simulated and experimental profiles. The parameter values obtained were μ = 70 μm and σ2 = 134.5 for 2a = 140 μm; μ = 140 μm and σ2 = 432 for 2a = 280 μm; and μ = 225 μm and σ2 = 2048 for 2a = 450 μm. Also the contribution of the free diffusion outside of the capillaries was found to be about 0.5, 0.3 and 0.2, respectively. The wall relaxivity (M) for the singlet state and PGSTE are 2.5 × 10⁻⁵ ms−1 and 9 × 10⁻⁶ ms−1, 1 × 10⁻⁶ ms−1 and 5 × 10⁻⁷ ms−1, 2 × 10⁻⁷ ms−1 and 8 × 10⁻⁸ ms−1 for 2a = 140, 280 and 450 μm cylinders, respectively. | ||
Conclusion
The diffusion diffractive behaviour of various coherences and spin-orders of the AX spin-coupled system 2,3-dibromothiophene in different diameter capillaries were presented. Singlet state-based sequences were found to exhibit more pronounced features than those provided by PGSE and PGSTE. This distinct diffusion profile which was also observed for longitudinal spin-pair order and zero-quantum coherence based sequences could provide valuable insights on diffusion in confined geometries with varying pore dimensions. Since singlet state signals persist longer and yield more discernible diffusion–diffraction features than signals observed in standard PGSTE and PGSE sequences, singlet state-based diffusion sequences are preferable for investigating restricted diffusion in larger pores. Even the model system studies here cannot be considered as ideal and the surface relaxivity and non-homogeneity of the characteristic distance must be considered in a thorough analysis. It was also shown that the singlet state may have substantial relaxivity on the walls of the capillaries.Acknowledgements
The authors would like to thank Dr Nirbhay N. Yadav for valuable discussion during the initial part of this project. This research was supported by a NSW BioFirst Award from the Ministry of Science & Medical Research (W.S.P.).References
- W. S. Price, NMR Studies of Translational Motion, Cambridge University Press, Cambridge, 2009 Search PubMed.
- P. Callaghan, Principles of Nuclear Magnetic Resonance Microscopy, Oxford University Press, 1994 Search PubMed.
- P. T. Callaghan, A. Coy, D. MacGowan, K. J. Packer and F. O. Zelaya, Nature, 1991, 351, 467–469 CrossRef CAS.
- P. W. Kuchel, A. Coy and P. Stilbs, Magn. Reson. Med., 1997, 37, 637–643 CrossRef CAS.
- A. M. Torres, R. Dela Cruz and W. S. Price, J. Magn. Reson., 2008, 193, 311–316 CrossRef CAS.
- A. M. Torres, G. Zheng and W. S. Price, Magn. Reson. Chem., 2010, 48, 129–133 CAS.
- G. Zheng and W. S. Price, J. Magn. Reson., 2008, 195, 40–44 CrossRef CAS.
- G. Zheng, A. M. Torres and W. S. Price, J. Magn. Reson., 2009, 198, 271–274 CrossRef CAS.
- T. Stait-Gardner, P. G. Anil Kumar and W. S. Price, Chem. Phys. Lett., 2008, 462, 331–336 CrossRef CAS.
- E. O. Stejskal and J. E. Tanner, J. Chem. Phys., 1965, 42, 288–292 CrossRef CAS.
- J. E. Tanner, J. Chem. Phys., 1970, 52, 2523–2526 CrossRef CAS.
- W. S. Price, Concepts Magn. Reson., 1997, 9, 299–336 CrossRef CAS.
- M. Carravetta and M. H. Levitt, J. Am. Chem. Soc., 2004, 126, 6228–6229 CrossRef CAS.
- M. Carravetta, O. G. Johannessen and M. H. Levitt, Phys. Rev. Lett., 2004, 92, 153003 CrossRef.
- R. Sarkar, P. R. Vasos and G. Bodenhausen, J. Am. Chem. Soc., 2007, 129, 328–334 CrossRef CAS.
- G. Pileio, M. Carravetta, E. Hughes and M. H. Levitt, J. Am. Chem. Soc., 2008, 130, 12582–12583 CrossRef CAS.
- M. C. D. Tayler and M. H. Levitt, Phys. Chem. Chem. Phys., 2011, 13, 5556–5560 RSC.
- S. Cavadini, J. Dittmer, S. Antonijevic and G. Bodenhausen, J. Am. Chem. Soc., 2005, 127, 15744–15748 CrossRef CAS.
- S. Cavadini and P. R. Vasos, Concepts Magn. Reson. A, 2008, 32, 68–78 Search PubMed.
- P. Ahuja, R. Sarkar, P. R. Vasos and G. Bodenhausen, J. Am. Chem. Soc., 2009, 131, 7498–7499 CrossRef CAS.
- R. Sarkar, P. Ahuja, P. R. Vasos and G. Bodenhausen, ChemPhysChem, 2008, 9, 2414–2419 CAS.
- N. N. Yadav, A. M. Torres and W. S. Price, J. Magn. Reson., 2010, 204, 346–348 CrossRef CAS.
- G. Pileio and M. H. Levitt, J. Chem. Phys., 2009, 130, 214501 CrossRef.
- G. Pileio, Prog. Nucl. Magn. Reson. Spectrosc., 2010, 56, 217–231 CrossRef CAS.
- R. W. Mair, G. P. Wong, D. Hoffmann, M. D. Hürlimann, S. Patz, L. M. Schwartz and R. L. Walsworth, Phys. Rev. Lett., 1999, 83, 3324–3327 CrossRef CAS.
- A. D. Bain, J. Magn. Reson., 1984, 56, 418–427 CAS.
- G. Bodenhausen, H. Kogler and R. R. Ernst, J. Magn. Reson., 1984, 58, 370–388 CAS.
- R. Sarkar, D. Moskau, F. Ferrage, P. R. Vasos and G. Bodenhausen, J. Magn. Reson., 2008, 193, 110–118 CrossRef CAS.
- P. T. Callaghan, J. Magn. Reson., Ser. A, 1995, 113, 53–59 CrossRef CAS.
- M. J. Thrippleton and J. Keeler, Angew. Chem., Int. Ed., 2003, 42, 3938–3941 CrossRef CAS.
- L. Avram, Y. Assaf and Y. Cohen, J. Magn. Reson., 2004, 169, 30–38 CrossRef CAS.
- A. M. Torres, R. J. Michniewicz, B. E. Chapman, G. A. R. Young and P. W. Kuchel, Magn. Reson. Imaging, 1998, 16, 423–434 CrossRef CAS.
- A. M. Torres, A. T. Taurins, D. G. Regan, B. E. Chapman and P. W. Kuchel, J. Magn. Reson., 1999, 138, 135–143 CrossRef CAS.
- R. K. Ghosh, S. J. Kadlecek, J. H. Ardenkjaer-Larsen, B. M. Pullinger, G. Pileio, M. H. Levitt, N. N. Kuzma and R. R. Rizi, Magn. Reson. Med., 2011, 66, 1177–1180 CrossRef CAS.
- M. C. D. Tayler and M. H. Levitt, Phys. Chem. Chem. Phys., 2011, 13, 9128–9130 RSC.
- P. P. Mitra and P. N. Sen, Phys. Rev. B: Condens. Matter, 1992, 45, 143 CrossRef.
- W. S. Price, B. C. Perng, C. L. Tsai and L. P. Hwang, Biophys. J., 1992, 61, 621–630 CrossRef CAS.
- C. L. Tsai, W. S. Price, Y. C. Chang, B. C. Perng and L. P. Hwang, J. Phys. Chem., 1991, 95, 7546–7551 CrossRef CAS.
- T. J. Larkin, G. Pages, A. M. Torres and P. W. Kuchel, in Diffusion Fundamentals III, ed. C. Chmelik, N. Kanellopoulos, J. Kärger and D. Theodorou, Leipzig University Press, Leipzig, 2009, pp. 409–420 Search PubMed.
- R. T. McKay, Concepts Magn. Reson. A, 2011, 38, 197–220 Search PubMed.
| This journal is © The Royal Society of Chemistry 2012 |