Electrophoretic deposition under modulated electric fields: a review
Malika
Ammam
*
Faculty of Science, University of Ontario Institute of Technology, 2000 Simcoe Street North, Oshawa, ON L1H 7K4, CANADA. E-mail: m78ammam@yahoo.fr; Malika.Ammam@uoit.ca; Fax: 905-721-3304; Tel: (905)721-8668, ext 3625
First published on 21st May 2012
Abstract
Classical electrophoretic deposition (EPD) relies on continuous direct current (CDC) to deposit charged particles on electrodes. In recent decades, modulated electric fields such as pulsed direct current (PDC) and alternating current (AC) have been investigated. This paper reviews EPD under these modulated electric fields and major applications of the deposited microstructures. The paper starts with a short overview of EPD principals such as the electrical double layer of the charged particle, electrophoretic mobility and main suspension parameters including zeta potential, particle size, conductivity, viscosity and stability of the suspension. The EPD mechanisms from the earliest model reported by Hamaker and Verwey to latest models including Sarkar and Nicholson model and influence of the electrohydrodynamics and electroosmosis as well as electrode surface and its electrochemical double layer on the deposition process have been briefly discussed. Two categories of modulated electric fields, PDC and AC fields have been addressed with their advantages and disadvantages. It is found that compared to CDC, PDC offers the advantage of: i) reducing the coalescence between gas bubbles induced by water electrolysis from aqueous suspensions, hence yielding deposition of smooth and uniform coatings, ii) reducing aggregation and disaggregation of nanometer sized particles, leading to formation of uniform and homogenous deposits and, iii) PDC generates low change in pH near the electrode, thus it is convenient for deposition of biochemical and biological species in their highly active states. The main disadvantage of PDC over CDC lies in the decrease of the deposition yield. The latter can be more pronounced if low time-pulses are used. Various categories of AC signals including symmetrical fields with no net DC component and asymmetrical AC signals without and with net DC component have been discussed. Overall, the deposition rate under AC fields increases with polarization time and amplitude. With respect to frequency, the deposition rate increases with frequency up to certain value then drops at elevated frequencies. It is noted that deposition under AC signals offers the possibility to produce superior quality coatings from aqueous suspensions because electrolysis of water as well as particle orientation during the deposition could be controlled. From the application standpoint, PDC and AC, offers new application perspectives such as in biotechnology. Because under modulated electric fields, EPD can now be accomplished from aqueous suspensions with low water electrolysis rates, a variety of biochemical and biological species can be deposited to yield highly active layers suitable for a wide range of applications including biosensors, biofuel cells and bioreactors.
 Malika Ammam | Malika Ammam received her MS degree from the University of Pierre et Marie CURIE in July 2002 and her PhD from the University of Paris Sud XI, France in September 2005. From 2006 to 2007, she worked as a research fellow at the University of Kansas in collaboration with Pinnacle Technology Inc. (US). From 2007 to 2010, she worked as a research associate at KU Leuven, Belgium and she is currently working at the University of Ontario Institute of Technology in collaboration with Alcohol Countermeasure Systems Corporation, Canada. Electrophoretic deposition, electrochemistry, materials, sensing and energy are among her research projects and interests. |
1. Introduction
Electrophoretic deposition (EPD) is an important technology for colloidal coating processes. Fig. 1 illustrates a schematic representation of an EPD cell. Under the influence of direct current (DC) electric field, the charged colloids or particles suspended or dispersed in a fluid move towards the electrode and deposit.1–4 Depending on surface charge of the suspended particles, two kind of EPD can be defined. If the particles are positively charged (Fig. 1), they will move towards the electrode with the opposite sign, the cathode, and this process is called cathodic EPD. By contrast, if the dispersed particles are negatively charged, they will be attracted by the positively charged electrode, the anode, and this process is named anodic EPD.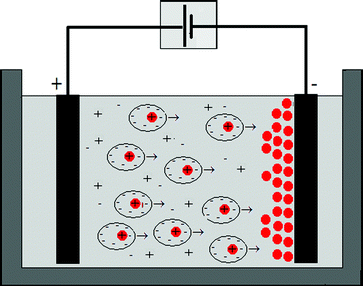 | ||
| Fig. 1 Schematic diagram of electrophoretic deposition of charged particles on the anode of an EPD cell with planar electrodes. | ||
In EPD, upon application of a potential, a current will flow between the parallel plate electrodes (Fig. 1). The magnitude of the current that flows is influenced by a variety of system parameters, including the cell constant, the solution conductivity, and interfacial electrochemical kinetics. The electric field strength in the suspension (E) is related to the current density (J) and the conductivity of the suspension (k), which is nothing more than the microscopic formulation of the Ohm's law (J = kE).
Basic EPD is accomplished from organic suspensions that have several advantages including low conductivity and good chemical stability of the suspension and absence of the electrochemical reactions and Joule heating at the electrodes. This leads to formation of high quality coatings. Nevertheless, the use of organic solvents is associated with many problems including the cost, volatile, toxicity most of the time and flammability. Furthermore, because organic solvents have low dielectric constant (dissociation power), this induces a limited particle charge. Thus, high electric fields strengths are required to move the suspended particles towards the electrode.
EPD from aqueous suspensions is a good alternative for solving many problems associated with the organic solvents such as the cost and the environmental load. Furthermore, because the dissociation power of water is high (dielectric constant ∼ 80.1), this results in a buildup of a charge of the particle. Consequently, low electric fields strengths can be used. The main disadvantage of EPD from aqueous suspensions is water electrolysis. Above the thermodynamic voltages of water oxidation and reduction,5 electrochemical reactions occur at the electrodes and generate gases, O2 at the anode and H2 at the cathode (details on the reactions can be found in section 3.1.1.). The formed gas bubbles can be incorporated in the deposit and yields damaged and poor quality coatings. To overcome this problem, several approaches have been made.
The first attempted approach was to carry out the EPD process at voltages below the thermodynamic values of water electrolysis. This provided successful production of alumina microstructures.6 However, the low applied voltages yielded only low deposition rates that are limited to small wall thicknesses. Other concepts based on sacrificial electrodes and competitive reactions have been explored. For example, Chronberg and Händle7 employed zinc (Zn) rollers as deposition electrodes to compete the oxidation reaction of water with that of Zn, a more facile reaction. Nonetheless, low deposition rates as well as contamination of the coatings with Zn limited the process. Materials that store gases such as palladium (Pd) have also been investigated as cathodes for H2 storage.8 Unfortunately, only small amount of H2 can be stored within the material. Finally, chemical additives such as hydroquinone were found to be useful for suppressing O2 evolved at the anode.9,10 But, the concept is only helpful under particular conditions such as alkaline pH.
One promising method to deal with electrolysis of water during the EPD process from aqueous suspensions is by using membranes.11–15 A porous and ion-permeable membrane is placed between the anode and the cathode, hence dividing the EPD cell into two chambers. The deposition occurs on the membrane itself, but the ions can pass through the membrane pores to recombine at the electrodes and form gases. The sufficient distance which separates the membrane from the electrodes allows formation of free-bubble deposits. The membrane based process was successfully used to deposit different materials such as alumina, silica glass and zirconia.
Another efficient means to decrease the amount of the evolved gas bubbles at the electrodes and allow formation of homogenous deposits from aqueous suspensions is to carry out the EPD process under modulated electric fields such as pulsed direct current (PDC) and alternating current (AC). Some examples of these signals are shown in Fig. 2. The basic difference between continuous direct current (CDC) shown in Fig. 2A and PDC of Fig. 2B is that the voltage of a CDC is roughly constant, whereas the voltage of a PDC wave continually varies, but like a DC wave, the sign of the voltage is constant. In AC, the voltage continually varies between positive and negative values. It is worth noting that the rectangular waveform of Fig. 2 constitutes only one example of a theoretical infinite number of waveforms. In AC, if voltage-time of the positive and negative half cycles is equal, the waveform is symmetrical with theoretically no net DC component (Fig. 2C). However, if voltage-time of the two half cycles is different, the AC wave is asymmetrical and, depending on whether the surface areas of both half-cycles are equal or not, the wave can be asymmetrical with net DC component (Fig. 2D) or, asymmetrical with no net DC component (Fig. 2E).
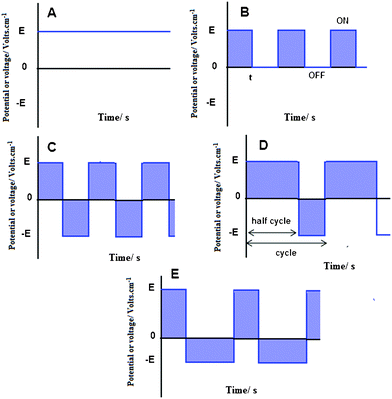 | ||
| Fig. 2 Schematic representation of some electrical signals: (A) continuous direct current (CDC), (B) pulsed direct current (PDC), (C) symmetrical alternating current (AC) with no net DC component, (D) asymmetrical AC signal with net DC component and, (E) asymmetrical AC wave with no net DC component. | ||
In recent decades, these modulated electric fields have been investigated not only for EPD of ceramic and polymer particles but also for biochemical and biological species that are more sensitive to pH shifts or electrochemical reactions products formed at the electrodes. Because modulated electric fields generate a low rate of water electrolysis, biochemical and biological species can be deposited in their highly active states. For instance, EPD of bacterial cells and enzymes from aqueous solutions under CDC has been reported to some extent.16 However, it is not clear from the text whether the activity of the species after CDC that generates a high amount of electrolysis was examined or not.
This paper reviews some selected literature dealing with EPD under modulated electric fields, PDC and AC, and the main applications of the deposited microstructures. However, first some necessary reminders and updates about EPD principles should be addressed.
2. EPD principals
2.1. Electrical double layer and electrophoretic mobility
Charged particles in a fluid are surrounded by a cloud of ions. Ions of opposite charge (counterions) are attracted towards the surface of the charged particle, while ions of similar charge are pushed away from that surface. This yields a net electrical charge on one side of the interface and a charge of opposite sign on the other side of the interface, giving rise to what is called the electrical double layer of the particle. The widely accepted model for the particle double layer is the Stern model.17 A schematic representation of the particle electrical double layer with distribution of charged species and potential drop across the double layer in accordance with Stern model is shown in Fig. 3. If we assume a negatively charged particle, the ions of opposite charge closest to surface of the particle form what is known as a Stern layer and the rest of the ions which are distributed more broadly, form what is called the diffuse double layer (Fig. 3). The particle surface at the plane of shear between Stern and the diffuse layer is characterized by a potential called zeta potential, ζ, which is involved in nearly all electrokinetics.18,19 Application of an external electric field can shear away some of the ions outside the Stern layer and yields a drift and migration of the particle towards the electrode of opposite charge (Fig. 1).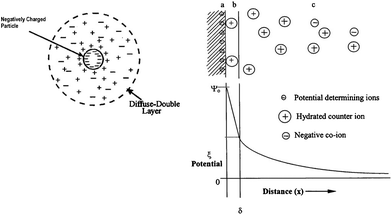 | ||
| Fig. 3 Schematic representation of the electric double layer of the charged particle and potential drop across the double layer. (a) Surface charge, (b) stern layer, (c) diffuse layers of counter-ions. Image reproduced from ref. 1 with permission of Elsevier. | ||
The main electrophoretic characteristic of the particle under the influence of the electric field is called electrophoretic mobility, μeph, which can be defined as the coefficient of proportionality between the electric field strength, E, and the particle velocity, Veph:19–21
| Veph = μephE | (1) |
In turn, the electrophoretic mobility increases with the particle zeta potential, ζ, and decreases with the viscosity of the media, η The coefficient of correlation between μ and ζ depends on the size of the particles. The electrophoretic mobility of small particles defined as having a radius r much smaller than the Debye length of the counterionic atmosphere (r ≪ 1/k) is described by the Huckel equation:
| μeph = 2εε0ζ/3η | (2) |
The electrophoretic mobility of particles of size much greater than the Debye length of the counterionic layer (r ≫ 1/k) is given by the Helmholtz–Smoluchowski equation:
| μeph = εε0ζ/η | (3) |
The displacement of a particle for a finite time Δt under uniform DC electrophoresis can reasonably be defined as21:
| xDC = μephEDCΔt + x0 | (4) |
2.2. Key suspension parameters
EPD is a two-step mechanism. First, the particles must migrate to the deposition electrode under the action of an electric field and, second, the particles must coagulate and deposit on the electrode (Fig. 1). There are a number of suspension parameters that influence the EPD process as well as the quality of the deposited coating. Some of the important ones are discussed below.The particle charge or zeta potential can be controlled by various charging agents such as acids, bases, or specifically adsorbed polyelectrolytes.22 However, before using charging agents to increase the charge of the suspended particles, the first common step in suspension preparation is powder washing. This step allows the removal of any residual impurities that are incorporated with the powder and may affect the stability of the suspension, thus the deposition characteristics. Basu et al.23 reported that unwashed powder led to an unstable suspension, which in turn led to lower deposition yields and a decrease in green density of the deposit by about 15–25%. The problem was solved by repetitive washing of the powder with deionized water. Also, during the washing process, significant reduction in the conductivity of the supernatant was observed.23 Hence, it can be concluded that the washing process is an important factor in suspension stability.
While the washing process can easily be accomplished with inorganic materials such as ceramic particles,23 for biomolecules and biological cells, this step might be difficult. Because enzymes and biological cells usually contain salts for electroneutrality, their dispersion, even in ultrapure water gives rise to high conductivity suspensions, which in turn may affect their zeta potential as well as the suspension stability.24–26
The charge on a biomolecule such as enzymes, proteins or biological cells arises from the ionization of the functional groups present within the biomolecule. In proteins or enzymes, these groups carried out by essentially the amino acids residues give rise to either positive or negative charges. In acidic pH, the net charge of the enzymes is usually positive, whereas in alkaline pH, the charge is negative. At a certain pH, enzymes will have no net charge, called isoionic point, which is around pH 4 for glucose oxidase for example. At neutral pH, enzymes such as glucose oxidase are negatively charged and the zeta potential of enzymes depends largely on the dissolving media. Matsumoto et al.27 measured the zeta potential of glucose oxidase dissolved in high ionic strength phosphate buffer solution as −0.4 mV. This led to practically no electrophoretic mobility of the enzyme. This problem can be solved if the enzyme is dissolved in ultrapure water. Ammam and Fransaer24 measured the zeta potential of glucose oxidase dissolved in ultrapure water containing low amount of NaOH as charging agent as −10.7 mV. The latter led to a net electrophoretic mobility of the enzyme when asymmetrical AC fields are applied to form thick deposits on the electrode.
For biological cells, the washing procedure is easier than for enzymes and proteins because cells can be dispensed in water and filtered off to remove the excess salts. Consequently, adequate zeta potentials of cells suspended in water have been recorded.16,28,29 A typical example on how zeta potential varies with pH of the suspension is shown in Fig. 4 for E. Coli microorganism and inclusion bodies.16 The isoionic point of these species is located at ∼pH 3–4. At higher pH, the species are negatively charged, whereas at lower pH, the species are positively charged. The charge or zeta potential of the species increases when pH is moved away from the isoionic point.
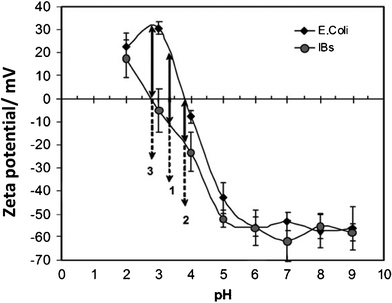 | ||
| Fig. 4 Dependence of zeta potential on pH for a suspension of pure E. Coli bacteria and a suspension of pure inclusion bodies. Image reproduced from ref. 16 with permission of Elsevier. | ||
In turn, the conductivity is related to dielectric constant or dissociation power of the solvent. It is reported that optimal deposition rates are obtained with liquids having dielectric constant in the range of 12–25,31 specifically associated with organic solvents. With liquids having high dissociation power such as water (dielectric constant ∼80.1 at 20 °C), the amount of ions in the suspension must be very low in order to yield stable suspension, hence high deposition rate. Also, viscosity accounts in EPD process. The amount of the dispersed particles and the pH affect the viscosity of the suspension.25,32 Low viscosities are required for successful EPD and optimal dispersant concentration can experimentally be determined.32
2.3. EPD mechanisms
After migration of the charged particles from the bulk to the electrode of opposite charge, the next step in EPD process is the coagulation and deposition. Although EPD is known since the 19th century, the deposition mechanisms are not fully understood and still under debate. Several theories have been proposed.The earliest dates back to 1940s. Hamaker and Verwey33 suggested that deposition is due to accumulation of the charged particles on the electrode under the action of the applied electric field. Nevertheless, the proposed mechanism is more useful for deposition of particles on a membrane placed between two electrodes, rather than for deposition on the electrode.
In 1992, Grillon et al.34 suggested that EPD occurs by particle charge neutralization. The charged particle approaching the electrode neutralizes upon contact with the opposite charge of the electrode and precipitate. The drawback of this theory is that the deposition is limited to a monolayer and this cannot explain the formation of thick coatings.
Few years later, Koelmans35 and later De and Nicholson36 proposed that deposition is governed by electrochemical particle coagulation. Due to electrochemical reactions at the electrodes during the EPD process, the ionic strength near the electrode surface would increase compared to bulk. This induces a reduction of the repulsive forces between particles near the electrode, which in turn lowers zeta potential and induces precipitation. This theory is useful to explain deposition of particles from suspensions containing water but not EPD from organic suspensions since no electrochemical reactions occur.
To overcome the problem dealing with coagulation in absence of the electrochemical reactions, Sarkar and Nicholson17 suggested that deposition occurs through the double layer distortion and thinning, followed by coagulation of the particles on the electrode. As illustrated in Fig. 5, three main successive steps take place:
i) When the charged particle that is surrounded by the diffuse double layer is subjected to an electric field, it undergoes a distortion and becomes thinner ahead and wider behind.
ii) During the migration of the charged particle, ions of similar charge will move in same direction of the particle and can react with the counter ions accompanying the charged particle. The latter induces a thinning of the double layer of the particle.
iii) Because the double layer of the particle is now thinner, it can easily approach another particle with also a thinner double layer and, if the contact is close enough to favor van der Waals attractive forces, the deposition occurs.
So far, no experimental data have yet been presented to support this theory. However, thanks to imagery techniques, experimental data are now available on how the particles aggregate on the electrode. The aggregation is modeled by various mechanisms such as electrohydrodynamics37 and electroosmosis.38,39 The action of an electric field on charge of the particle diffuse layer gives rise to the electroosmotic flow, while action of an electric field on charge induced by the electric field on the electrode gives rise to the electrohydrodynamic flow. For electroosmosis, thickness of the electrical double layer of the particle, particularly, the diffuse layer is a key determinant of the electroosmotic forces. A thick diffuse layer yields significant electroosmotic forces, while a thin diffuse layer gives rise to negligible electroosmotic forces.39
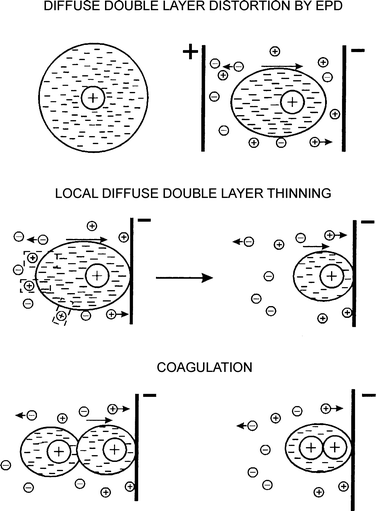 | ||
| Fig. 5 Electrical double layer distortion and thinning mechanism for electrophoretic deposition. Image reproduced from ref. 17 with permission of Wiley & Sons. | ||
Also, the electrode surface and its electrochemical double layer play an important role in the deposition process.5,40 Polarizable electrodes create a substantial potential drop in the electrochemical double layer of the electrode, thus most of the current is capacitive. Consequently, the electric field strength reduces in the bulk of the suspension and induces instability. By contrast, non-polarisable electrodes generate minimum drop current and most of the current is Faradaic. This induces an effective electric strength in the bulk of the suspension. Prieve et al.40 have recently reviewed 2D assembly of particles under DC and AC electric fields and emphasized the role of the electrochemical double layer of the electrode in the deposition process.
3. EPD under modulated electric fields
3.1. PDC fields
The advantages of PDC shown in Fig. 2B over CDC of Fig. 2A for EPD of charged particles can be summarized as:i) PDC significantly reduces the coalescence between gas bubbles induced by water electrolysis. Thus, yields deposition of smooth and uniform coatings.
ii) PDC reduces aggregation between nanometer sized particles, leading to formation of uniform and homogenous deposits.
iii) PDC generates low change in pH near the electrode. Hence, is convenient for deposition of biochemical and biological species in their highly active states.
 | ||
| Fig. 6 Surface morphology of deposits obtained by PDC EPD at constant voltage mode of 20 V (A) and at constant current mode of 0.004 A (B). Image reproduced from ref. 46 with permission of Elsevier. | ||
Anode: 2H2O = O2 + 4H+ + 4e− (Eo = −1.23 V vs. NHE) (I)
4OH− = O2 + 2H2O + 4e− (Eo = −0.40 V vs. NHE) (II)
Cathode: 2H+ + 2e− = H2 (Eo = 0 V vs. NHE) (III)
2H2O + 2e− = H2 + 2OH− (Eo = −0.83 V vs. NHE) (IV)
The dominant reaction would of course depend on whether the aqueous suspension contains sufficient amounts of H+, OH− or only water. For example, if the solution contains a sufficient amount of OH−, OH− would be the first species to be oxidized into O2 at the anode because the reaction requires less voltage (−0.4 V) than that of water oxidation (−1.23 V). Similarly, if H+ were added to the aqueous suspension, H+ would be the first species to be reduced into H2 at the cathode because the reaction requires 0 V compared to reduction of water molecules (−0.83 V). However, if pure water is used as a fluid suspension, after the reduction and oxidation of the small amount of H+ and OH− present at the concentration of 10−7 M, water molecule will be the main species to be oxidized at the anode and reduced at the cathode with voltages of −1.23 V and −0.83 V, respectively.
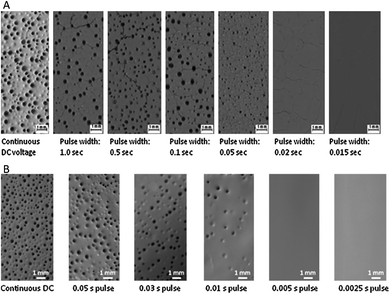
During EPD process, the generated gas bubbles can be incorporated in the deposit, and results in porous morphologies (CDC of Fig. 6). By comparison, under PDC, the number and size of the pores can be reduced if time-pulses are decreased. Theoretically, once the thermodynamic voltages of water electrolysis are reached, water starts to decompose into O2 and H2. Nevertheless, depending on the reaction conditions such as nature of the electrode material, nature of the electrolyte and its concentration etc., the potentials may shift from the thermodynamic values. The latter defines the kinetics of water electrolysis reactions.
Besra et al.46 measured larger shifts in pH near the electrode using CDC compared to PDC. This may suggest that PDC induces low rates of electrolysis compared to CDC. However, taking into account the total polarization time (ON + OFF) used for PDC that is higher than that used for CDC since CDC has no OFF-time, it is possible to propose that using PDC, the reaction products formed during the ON-time diffuse towards the bulk solution during the OFF-time, inducing less change in pH near the electrode. Thus, it maybe concluded that unless extremely low time-pulses are used,50 PDC probably do not generate low rates of electrolysis, but more appropriately it minimizes coalescence between gas bubbles, thus preventing formation of larger ones.
Fig. 7 supports this claim. It shows a comparison between SEM images of polypyrrole (PPy) coatings on glassy carbon (GC) substrates produced by electropolymerization of pyrrole monomer from low conductivity solutions using CDC (Fig. 7A, 7B and 7C) and PDC (Fig. 7D).51 The same deposition time is used for all coatings. In addition, 10 s is used as time-pulse for PDC that is large enough to induce formation of gas bubbles since micro-meter sized bubbles were observed even with pulses of 0.1 ms.50Fig. 7A, 7B and 7C clearly depict rough and inhomogeneous topographies of PPy deposits under CDC. This is due to the large amount of gas bubbles incorporated in the coatings. More importantly, Fig. 7C clearly shows that under CDC, the gas bubbles coalesce and when maximum volumes are reached, the bubbles explode and form patterns that can be described as “open flowers”. By comparison, the topography of PPy coating obtained by means of PDC is smoother and homogenous (Fig. 7D). Interruption of the field during OFF-time for PDC breaks apart most of the tiny formed bubbles. Hence, prevent their coalescence during the next ON-time polarization.
 | ||
| Fig. 7 SEM images of electrodeposited polypyrrole (PPy) from pyrrole aqueous solutions using CDC (A, B, C) and PDC (D) at 4 V vs. Ag/AgCl for equal ON-time deposition mode. Part of the image reproduced from ref. 51 with permission of Elsevier. | ||
i) Reduction in the electroosmotic flow that is induced near the electrode (Fig. 8C). In other words, when an electric field is applied between the anode and the cathode, the charged particles move towards the electrode of opposite charge. As the particles approach the electrode, the electroosmotic forces induced by the electric field interfere within the Debye length range and bend the electrophoretic forces. This causes their aggregation in CDC. Under PDC, the electroosmotic flow stops during the OFF-time and when the next ON-time starts, the particles near the electrode move under electrophoresis, without significant interference from electroosmosis and thus deposit independently.47
ii) Reduction in coalescence between the formed gas bubbles. In other words, under CDC, electrolysis of water induces large-sized bubbles that may generate a pressure on the surrounding particles and push them away. As a result, the particles will be gathered in between the formed gas bubbles and aggregate as in Fig. 8B. By comparison, because PDC prevent gas bubbles from coalescence and reduce their size, the pressure applied by the formed bubbles should also be reduced. This yields deposition of independent particles at 2D (Fig. 8A) and 3D.43
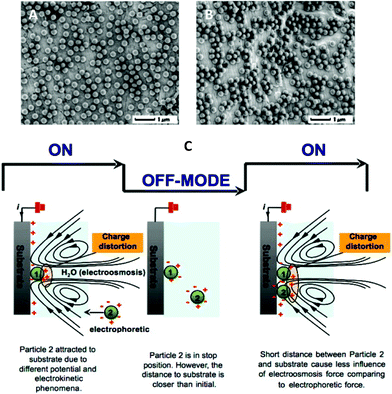 | ||
| Fig. 8 Single-size deposit particles by PDC (A) and CDC polarisation (B). All particles are deposited at 3.3 V cm−1 for 2 min. (C) Illustration of on-going deposit particles during EPD. The effect of electrokinetic phenomena is to induce the on-going particles as they approach the substrate. The off-mode condition reduces the effect of electroosmosis on an incoming deposit particle (particle 2). Image reproduced from ref. 47 with permission of Elsevier. | ||
3.2. AC fields
While in DC fields the electric charge flows only in one direction, in AC fields the movement of the electric charge periodically reverses direction between the positive and negative (Fig. 2). As a consequence, under an AC field the dynamic of particles are much more complicated than in DC. Thus, analysis of the experimental observations is often difficult because there are a number of phenomena and forces that arise from the interaction of the AC field with the suspended particle, and this is influenced by a range of parameters including frequency, particle size, electrolyte conductivity, electric field distribution, and whether the current passes through the capacitance of the electrode double layer or, through the electrochemical reaction.40,52–60 Some of the forces are well-studied and documented in literature such as electrophoresis,61–63 dielectrophoresis,64–67 electrorotation68,69 and travelling-wave dielectrophoresis.70 The basic difference between these forces is schematically depicted in Fig. 9.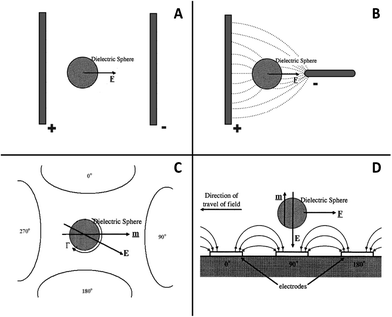 | ||
| Fig. 9 Schematic representation of a charged particle under the influence of electrophoresis (A), dielectrophoresis (B), electrorotation (C) and travelling wave dielectrophoresis (D). | ||
Therefore, as one can imagine, under AC fields, various phenomena could occur simultaneously and the deposition mechanisms are often unclear. For example, at low frequencies, the interaction between the charged particle and the field gives rise to electrophoresis. AC field also produces a frequency dependent dipole on a polarisable suspended particle and depending on the field distribution; interaction between the dipole and the electric field can generate dielectrophoresis, electrorotation and travelling wave dielectrophoresis (Fig. 9). Furthermore, if the AC field is strong enough, it induces a fluid flow and heating at the electrodes. The AC field can interact with the fluid to produce electrohydrodynamic and electroosmotic forces as well as electrothermal due to Joule heating. The resulting fluid flow may induce a drag force on the particle and thus a motion. Depending on the frequency and the ionic conductivity (electrolyte), the electrohydrodynamic flow may induce aggregation or separation between the suspended particles near the electrode. At high frequencies, electrothermal fluid flow competes with the dielectrophoretic forces and electrohydrodynamics account. At low frequencies, AC electroosmotic flow dominates and this is strong even at low potentials. At intermediate frequencies, both electrohydrodymics and electrosmosis are active. On top of all the applied forces, particle–particle interaction and Brownian motion occur continuously.
Because of the complicated dynamics of particles under AC fields, the formulas describing the displacement of the charged particles in the AC field are also complicated if compared to the simple DC formula shown in equation (4). The displacement of charged particles in AC fields will depend essentially on nature of the AC waveforms (sine, triangular, rectangular etc.) as well as the symmetry or asymmetry of the signal, which will define the mathematical formulas.20,21 For example, in case of an harmonically oscillating electric field, the amplitude of the peak-to-peak displacement, xAC, of the charged particle is reported as:21
| xAC = −[μeph/EAC/sin(ωt)]/ω + x1 | (5) |
3.2.1. Symmetrical AC fields with no net DC component. Symmetrical AC-electric fields have been used since the 19th century for EPD of charged particles. This can be found in a large number of patents typically for industrial applications such as electro-coating of paint based polymers and copolymers.71 A typical example of symmetrical AC waveform that generates no net DC component is shown in Fig. 2C. What theoretically can be predicted using symmetrical and uniform AC waveforms is that at low frequencies and during the first half-cycle of the period, the charged particle moves a certain distance, d. During the other half-cycle, the particle changes its direction back to its original position, −d. Consequently, the particle oscillates around a fixed spot in the fluid between the two electrodes and its net migration becomes zero.20,72 Therefore, it can be concluded that symmetrical and uniform AC signals would not be appropriate for an efficient EPD. Nevertheless, a large number of scientists have succeeded to deposit thin and even thick coatings using symmetrical waves. In view of this, in 1979, Ul'berg et al.73 deposited weakly charged submicron oligomeric epoxy resin particles. Later, Hirata et al.74 reported EPD of alumina particles under symmetrical sine waves from aqueous suspensions at voltage of 6 V and frequencies of 0.12, 1, and 10 kHz. In the past decade, Poortinga et al.75 investigated symmetrical AC signals for EPD of spherical and rod-shaped bacterial cells and noticed that the bacterial cells adhere and deposit on the electrode if sufficiently high currents are used.
Although the deposition mechanisms under these signals are not fully understood, the formed monolayers have been attributed by Ul'berg et al.73 and Hirata et al.74 to diffusion (inertia free) since the particles were observed to coagulate on the electrode instantly. On the other hand, other phenomena such as electrohydrodynamic and electroosmotic forces may account in the deposition process. In this context, Sides54 reported that when the frequency changes, the interaction strength between the particles near the electrode can reach its maximum and it can even reverse attractive to repulsive forces and vice versa leading to aggregation of the particles on the electrode.54
So far, when uniform and symmetrical AC signals are used, low deposition rates that are limited to monolayers were usually depicted.28,74,75 There are some reported contradictory observations, where, using symmetrical or uniform AC signals, thick deposits were obtained. For example, Gardeshzadeh et al.76 deposited thick films of multiple walled carbon nanotubes using square and sine waves at frequencies of 1–1000 Hz as well as thick films of SnO2.77 Heidari et al.78,79 followed the procedure by Gardeshzadeh and obtained thick films. Also, Riahifar et al.72,80 employed similar category of electrodes as Heidari and deposited thick TiO2 films.
According to theoretical predictions, these symmetrical signals should not form thick deposits. The latter might be related to the setup used to carry out the deposition. Non-planar and non-parallel electrodes have been employed. An example of the electrodes configuration is illustrated in Fig. 10. This configuration suggest generation of non-uniform electric fields which will give rise to not only electrophoresis, but to eventually other forces such as dielectrophoresis and travelling wave dielectrophoresis of the particles from one electrode to another.
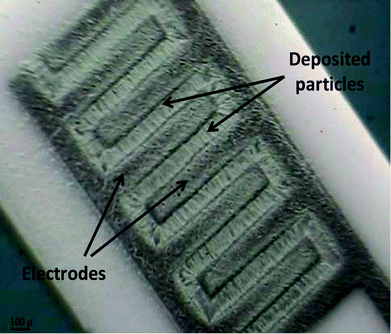 | ||
| Fig. 10 Optical microscopy image of the electrode configuration used by Heidari et al.79to deposit WO3 particles. Because space between the electrodes is only hundreds of μm, the particles have connected the electrodes together. Image reproduced from ref. 79 with permission of Springer. | ||
The main characteristics of EPD under symmetrical AC waveforms is that the deposition rate increases by reducing the frequency72,73,75 and increasing the voltage.72,73 Also, the deposition yield augments with the polarization time then reaches a saturation plateau.73,77
3.2.2. Asymmetrical AC field with net DC component. A typical example of asymmetrical AC wave with net DC component is shown is Fig. 3D. Because the surface area voltage–time (E–t) of the positive and negative half-cycles are not equal, a DC component is induced. This leads to a net drift of the charged particle towards the electrode of opposite charge. Furthermore, under this category of signals, inertia forces could also be an important driving force for migration of the particles because, during the fast voltage change from the positive to the negative signal and vice versa, the particles are accelerated and they cannot slow down open the reverse signal. The latter has been experimentally observed by Nold and Clasen,81 who recorded at the output a supplementary peak every third peak that has initially not been programmed.
The advantage of the asymmetrical AC signal with net DC over pure DC consists of producing superior quality coatings because electrolysis as well as particle orientation during deposition could be controlled to some extent. In view of this, Shindo et al.82 employed AC signals with controlled reverse current to < 10% to form coatings with superior corrosion resistance. Nold and Clasen81 used asymmetric AC square wave with negative net DC component to deposit alumina particles coatings from aqueous suspensions. The obtained coatings were smooth and bubble-free. Yue et al.83 coupled a weak DC to a strong AC field to deposit Ag-sheathed Bi2Sr2CaCu2Oδ tapes with improved microstructures.
The main characteristics of EPD under asymmetrical AC signals with net DC component are:
i) In order to prevent formation of bubbles, if the applied current density increased, the frequency should also be increased.81
ii) Compared to pure DC, the obtained deposition rates are low, but the quality is better since the coatings have no incorporated gas bubbles.
iii) If the employed AC field is stronger than the DC component, the produced microstructures should have high probability of orientation,83 thus a better quality.
3.2.3. Asymmetrical AC field with no net DC component. Fig. 2E depicts an example of the asymmetrical AC waveform with no net DC component. It will be noted that surface areas of the positive and negative half-cycles are equal. Thus, theoretically, no net DC component is induced (∫Edt = 0 over one period) to cause migration of the charged particle. Nevertheless, the difference in potential height and time duration (E–t) between the two half-cycles could cause the particle to migrate greater distance just like in DC fields, if the applied voltage is sufficiently high.
For low electric field strengths, traditional electrophoresis theory assumes a linear dependence between the velocity of the particle motion, Veph, and the electric field strength, E, as illustrated in eqn (1). If the voltage is sufficiently high, this theory becomes non-linear and can be described by adding a second term with the cubic dependence on the electric field strength:20
| Veph = μephE + μeph,3E3 | (6) |
In other words, in the signal of Fig. 2E, during the weak voltage-pulse, the nonlinear component would be absent and only the linear one is present.
The theory of non-linear or non-uniform electrophoresis was observed and theoretically described in many papers in the course of the past 35 years20,84–94 and the reason behind it is to do with the electrical double layer of the suspended charged particle. Stotz86 suggested that if the electric field is sufficiently strong, the electric double layer would completely be stripped off. Thus, the particle charge can directly be calculated by equating the Coulomb and Stokes forces.
Recently, the theory of nonlinear electrophoresis was tested experimentally and found to successfully produce thick deposits of inorganic,95,96 organic–inorganic particles97 and enzymes and biological cells.24,28,29,98–100,103 Using asymmetrical triangular waves, Neirinck et al.95,96 deposited thick and uniform alumina coatings with higher green density from low aqueous conductivity suspensions at 50 Hz and 500 Vp–p. Green density can be defined as the ratio of the ceramic powder volume to the external volume of the deposit. If the green density is low, cracking during drying and/or sintering of the deposit occur because of the large change in the volume. Fig. 11 illustrates the shape of the triangular wave used for EPD and the resulting alumina deposit in comparison with a coating obtained using CDC. While using CDC from aqueous suspensions, a porous coating is formed; the deposit produced under asymmetrical AC waveform is non-porous and homogenous. The reason for that is to do with water electrolysis.
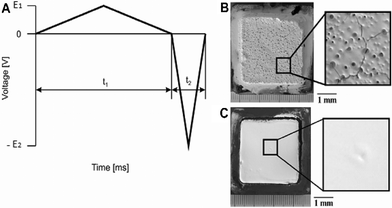 | ||
| Fig. 11 (A) One period of the applied asymmetric triangular AC signal and alumina deposits formed using 100 V DC for 1200 s (B) and 50 Hz and 500 Vp–p asymmetric AC field (C). Image reproduced from ref. 95 with permission of Elsevier. | ||
According to theoretical predictions, electrochemical reactions are suppressed using symmetric AC signals (Fig. 2C) if the frequency is sufficiently high because most of the electrochemical reactions are slow.20 Moreover, even when the frequency lies below the cut-off frequency of the electrochemical reaction, reaction products formed during the positive (or negative) part of the period are partly consumed when the signal is reversed during the rest of the period, thus lowering the reaction products. By contrast, when asymmetrical AC signals such as the triangular wave of Fig. 11 are used of which the integral over one period is zero, the difference in the voltage height and time duration (E–t) between the positive and the negative half-cycles will produce water electrolysis. The rate of electrolysis increases by lowering the frequency, elevating the voltage and the ionic conductivity of the suspension.101 However, compared to the electrolysis rates obtained by CDC, the rates under asymmetrical AC without net DC component are significantly low to yield large gas bubbles and damage of the deposited coating.
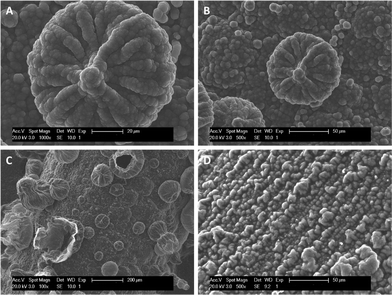
It turns out that the conditions from which EPD is accomplished under asymmetrical AC without net DC component including aqueous solvents and low electrolysis rates are conditions suitable to deposit biomolecules such as enzymes and biological cells. Ammam and Fransaer24 demonstrated that using asymmetrical triangular waveform of Fig. 11, thick and active layers of glucose oxidase (more than 10 μm) could be deposited at 30 Hz and 160 Vp–p. Such thicknesses cannot be achieved by classical electrodeposition from either buffers27 or low conductivity solutions.49 This suggests that under asymmetrical waves, the enzymes migrate greater distance to reach the electrode and deposit. Also, 89 μm thick layers of biological cells, S. Cerevisiae, were deposited under the applied conditions of 30 Hz and 200 Vp–p for 30 min (Fig. 12B). By comparison, using symmetrical triangular AC waves without net DC component, only a monolayer of S. Cerevisiae can be formed (Fig. 12A).
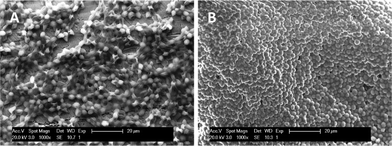 | ||
| Fig. 12 SEM micrographs showing the morphology of deposited S. Cerevisiae cells layers using symmetrical triangular waveform for 30 min at 30 Hz and 200 Vp–p (A) and using asymmetrical triangular wave of Fig. 11(A) for 30 min at 30 Hz and 200 Vp–p (B). Part of the image reproduced from ref. 28 with permission of Elsevier. | ||
The main characteristics of EPD under asymmetrical AC waves without net DC component are:
i) The deposition yield increases linearly with the polarization time for both inorganic ceramic materials95,96 and biochemical and biological species.24,28
ii) The deposition rates vary quasi-linearly with the applied amplitude then reach a saturation plateau,24,95 confirming in some sort that nonlinear mode of electrophoresis takes place at high voltages (eqn (6)).
iii) With respect to frequency, the deposition yield increases with the frequency from ∼0–50 Hz, reaches a plateau95 then drops at elevated frequencies.24 This is understandable since if the frequency is changing faster, the particles will no longer follow the AC field because of their inertia. As a consequence, the particles oscillate in a single place and their net migration is significantly reduced.
4. Applications of films by EPD under PDC and AC
In recent years, there has been a rising interest in nano and micro-structured materials because they usually exhibit novel and improved properties suitable for various applications. Compared to other deposition processes such as lithography, self-assembly, dip coating and spin coating, EPD technique offers the advantage of being versatile, cost saving and more importantly, allows deposition of high rates of particles in a controlled structural manner.Although, applications of films by EPD under CDC fields are wide and can be found in advanced ceramic materials, coatings for thin and thick films, multilayered composites, functionally graded materials, hybrid materials, self-supported components, micro-patterned assemblies, and nanotechnology.1 EPD under modulated electric fields, PDC and AC, offers new application perspectives such as in biotechnology. Because EPD can be accomplished from aqueous suspensions with low electrolysis rates under modulated electric fields, a variety of biochemical and biological species can be deposited to yield highly active layers suitable for a range of applications including biosensors, biofuel cells and bioreactors.24,28,29,75,98–104
Because EPD is an automated process, a variety of parameters such as voltage, frequency, concentration of the dispersed species and deposition time can be controlled to yield a better response under the optimized conditions. With regard to this, large number of biosensors with improved characteristics have recently been designed and manufactured by means of EPD under PDC and AC electric fields for detection of various analytes including glucose,24,49,99 lactose,98 glutamate100 and H2O2.103 Moreover, it is found that some biosensors are even dependable for determination of the analyte in real samples such as in milk and in blood.98,99 The latter is interesting considering the challenging aspects of the behavior of biosensors in real samples.105 By adding redox mediators, these electrodes have also been demonstrated to be useful for the manufacturing of glucose/O2 biofuel cells.104
Various microorganisms such as E. coli and S. Serevisiae cells have also been successfully deposited under modulated electric fields to form active monolayers29,75,102 and multilayers.28 In addition, some studies demonstrated that the viability of the deposited cells is even superior with respect to similarly treated free cells, thus improved bioreactors.28
Another important aspect of modulated electric fields over the classical CDC in EPD process is the control over the orientation of the particle during the deposition. The latter yields better ordered nano and micro-structures. In view of this, controlled zeolite microstructures can be formed on glassy carbon under PDC44 and, under AC fields, rod-shaped bacteria A. naeslundii75 as well as Bi2Sr2CaCu2Oδ tapes83 are observed to align parallel to the AC field. The well-organized and oriented deposited structures give rise to improved properties which is observed in many applications including superconductors,83 supercapacitors,97 field emission display devices based carbon nanotubes48 and sensitive ceramic gas sensors for CO and NO2 detection.77–79 Because PDC and AC generate low rate of water electrolysis and prevent coalescence between gas bubbles, high quality coatings useful for large range of applications such as ceramics and polymers can be produced.41–47,71,72,80,81,95,96 The smooth and non-porous texture of the coatings yields better anticorrosion properties.
5. Conclusions
The reviewed literature revealed that EPD under modulated electric fields, PDC and AC, is a very promising process for the deposition of high quality coatings. From environmentally friendly aqueous solvents, it is shown that a variety of materials including, inorganic, organic–inorganic and biochemical and biological species can be deposited in controlled fashions. The formed deposits displayed improved characteristics compared to what can be obtained by classical CDC fields including smooth and bubble-free films, well oriented microstructures, and high activity biochemical and biological deposited species. In addition, because EPD under PDC and AC is automated, this leads to high reproducibility. The latter have been proven to lead to new applications particularly in biotechnology such as in biosensors (glucose, glutamate, hydrogen peroxide), biofuel cells and cell based bioreactors with improved characteristics. With respect to this, particular attention should be paid to deposition of biochemical and biological charged particles such as enzymes and biological cells because the conditions under which EPD can be performed are now suitable for these species. Given the great potential of EPD under modulated electric fields for manipulation and assembly of particles, further research and development of these processes will allow the understanding of the mechanisms behind the assemblies. Also, design and fabrication of 2D and 3D dimensional microstructures for novel generation of future advanced applications in nano and biotechnology.Acknowledgements
The author would like to thank KU Leuven (GOA/08/007) and the Belgian Federal Science Policy Office (BELSPO) through the IUAP project INANOMAT (contract P6/17, Belgium) and Natural Sciences and Engineering Research Council of Canada, and the University of Ontario Institute of Technology (Canada) for their support.References
- L. Besra and M. Liu, A review on fundamentals and applications of electrophoretic deposition (EPD), Prog. Mater. Sci., 2007, 52, 1–61 CrossRef CAS
.
- F. Begona and M. Rodrigo, EPD kinetics: A review , J. Eur. Ceram. Soc., 2010, 30, 1069–1078 CrossRef
- I. Corni, M. P. Ryan and A. R. Boccaccini, Electrophoretic deposition: From traditional ceramics to nanotechnology, J. Eur. Ceram. Soc., 2008, 28, 1353–1367 CrossRef CAS
- O. Van der Biest and L. J. Vandeperre, Electrophoretic deposition of materials, Annu. Rev. Mater. Sci., 1999, 29, 327–352 CrossRef CAS
-
A. J. Bard, L. R. Faulkner, Electrochemical methods, Fundamentals and Applications, Wiley, NY, 2nd edn, 2001 Search PubMed
-
H. von Both and J. Hauβelt, Ceramic microstructures by electrophoretic deposition of colloidal suspensions, in Proceedings on the electrophoretic deposition conference 2002, ed. A. R. Boccaccini, O. Vanderbiest, P. S. Nicolson and J. Talbot, Electrochemical Society Proceedings, 2002, vol. 21, pp. 78–85 Search PubMed
- M. S. Chronberg and F. Händle, Processes and equipment for the production of materials by electrophoresis ELEPHANT, Interceram, 1978, 27, 33–34 Search PubMed
-
A. V. Kerkar, R. W. Rice, R. M. Spotnitz, Manufacture of optical ferrules by electrophoretic deposition, US Patent, 5
![[thin space (1/6-em)]](https://www.rsc.org/images/entities/char_2009.gif) 194129 Search PubMed
194129 Search PubMed - O. Sakurada, K. Suzuki, T. Miura and M. Hashiba, Bubble free electrophoretic deposition of aqueous zirconia suspensions with hydroquinone, J. Mater. Sci., 2004, 39, 1845–1847 CrossRef CAS
- S. Lebrette, C. Pagnoux and P. Abelard, Fabrication of titania dense layers by electrophoretic deposition in aqueous media, J. Eur. Ceram. Soc., 2006, 26, 2727–2734 CrossRef CAS
-
R. Clasen, Forming of compacts of submicron silica particles by electrophoretic deposition, in Proceedings of the 2nd Int. Conf. on Powder Processing Science, pp. 633–640, Deutsche Keramische Gesellschaft, Berchtesgaden ed. H. Hausner, G. L. Messing and S. Hirano, 1988, vol. 10, pp. 12–14 Search PubMed
- M. Ordung, J. Lehmann and G. Ziegler, Fabrication of fibre reinforced green bodies by electrophoretic deposition of silicon powder from aqueous suspension, J. Mater. Sci., 2004, 39, 889–894 CrossRef CAS
- J. Tabellion and R. Clasen, Electrophoretic deposition from aqueous suspensions for near-shape manufacturing of advanced ceramics and glasses-applications, J. Mater. Sci., 2004, 39, 803–811 CrossRef CAS
-
C. Oetzel and R. Clasen, Manufacturing of zirconia components by electrophoretic deposition of nanosized powders, proceeding of the 27th Annual Cocoa Beach Conference on Advanced Ceramics and Composites: A, ed. W. M. Kriven and H. T. Lin, Ceramic Engineering and Science Proceedings, 2008, vol. 24, pp. 69–74 Search PubMed
-
J. I. Hamagami, K. Kanamura, T. Umegaki, N. Fujiwara, M. Ito and S. Hirata, Direct deposition of alumina particles onto nonconductive porous ceramics by electrophoresis, in proceedings on the electrophoretic deposition conference 2002, ed. A. R. Boccaccini, O. Vanderbiest, P. S. Nicolson and J. Talbot, Electrochemical Society Proceedings, 2002, vol. 21, pp. 55–61 Search PubMed
- S. Novak, U. Maver, S. Peternel, P. Venturini, M. Bele and M. Gaberscek, Electrophoertic deposition as a tool for separation of protein inclusion bodies from host bacteria in suspension, Colloids Surf., A, 2009, 340, 155–160 CrossRef CAS
- P. Sarkar and P. S. Nicholson, Electrophoretic deposition (EPD): mechanisms, kinetics, and application to ceramics, J. Am. Ceram. Soc., 1996, 79, 1987–2002 CrossRef CAS
- J. Lyklema, Water at interfaces: a colloid-chemical approach, J. Colloid Interface Sci., 1977, 58, 242–250 CrossRef CAS
- O. D. Velev and K. H. Bhatt, On-chip micromanipulation and assembly of colloids particles by electric fields, Soft Matter, 2006, 2, 738–750 RSC
- A. S. Dukhin and S. S. Dukhin, Aperiodic capillary electrophoresis method using an alternating current electric field for separation of macromolecules, Electrophoresis, 2005, 26, 2149–2153 CrossRef CAS
- M. H. Oddy and J. G. Santiago, A method for determining electrophoretic and electroosmotic mobilities using AC and DC electric field, J. Colloid Interface Sci., 2004, 269, 192–204 CrossRef CAS
-
M. Zarbov, I. Schuster, L. Gal-Or Methodology for selection of charging agents for electrophoretic deposition of ceramic particles, in proceedings on the electrophoretic deposition conference 2002, ed. A. R. Boccaccini, O. Vanderbiest, P. S. Nicolson and J. Talbot, Electrochemical Society Proceedings, 2002, vol. 21, pp. 39–46 Search PubMed
- R. N. Basu, C. A. Randall and M. J. Mayo, Fabrication of dense zirconia electrolyte films for tubular solid oxide fuel cells by electrophoretic deposition, J. Am. Ceram. Soc., 2001, 1, 33–40 CrossRef
- M. Ammam and J. Fransaer, AC-electrophoretic deposition of glucose oxidase, Biosens. Bioelectron., 2009, 25, 191–197 CrossRef CAS
- J. Lyklema, H. P. Leeuwen and M. Minor, DLVO-theory, a dynamic re-interpretation, Adv. Colloid Interface Sci., 1999, 83, 33–69 CrossRef CAS
- B. Ferrari and R. Moreno, The conductivity of aqueous Al2O3 slips for electrophoretic deposition, Mater. Lett., 1996, 28, 353–355 CrossRef CAS
- N. Matsumoto, X. Chen and G. S. Wilson, Fundamental studies of glucose oxidase deposition on a Pt electrode, Anal. Chem., 2002, 74, 362–367 CrossRef CAS
- M. Ammam and J. Fransaer, Alternating current electrophoretic deposition of Saccharomyces cerevisiae cells and the viability of the deposited biofilm in ethanol production, Electrochim. Acta, 2010, 55, 3206–3212 CrossRef CAS
- B. Neirinck, L. Van Mellaert, J. Fransaer, O. Van der Biest, J. Anne and J. Vleugels, Electrophoretic deposition of bacterial cells, Electrochem. Commun., 2009, 11, 1842–1845 CrossRef CAS
-
N. Heavens, Electrophoretic deposition as a processing route for ceramics, in Advanced ceramic processing and technology, ed G. P. Binner, Noyes Publications, Park Ridge (NJ), USA, 1990, vol.1, pp. 255–283 Search PubMed
- R. W. Powers, The electrophoretic forming of beta-alumina ceramic, J. Electrochem. Soc., 1975, 122, 482–486 CrossRef
- Z. Jianling, W. Xiaohui and L. Longtu, Electrophoretic deposition of BaTiO3 films from aqueous suspensions, Mater. Chem. Phys., 2006, 99, 350–353 CrossRef
- H. C. Hamaker and E. J. W. Verwey, The role of the forces between the particles in electrodeposition and other phenomena, Trans. Faraday Soc., 1940, 35, 180–185 RSC
- F. Grillon, D. Fayeulle and M. Jeandin, J. Mater. Sci. Lett., 1992, 11, 272–275 CrossRef CAS
- H. Koelmans, Suspensions in Non-Aqueous Media, Phillips Res. Rep., 1995, 10, 161–193 Search PubMed
- D. De and P. S. Nicholson, Role of ionic depletion in deposition during electrophoretic deposition, , J. Am. Ceram. Soc., 1999, 8, 3031–3036 Search PubMed
-
(a) W. D. Ristenpart, I. A. Aksay and D. A. Saville, Assembly of colloidal aggregates by electrohydrodynamic flow: kinetic experiments and scaling analysis, , Phys. Rev., 2004, E69, 0214051–0214058 Search PubMed
- Y. Solomentsev, M. Bohmer and J. L. Anderson, Particle clustering and pattern formation during electrophoretic deposition: A hydrodynamic model, Langmuir, 1997, 13, 6058–6068 CrossRef CAS
- S. Ghosal, Fluid mechanics of electroosmotic flow and its effect on band broadening in capillary electrophoresis, Electrophoresis, 2004, 25, 214–228 CrossRef CAS
- D. C. Prieve, P. J. Sides and C. L. Wirth, 2D particle assembly of colloidal particles on a planar electrode, Curr. Opin. Colloid Interface Sci., 2010, 15, 160–174 CrossRef CAS
- L. Besra, T. Uchikoshi, T. S. Suzuki and Y. Sakka, Pulsed-DC electrophoretic deposition (EPD) of aqueous alumina suspension for controlling bubble incorporation and deposit microstructure, Key Eng. Mater., 2009, 412, 39–44 CrossRef CAS
- L. Besra, T. Uchikoshi, T. S. Suzuki and Y. Sakka, Application of constant current pulse to suppress bubble incorporation and control deposit morphology during aqueous electrophoretic deposition (EPD), J. Eur. Ceram. Soc., 2009, 29, 1837–1845 CrossRef CAS
- N. N. Naim, M. Kuwata, H. Kamiya and I. W. Lenggoro, Deposition of TiO2, nanoparticles in surfactant-containing aqueous suspension by a pulsed DC charging-mode electrophoresis, J. Ceram. Soc. Jpn., 2009, 117, 127–132 CrossRef
- B. Yu and S. B. Khoo, Controllable zeolite films on electrodes-comparing dc voltage electrophoretic deposition and a novel pulsed voltage method, Electrochem. Commun., 2002, 4, 737–742 CrossRef CAS
- N. M. Nazli, I. Motoyuki, K. Hidehiro and L. I. Wuled, Electrophoretic packing structure from aqueous nanoparticles suspension in pulse DC charging, Colloids and Surfaces, Colloids Surf., A, 2010, 360, 13–19 CrossRef
- L. Besra, T. Uchikoshi, T. S. Suzuki and Y. Sakka, Experimental verification of pH localization mechanism of particle consolidation at the electrode/solution interface and its application to pulsed DC electrophoretic deposition, J. Eur. Ceram. Soc., 2010, 30, 1187–1193 CrossRef CAS
- M. N. Naim, M. Lijima, K. Sasaki, M. Kuwata and H. Kamiya, Electrical-driven disaggregation of the two-dimensional assembly of colloidal polymer particles under pulse DC charging, Adv. Powder Technol., 2010, 21, 534–541 CrossRef CAS
- C. Y. Hsiao, T. F. Chan, S. H. Lee, K. Cheng, Y. A. Li, L. J. Tsai, J. S. Fang and C. C. Kuo, Electrophoresis deposition method to fabricate CNT-FED cathode in water base solution, Dig. Tech. Pap. - Soc. Inf. Disp. Int. Symp., 2005, 36, 411–413 CrossRef CAS
- M. Ammam and J. Fransaer, A study on electrodeposition of glucose oxidase from low conductivity solutions, Electrochim. Acta, 2010, 55, 9125–9131 CrossRef CAS
- P. J. Sides and C. W. Tobias, A close view of gas evolution from the back side of a transparent electrode, J. Electrochem. Soc., 1985, 132, 583–587 CrossRef CAS
- M. Ammam and J. Fransaer, Micro-biofuel cell powered by glucose/O2 based on electro-deposition of enzyme, conducting polymer and redox mediators: Preparation, characterization and performance in human serum, Biosens. Bioelectron., 2010, 25, 1474–1480 CrossRef CAS
- N. G. Green, A. Ramos and H. Morgan, AC electrokinetics: A survey of sub-micrometre particle dynamics, J. Phys. D: Appl. Phys., 2000, 33, 632–641 CrossRef CAS
- J. A. Fagan, P. J. Sides and D. C. Prieve, Evidence of multiple electrohydrodynamic forces acting on a colloidal particles near an electrode due to an alternating current electric field, Langmuir, 2005, 21, 1784–1794 CrossRef CAS
- P. J. Sides, Electrohydrodynamic particles aggregation on an electrode driven by an alternating current electric field normal to it, Langmuir, 2001, 17, 5791–5800 CrossRef CAS
- J. Kim, J. L. Anderson, S. Garoof and P. J. Sides, Effects of zeta potential and electrolyte on particle interaction on an electrode under AC polarization, Langmuir, 2002, 18, 5387–5391 CrossRef CAS
- J. A. Fagan, P. J. Sides and D. C. Prieve, Vertical motion of a charged colloids particles near an AC polarized electrode with nonuniform potential distribution: Theory and experimental evidence, Langmuir, 2004, 20, 4823–4834 CrossRef CAS
- J. A. Fagan, P. J. sides and D. C. Prieve, Mechanism of rectified lateral motion of particles near electrodes in alternating electric fields below 1 kHz, Langmuir, 2006, 22, 9846–9852 CrossRef CAS
- P. C. Y. Chen, Alternating current electrophoresis of human red blood cells, Ann. Biomed. Eng., 1980, 8, 253–269 CrossRef CAS
- B. K. Gale and M. Srinivas, Cyclical electrical field flow fraction, Electrophoresis, 2005, 26, 1623–1632 CrossRef CAS
- Z. R. Li, G. R. Liu, J. Han, Y. Z. Chen, J. S. Wang and N. G. Hadjiconstantinou, Transport of biomolecules in asymmetric nanofilter arrays, Anal. Bioanal. Chem., 2009, 394, 427–435 CrossRef CAS
-
P. D. Grossman, J. C. Colburn, Capillary Electrophoresis: Theory and
Practice, Academic Press, New York, 1992 Search PubMed
-
W. B. Russel, D. A. Saville, W. R. Schowalter, Colloidal Dispersions, Cambridge University Press, 1995 Search PubMed
- P. F. Rider and R. W. O'Brien, The dynamic mobility of particles in a nondilute suspension, J. Fluid Mech., 1993, 257, 607–636 CrossRef CAS
- H. A. Pohl, The motion and precipitation of suspensions in divergent electric fields, J. Appl. Phys., 1951, 22, 869–871 CrossRef CAS
-
H. A. Pohl, Dielectrophoresis, Cambridge University Press, 1978 Search PubMed
-
T. B. Jones, Electromechanics of Particles, Cambridge University Press, New York, 1995 Search PubMed
- R. Pethig, Dielectrophoresis: Using inhomogeneous AC electrical fields to separate and manipulate cells , Crit. Rev. Biotechnol., 1996, 16, 331–348 CrossRef
- W. M. Arnold, H. P. Schwan and U. Zimmermann, Surface conductance and other properties of latex particles measured by electrorotation, J. Phys. Chem., 1987, 91, 5093–5098 CrossRef CAS
- X. B. Wang, R. Pethig and T. B. Jones, Relationship of dielectrophoretic and electrorotational behavior exhibited by polarized particles, J. Phys. D: Appl. Phys., 1992, 25, 905–912 CrossRef CAS
- R. Hagedorn, G. Fuhr, T. Muller and J. Gimsa, Traveling wave dielectrophoresis of microparticles, Electrophoresis, 1992, 13, 49–54 CrossRef CAS
-
(a)
Making Rubber Objects From Dispersions by Electrophoretic Deposition in an Alternating Current, Dunlop Rubber Co. Ltd. and The Anode Rubber Co. Ltd., 1930, DE 587700 19331107 Search PubMed
- R. Riahifar, B. Raissi, E. Marzbanrad and C. Zamani, Effects of parameters on deposition pattern of ceramic nanoparticles in non-unifrom AC electric field, J. Mater. Sci.: Mater. Electron., 2011, 22, 40–46 CrossRef CAS
- Z. R. Ul'berg, T. V. Kuznetsova and A. S. Dukhin, Electrophoretic dispersion deposition in external alternating electric field, Dopov. Akad. Nauk Ukr. RSR, Ser. B: Geol., Khim. Biol. Nauki, 1979, 11, 936–940 Search PubMed
- Y. Hirata, A. Nishimoto and Y. Ishihara, Forming of alumina powder by electrophoretic deposition, J. Ceram. Soc. Jpn., 1991, 99, 108–113 CrossRef CAS
- A. T. Poortinga, R. Bos and H. J. Busscher, Controlled electrophoresis deposition of bacteria to surface for the design of biofilms, Biotechnol. Bioeng., 2000, 67, 117–120 CrossRef CAS
- A. R. Gardeshzadeh, B. Raissi and E. Marzbanrad, Deposition of multiwall carbon nanotubes using low frequency alternating electrophoretic deposition, Key Eng. Mater., 2009, 412, 83–86 CrossRef CAS
- A. R. Gardeshzadeh, B. Raissi, E. Marzbanrad and H. Mohebbi, Fabrication of resistive CO gas sensor based on SnO2 nanopowders via low frequency AC electrophoretic deposition, J. Mater. Sci.: Mater. Electron., 2009, 20, 127–131 CrossRef CAS
- E. K. Heidari, C. Zamani, E. Marzbanrad, B. Raissi and S. Nazarpour, WO3-based NO2 sensors fabricated through low frequency AC electrophoretic deposition, Sens. Actuators, B, 2010, B146, 165–170 CrossRef CAS
- E. K. Heidari, E. Marzbanrad, C. Zamani and B. Raissi, Nanocasting synthesis of ultrafine WO3 nanoparticles for gas sensing applications, Nanoscale Res. Lett., 2010, 5, 370–373 CrossRef CAS
- R. Riahifar, E. Maezbanrad, B. R. Dehkordi and C. Zamani, Role of substrate potential on filling the gap between two planar parralel electrodes in electrophoretic deposition, Mater. Lett., 2010, 64, 559–561 CrossRef CAS
- A. Nold and R. Clasen, Bubbles free electrophoretic deposition shaping from aqueous suspension with micro point electrode, J. Eur. Ceram. Soc., 2010, 30, 2971–2975 CrossRef CAS
- Y. Shindo, M. Nakamura and T. Tanaka, Alternating current electrophoretic coating process. III. Effect of substrate metals on the properties of coatings, Aruminyumu Hyomen Shori Kenkyu Chosa Hokoku, 1974, 91, 73–74 CAS
- C. F. J. Yue, D. Kumar and R. K. Singh, Fabrication of Ag-sheathed Bi-Sr-Ca-Cu-O thick films by a novel AC electric field assisted electrophoretic deposition method, Phys. C, 1999, 314, 291–298 CrossRef CAS
- S. S. Dukhin, A. K. Vidybida, A. S. Dukhin and A. A. Serikov, Aperiodic electrophoresis. Directed drift of disperse particles in a uniform, alternating anharmonic electric field, Kolloidn. Zh., 1988, 49, 853–857 Search PubMed
-
S. S. Dukhin, B. V. Derjaguin, Electrophoresis, 1972, ch. 10, Nauka, Moscow, pp. 195–213 Search PubMed
- S. Stotz, Field dependence of the electrophoretic mobility of particles suspended in low-conductivity liquids , J. Colloid Interface Sci., 1978, 65, 118–130 CrossRef CAS
- S. S. Dukhin, T. S. Simonova and I. T. Gorbachuk, Physics of solid body, Bull. Kiev Pedagogical Institute, 1972, 113–123 Search PubMed
- P. S. Vincett, High-field electrophoresis of insulating particles in insulating liquids. I. An electrical transient technique for studying particle mobility, charge, degree of aggregation, adhesive forces, and high-field charging mechanisms, J. Colloid Interface Sci., 1980, 76, 83–94 CrossRef CAS
- P. S. Vincett, High-field electrophoresis of insulating particles in insulating liquids. II. A study of the basic transport mechanisms, including a novel space charge limited conduction process, J. Colloid Interface Sci., 1980, 76, 95–106 CrossRef CAS
- S. S. Dukhin, Electrophoresis at large peclet numbers, Adv. Colloid Interface Sci., 1991, 36, 219–248 CrossRef CAS
- N. A. Mishchuk and S. S. Dukhin, Electrophoresis of solid particles at large Peclet numbers, Electrophoresis, 2002, 23, 2012–2022 CrossRef CAS
- S. S. Dukhin, Electrokinetic phenomena of the second kind and their applications, Adv. Colloid Interface Sci., 1991, 35, 173–196 CrossRef CAS
-
N. A. Mishchuk, S. S. Dukhin, in Interfacial Electrokinetics and Electrophoresis, ed. A. Delgado, Marcel Decker, New York/Basel, 2002, pp. 241–275 Search PubMed
- A. S. Dukhin, Biospecific mechanism of double layer formation and peculiarities of cell electrophoresis , Colloids Surf., A, 1993, 73, 29–48 CrossRef
- B. Neirinck, J. Fransaer, O. Van der Biest and J. Vleugels, Aqueous electrophoretic deposition in asymmetric AC electric fields (AC-EPD), Electrochem. Commun., 2009, 11, 57–60 CrossRef CAS
-
B. Neirinck, J. Fransaer, J. Vleugels and O. Van der Biest, Aqueous Electrophoretic Deposition at High Electric Fields, Electrophoretic deposition: Fundamentals and applications III Book Series: Key Eng. Mater., 2009, vol. 412, pp. 33–38 Search PubMed
- M. Ammam and J. Fransaer, Ionic liquid-heteropolyacid: Synthesis, characterization, and supercapacitor study of films deposited by electrophoresis, J. Electrochem. Soc., 2010, 158, A14–A21 CrossRef
- M. Ammam and J. Fransaer, Two-enzyme lactose biosensor based on β-galactosidase and glucose oxidase deposited by AC-electrophoresis: Characteristics and performance for lactose determination in milk, Sens. Actuators, B, 2010, B148, 583–589 CrossRef CAS
- M. Ammam and J. Fransaer, Glucose microbiosensor based on glucose oxidase immobilized by AC-EPD: Characteristics and performance in human serum and in blood of critically ill rabbits, Sens. Actuators, B, 2010, B145, 46–53 CrossRef CAS
- M. Ammam and J. Fransaer, Highly sensitive and selective glutamate microbiosensor based on cast polyurethane/AC-electrophoresis deposited multiwalled carbon nanotubes and then glutamate oxidase/electrosynthesized polypyrrole/Pt electrode, Biosens. Bioelectron., 2010, 25, 1597–1602 CrossRef CAS
- M. Ammam and J. Fransaer, Effects of AC-electrolysis on the enzymatic activity of glucose oxidase, Electroanalysis, 2011, 23, 755–763 CrossRef CAS
- V. Brisson and R. D. Tilton, Self-assembly and two-dimensional patterning of cell arrays by electrophoretic deposition, Biotechnol. Bioeng., 2002, 77, 290–295 CrossRef CAS
- M. Ammam and J. Fransaer, AC-electrophoretic deposition of metalloenzymes: Catalase as a case study for the sensitive and selective detection of H2O2, Sens. Actuators, B, 2011, 160, 1063–1069 CrossRef CAS
- . M. Ammam and J. Fransaer, Glucose/O2 biofuel cell based on enzymes, redox mediators, and Multiple-walled carbon nanotubes deposited by AC-electrophoresis then stabilized by electropolymerized polypyrrole, Biotechnol. Bioeng., 2012, 109, 1601, DOI:10.1002/bit.24438
- G. S. Wilson and M. Ammam, In vivo Biosensors, FEBS J., 2007, 274, 5452–546 CrossRef CAS
| This journal is © The Royal Society of Chemistry 2012 |