Synthesis, characterization and DNA binding properties of rutin–iron complex
Stalin
Selvaraj
,
Sridharan
Krishnaswamy
,
Venkappayya
Devashya
,
Swaminathan
Sethuraman
and
Uma Maheswari
Krishnan
*
Centre for Nanotechnology & Advanced Biomaterials, School of Chemical & Biotechnology, SASTRA University, Thanjavur 613 401, India. E-mail: umakrishnan@sastra.edu; Fax: +91 4362 264120; Tel: +91 4362 264101 Ext: 677
First published on 8th February 2012
Abstract
A rutin–iron complex was prepared at room temperature and characterized using elemental analysis, IR spectroscopy and UV-visible spectroscopy to elucidate its structure. The DNA binding properties of rutin and the rutin–iron complex have been investigated using electronic absorption spectroscopy and agarose gel electrophoresis. The gradual reduction in the absorption peak observed for both rutin and the rutin–iron complex with increasing concentration of DNA indicates an intercalative mode of interaction. The binding constant (Kb) for the rutin–iron complex was three fold greater than that for rutin. Rutin exhibits a tendency to degrade the plasmid DNA unlike the rutin–iron complex because of its ability to introduce torsional stress in the DNA double helix. The additional electrostatic interaction between the cationic rutin–iron complex and the anionic DNA does not contribute to any torsional strain and hence no DNA shearing was observed. Molecular docking studies also confirmed the intercalative mode of interaction for both the compounds. These results indicate the potential of the rutin–iron complex as an anti-cancer agent.
1. Introduction
Flavonoids are a group of polyphenolic organic compounds, mostly present in herbs and spices. They possess multiple biological functions including anti-oxidant, anti-cancer, anti-inflammatory, anti-diabetic, anti-atherosclerotic and anti-apoptotic properties.1–5 Their anti-radical activity is mainly attributed to their structure, position of OH groups and interaction with biological membranes.6 Due to their different pharmacological activities, flavonoids have various targets in the biological system such as membrane receptor proteins, cytoplasmic proteins and DNA.7 Flavonoids also play a crucial role in altering the gene expression because of their ability to bind with the double helical DNA.7DNA is an important component for many biochemical processes that occur in the cellular system. The different loci present in the DNA are involved in various regulatory processes such as gene expression, gene transcription, mutagenesis, carcinogenesis etc.,2,7,8. All the above processes, mediated by DNA, can be modified by the interaction of smaller organic molecules with specific regions in the DNA. Many molecules including flavonoids have been shown to exert their anti-cancer activities by binding with DNA thereby altering DNA replication and inhibiting the growth of tumor cells.2,7,8 Thus, DNA binding is a major criterion for the designing of novel anti-neoplastic agents. Development of new molecules with high binding affinity to DNA has received a lot of attention. Protective action of flavonoids on chemical-induced DNA damage has been attributed to their metal chelating and radical scavenging effects.2 Recently, flavonoids such as quercetin, morin and rutin have been shown to exhibit DNA binding properties with quercetin displaying highest binding affinity.9 This may also be correlated with the anti-tumor properties reported for quercetin.10 However, DNA binding properties may also trigger subsequent DNA degradation, which may be one of the impeding factors in the case of gene therapy, as the therapeutic gene or plasmid may degrade even before reaching its target.9,10 As flavonoids are ubiquitously found in diet, information on the DNA binding characteristics of different flavonoids might help in designing proper therapeutic and dietary regimens.
Rutin is a flavonoid glycoside found in fruits, vegetables and also in some beverages such as tea and wine. Rutin is known to possess anti-oxidant, anti-inflammatory, anti-carcinogenic, anti-thrombotic, vaso-protective and cyto-protective properties in addition to inducing the respiratory burst of neutrophils.11,12 The in vivo anti-oxidant activity of rutin is reported to be mainly due to its metabolite quercetin, which has excellent free radical scavenging effect. But a few studies have also shown that rutin is a pro-oxidant at certain concentrations and this may be due to the formation of nitrosyl intermediates of rutin, which cause cell damage.11,12 However, conflicting reports exist on the pro-oxidant and anti-oxidant nature of rutin.13 Certain studies have suggested that the transition between pro-oxidant to anti-oxidant character is concentration dependent and have also implicated the presence of transition metal ions for the same.14 However, the interaction of transition metal ions with flavonoids is not well understood.
Transition metal ions such as Cu(II), Fe(II), Zn(II) and Ni(II) are prevalent in the human body. Several reports indicate that these transition metal ions induce oxidative damage to the DNA, leading to cell death.13,14 As flavonoids exhibit good metal chelating properties, a study of the DNA binding nature of flavonoid–metal complexes could serve to assess the therapeutic potential of the molecules. Metal complexes have been found to exhibit various modes of interaction with the double stranded DNA to alter gene expression.14 The DNA binding property of novel naringenin Schiff's base complexes of Cu(II), Zn(II) and Ni(II) have shown that Cu(II) complex has better DNA binding efficiency compared to Zn(II) complex.15 Similarly, the La(III) complexes of hesperitin–O–methyl chalcone possess better DNA intercalating efficiency with the double stranded DNA compared to its parent compound.16
However, there is no study to evaluate the DNA binding properties of rutin or its transition metal complexes. Thus, the objective of the present work is to synthesize a rutin–iron complex and investigate the interaction of rutin and its iron complex with calf thymus DNA (CT-DNA) and pUC18 plasmid DNA to understand the therapeutic potential of the flavonoid and its iron complex.
2. Materials and methods
2.1. Reagents
Rutin (Sigma-Aldrich, India), iron(II) sulphate (Merck, India) and methanol were used for the synthesis of the rutin–iron complex. Calf thymus DNA (CT-DNA) (Himedia, India) and pUC18 plasmid DNA (Bangalore Genei, India) were used for DNA binding property studies.2.2. Synthesis and characterization of the rutin–iron complex
1 mM (0.608 g) of rutin dissolved in 50 mL of methanol was mixed with 1 mM of iron(II) sulphate (0.169 g) in 25 mL of distilled water and stirred for 6 h at room temperature. The dark brown coloured precipitate obtained was washed with water and methanol thrice to remove the unreacted iron sulphate and rutin followed by vacuum drying.2.3. Characterization of the rutin–iron complex
The structure of the rutin–iron complex was elucidated using the following techniques. The carbon and hydrogen in the complex were analyzed using a CHNS analyzer (Elementar Vario EL III Germany). Iron in the complex was estimated by atomic absorption spectrometry (AAnalyst 400, Perkin-Elmer, USA). The binding of iron to rutin was confirmed by using FT-IR spectroscopy (Spectrum 100, Perkin Elmer, USA). The UV-Visible spectrum of the complex was recorded using dimethyl sulphoxide (DMSO) as the solvent at room temperature using a double beam UV-Visible spectrophotometer (Lambda 25, Perkin-Elmer, USA). The presence of coordinated water was also confirmed using a TG-DTA with universal T4.7A TA instruments.2.4. Electronic absorption spectra
Absorption titrations were performed with a constant concentration of rutin or its iron complex (10 μM), while gradually increasing the quantity of CT-DNA, ranging from 2.5, 5.0, 7.5 and 10.0 μg. Each sample solution was scanned in the range of 260–800 nm. The binding efficiency of the ligands to the CT-DNA was measured by plotting the ratio of −[DNA]/(εa − εf) versus the concentration of DNA where εa is the molar extinction coefficient for an unbound ligand and εf is the molar extinction coefficient for a bound ligand. The slope of the linear plot gives the DNA binding constant, K.16 The binding constant for rutin and its iron complex are designated as Ka and Kb respectively.2.5. Agarose gel electrophoresis
DNA binding property for different concentrations (20, 40, 60, 80 and 100 μM) of rutin and the rutin–iron complex was analysed using pUC18 plasmid DNA with agarose gel electrophoresis, keeping the concentration of the plasmid DNA constant at 400 ng.2.6 In silico analysis
The binding efficiency and mode of binding for both rutin and rutin–iron complex with double stranded DNA were analysed using online Patchdock server. The structure of double stranded DNA, rutin and rutin–iron complex were modeled using CHEMDRAW (Version 8.0) and converted to PDB format for docking studies.3. Results and discussion
3.1. Characterization of the rutin–iron complex
The elemental analysis of rutin and rutin–iron complex is presented in Table 1. The amount of iron in the complex was found to be 4.87%, which is in close agreement with the calculated value of 4.25% assuming a ML2·2H2O complex. This result suggests that the metal to ligand ratio in the complex is 1![[thin space (1/6-em)]](https://www.rsc.org/images/entities/char_2009.gif) :2.
:2.
The FT-IR data for rutin and the rutin–iron complex are given in Table 2. The ν(C![[double bond, length as m-dash]](https://www.rsc.org/images/entities/char_e001.gif) O) of rutin is shifted from 1655 cm−1 to 1632 cm−1 in the iron complex indicating the coordination of the carbonyl oxygen (CO) to iron in the rutin–iron complex. The ν(C–O–C) for rutin is shifted from 1362 cm−1 to 1357 cm−1 indicating the coordination of the 5′–OH group with iron. The weak vibration band (ν(OH)) at 3856 cm−1 in the complex indicates the presence of coordinated water in the iron complex.17
O) of rutin is shifted from 1655 cm−1 to 1632 cm−1 in the iron complex indicating the coordination of the carbonyl oxygen (CO) to iron in the rutin–iron complex. The ν(C–O–C) for rutin is shifted from 1362 cm−1 to 1357 cm−1 indicating the coordination of the 5′–OH group with iron. The weak vibration band (ν(OH)) at 3856 cm−1 in the complex indicates the presence of coordinated water in the iron complex.17
| Compound | Vibration frequencies (cm−1) | |||
|---|---|---|---|---|
|
v(CO) |
v(OH) |
v(CC) |
v(C–O–C) | |
| Rutin | 1655 | — | 1505 | 1362 |
| Rutin–iron complex | 1632 | 3856 | 1504 | 1357 |
The UV-Visible spectra for rutin and the rutin–iron complex are shown in Fig. 1A. A weak absorption band at 261 nm (Band II, benzoyl system) and a strong absorption band at 363 nm (Band I, cinnamoyl system) for rutin, confirm the flavone structure. However, in the rutin–iron complex, Band II is shifted to 269 nm and Band I is shifted to 420 nm indicating the co-ordination of iron to the carbonyl and phenolic OH group of rutin. Since, iron tends to form octahedral complexes, the additional coordinating bonds required for the octahedral rutin–iron complex are provided by water.17
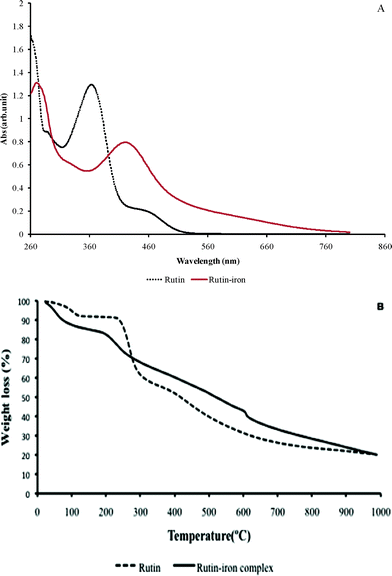 | ||
| Fig. 1 (A) UV-Visible spectra for rutin and the rutin–iron complex. (B) Thermogravimetric analysis of rutin and the rutin–iron complex. | ||
Fig. 1B shows the thermal degradation profiles for both rutin and its iron complex. In the case of rutin, an initial weight loss of 6.38% corresponding to removal of superficial moisture was observed at 110 °C. No further weight change was observed until 234 °C. Beyond this temperature a progressive weight loss due to degradation of the organic moieties was observed. In the case of the rutin–iron complex, an initial weight loss was observed at 100 °C due to loss of superficial moisture. An additional weight loss of 2.49% was observed at 193 °C in the case of rutin–iron complex, which may be attributed to the loss of two molecules of coordinated water. This data correlates with the earlier observation from elemental analysis indicating the presence of two molecules of coordinated water in the complex. Further reduction in weight due to the removal of organic ligands was discernible in the TG profile of the rutin–iron complex. Interestingly, it was observed that nearly 45% weight loss occurred in the case of rutin at 400 °C while in the case of its iron complex, the same weight loss occurred at 600 °C indicating the enhanced thermal stability of the complex. Similar TGA profiles have been reported in the literature for flavonoid–vanadyl complexes.18 From the spectral data obtained, the proposed structure of the rutin–iron complex is shown in Fig. 2.
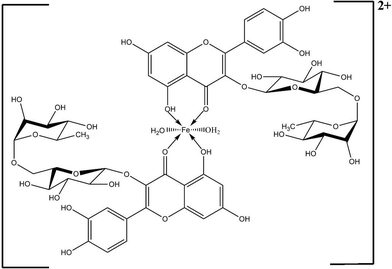 | ||
| Fig. 2 Proposed structure of the rutin–iron complex. | ||
3.2. Electronic absorption spectroscopy
Spectroscopic titration techniques are widely used to study the DNA binding property of organic chromophores. The electronic absorption spectrum for rutin in the presence of different quantities of CT-DNA (2.5, 5.0, 7.5 and 10.0 μg) is shown in Fig. 3. The electronic absorption spectrum for rutin shows two bands at 261 nm and 363 nm due to the A ring (Band II, benzoyl system) and the B ring (Band I, cinnamoyl system).19 The increasing concentrations of CT-DNA in the presence of 100 μM rutin gradually decrease the intensity of the absorption peak at 363 nm due to the hypochromic effect. The absorption maximum progressively exhibits a bathochromic shift from 336 nm for 0 μg CT-DNA to 376 nm for 10 μg CT-DNA. The maximum reduction in the intensities of absorption peaks at 261 nm and 363 nm were observed to be 35.67% and 33.52% respectively (Fig. 3A). The shift in absorbance maxima on interaction of a molecule with DNA is a typical characteristic of intercalation of the molecule within the DNA double helix.16 Similar observations have been reported for hesperitin-2-hydroxy benzoyl hydrazone complexes of Cu(II), Zn(II) and Ni(II) and for flavonoids.16,19 The hypochromic shift is indicative of a distortion of the double helical structure of DNA and the bathochromic effect observed can be attributed to the Π–Π* coupling between the aromatic rings of rutin and the base pairs in CT-DNA, due to stacking between rutin and DNA.16,19![(A) Electronic absorption titrations for 10 μM rutin in the presence of different concentrations of CT-DNA (2.5, 5.0, 7.5 and 10.0 μg). Scan range: 260–800 nm. Incubation time: 15 min. (B) Plot of −[DNA]/(εa − εf) versus [DNA] for rutin. Slope of the y-intercept gives the binding constant.](/image/article/2012/RA/c2ra01319c/c2ra01319c-f3.gif) | ||
| Fig. 3 (A) Electronic absorption titrations for 10 μM rutin in the presence of different concentrations of CT-DNA (2.5, 5.0, 7.5 and 10.0 μg). Scan range: 260–800 nm. Incubation time: 15 min. (B) Plot of −[DNA]/(εa − εf) versus [DNA] for rutin. Slope of the y-intercept gives the binding constant. | ||
Fig. 3B shows the linear relationship between the concentrations of DNA and its binding ability with 10 μM of rutin. The binding constant, Ka for rutin to CT-DNA was calculated to be 0.869. The mode of intercalation of rutin within DNA can have many biological implications. Rutin has been ineffective in reducing the DNA damage induced by mitomycin C and menadione but has shown protective effects against aflatoxin and tertiary butyl hydroperoxide mediated DNA damage.20–23 Though, these reports seem to be contradictory, they can be correlated with the DNA intercalating property of rutin. Mitomycin C is known to cause alkylation and cross-link with DNA base pairs and hence prevents intercalation of rutin, thus rendering it ineffective in protecting against DNA damage.20 Menadione damages DNA by producing free radicals that causes DNA strand lesions, which cannot be prevented by rutin, which tends to intercalate within the DNA.21 On the other hand, aflatoxin causes DNA damage by intercalating within DNA and since rutin also intercalates within the DNA, it competes with aflatoxin for intercalating sites thus preventing aflatoxin binding and subsequent DNA damage.22
Fig. 4A shows the electronic absorption spectrum for the rutin–iron complex (10 μM) in the presence of different concentrations of CT-DNA in the scan range 260–800 nm. The absorption maxima for the rutin–iron complex at 420 nm gradually decrease with increasing concentrations of CT-DNA. The absorption bands of the rutin–iron complex at 420 nm exhibits a reduction in intensity of 14.32% as the CT-DNA concentration increases from 0–10 μg. However, no bathochromic shift was observed, indicating that the metal ion increases the planarity of the parent flavonoid and also produces a positively charged rutin–iron complex which favours better interaction and intercalation with double stranded DNA. The hypochromic effect shows that a distortion in the double helix of DNA has occurred during the intercalation process. Janjua et al., have reported a similar mode of intercalation of morin, rutin and quercetin within the DNA.19
![(A) UV-visible absorption spectra recorded for 10 μM rutin–iron complex with increasing concentration of CT-DNA (2.5, 5.0, 7.5 and 10.0 μg). Scan range: 260–800 nm. Incubation time: 15 min. (B) Plot of −[DNA]/(εa − εf) versus [DNA] for the rutin–iron complex. Slope of the y-intercept gives the binding constant.](/image/article/2012/RA/c2ra01319c/c2ra01319c-f4.gif) | ||
| Fig. 4 (A) UV-visible absorption spectra recorded for 10 μM rutin–iron complex with increasing concentration of CT-DNA (2.5, 5.0, 7.5 and 10.0 μg). Scan range: 260–800 nm. Incubation time: 15 min. (B) Plot of −[DNA]/(εa − εf) versus [DNA] for the rutin–iron complex. Slope of the y-intercept gives the binding constant. | ||
The relationship between the concentration of DNA and its binding ability with 100 μg of the rutin–iron complex is presented in Fig. 4B. A linear dose-dependent increase in the binding efficiency of CT-DNA to the rutin–iron complex was observed. The binding constant, Kb was calculated to be 2.72. The higher DNA binding affinity displayed by the rutin–iron complex when compared to its parent flavonoid may be attributed to the additional electrostatic interactions that can occur between the positively charged complexes and the negatively charged phosphate backbone of the double stranded DNA.
3.3. Agarose gel electrophoresis
Electrophoresis was performed using a specified concentration of pUC18. The DNA binding of different concentrations of rutin and rutin–iron complex (20–100 μM) was carried out at pH 7.4. Before commencement of electrophoresis, different concentrations of rutin and the rutin–iron complex were incubated separately with a constant concentration of pUC18 DNA for 15 min.Fig. 5 shows the bands obtained for pUC18 incubated with different concentrations (20–100 μM) of rutin and its iron complex. Lane 1 shows the control pUC18 DNA, which indicates the presence of open coiled and super coiled DNA in the plasmid sample. The other lanes (2–11) indicate the plasmid DNA in the presence of different concentrations of rutin and the rutin–iron complex. The presence of different concentrations of the rutin–iron complex with plasmid DNA shows no change in the appearance of the open coiled and super coiled DNA compared to the control (Lanes 2–6). The shearing in the open coiled and super coiled DNA is observed in the case of interactions between rutin and plasmid DNA (Lanes 7–11). A dose dependent decrease in the intensity of both (open and super coiled) bands is observed in the case of the rutin–iron complex compared to the plasmid DNA.
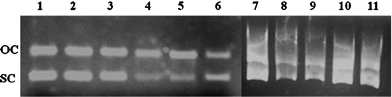 | ||
| Fig. 5 Agarose gel electrophoresis pattern for pUC18 plasmid DNA in the presence of increasing concentrations (20–100 μM) of rutin (Lane 7–11) and rutin–iron complex (Lane 2–6). Lane 1: control. Plasmid DNA: 400 ng). OC = Open coiled, SC = Super coiled. | ||
The decrease in the intensity of the bands for open coiled and super coiled plasmid DNA in the presence of increasing concentrations of the rutin–iron complex may be attributed to the intercalation of the complex with the DNA. This is further highlighted by the fact that the decrease in band intensity for super coiled DNA is more pronounced when compared with the open coiled form. The decrease in the intensity can be attributed either to the competitive replacement of ethidium bromide, an intercalating agent by the rutin–iron complex or the binding of the rutin–iron complex with the fluorescent ethidium bromide dye. In the case of rutin, the plasmid DNA bands are visualized as a stack consisting of multiple bands at all concentrations studied, which is characteristic of DNA degradation. Plasmid DNA is susceptible to hydrodynamic shear stresses that can initiate its degradation.24 The intercalation of rutin within the DNA can produce a torsional strain, which in turn causes an increase in the hydrodynamic shear resulting in DNA degradation. The role of torsional strain in promoting shear induced plasmid DNA degradation has been recently highlighted by Catanese et al., in connection with gene delivery.24 Such torsional strain-induced DNA shear and degradation are absent in rutin–iron complex which may be due to the additional stability and rigidity conferred by the electrostatic interactions existing between the cationic complex and the anionic phosphate backbone of the DNA.
The binding mode of rutin and the rutin–iron complex with double stranded DNA was also modeled using in silico tools (Fig. 6). The in silico predictions are in agreement with the conclusions derived from the gel electrophoresis data. The rutin–iron complex is seen to interact with the phosphate back bone and also intercalates with the DNA. Rutin shows more pronounced intercalation than its iron complex. The above studies confirm that both rutin and the rutin–iron complex interact with the double stranded DNA primarily by intercalation. Among the two, the rutin–iron complex has a stronger binding efficiency compared to its parent flavonoid.
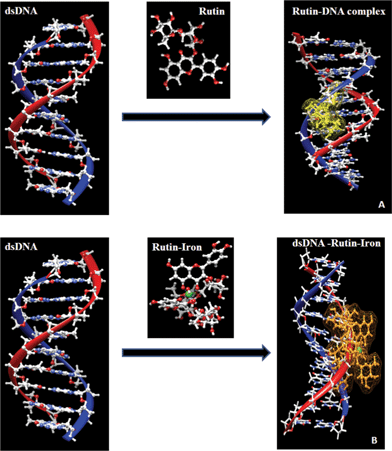 | ||
| Fig. 6 In silico binding mode for rutin (A) and the rutin–iron complex (B) with dsDNA using PATCHDOCK online server. | ||
4. Conclusion
A room temperature synthesis for a rutin–iron complex has been successfully achieved. The structure of the complex was established on the basis of elemental analysis and spectroscopic data. Both rutin and the rutin–iron complex exhibit good intercalation with DNA. However, the rutin molecule was found to induce DNA degradation due to torsional stress, while the rutin–iron complex does not display any degradation characteristics. This confirms the better stabilization of the DNA double helix via stacking Π–Π* interactions and by electrostatic attractions as well. Thus, the rutin–iron complex holds great promise as a potential anti-cancer molecule.Acknowledgements
The authors wish to acknowledge the financial support from the Department of Science & Technology (DST), Government of India, under the Grant SR/SO/BB-35/2004, and the infrastructural support from SASTRA University.References
- S. B. Lotito, W. J. Zhang, C. S. Yang, A. Crozier and B. Frei, Free Radical Biol. Med., 2011, 51, 454–463 CrossRef CAS.
- S. Sreelatha, P. R. Padma and M. Umadevi, Food Chem. Toxicol., 2009, 47, 702–708 CrossRef CAS.
- S. D. Quine and P. S. Raghu, Pharmacol. Reports., 2005, 57, 610–615 CAS.
- N. L. Gowri Shankar, R. Manavalan, D. Venkappayya and C. David Raj, Food Chem. Toxicol., 2008, 46, 3182–3185 CrossRef CAS.
- S. Selvaraj, S. Krishnaswamy, V. Devashya, S. Sethuraman and U. M. Krishnan, Langmuir, 2011, 27, 13374–13382 CrossRef CAS.
- P. I. Oteiza, A. G. Erlejman, S. V. Verstraeten, C. L. Keen and C. G. Fraga, Clin. Dev. Immunol., 2005, 12, 19–25 CrossRef CAS.
- D. Gholamreza, E. N. D. Jafar, J. Abolghasem, A. Z. Karim, M. A. Seyed and K. Soheila, DNA Cell Biol., 2011, 30, 195–201 CrossRef.
- G. Michels, W. Watjen, P. Niering, B. Steffan, Q. H. Tran Thi, Y. Chovolou, A. Kampkotter, A. Bast, P. Proksch and R. Kahl, Toxicology, 2005, 206, 337–348 CrossRef CAS.
- T. Syed and A. S. Hussain, Eur. J. Chem., 2011, 2, 109–112 CrossRef.
- S. Sreelatha, P. R. Padma and E. Umasankari, J. Ethnopharmacol., 2011, 134, 984–987 CrossRef CAS.
- B. L. Santos, A. R. Silva, B. P. S. Pitanga, C. S. Sousa, M. S. Grangeiro, B. O. Fragomeni, P. L. C. Coelho, M. N. Oliveira, N. J. Menezes-Filho, M. F. D. Costa, R. S. El-Bacha, E. S. Velozo, G. P. Sampaio, S. M. Freire, M. Tardy and S. L. Costa, Food Chem., 2011, 127, 404–411 CrossRef CAS.
- J. G. Ryszard, K. Ryszard, R. Jadwiga and S. Jozef, Biochem. Pharmacol., 1987, 36, 317–322 CrossRef.
- L. Tair, D. W. Michael and K. Joseph, J. Agric. Food Chem., 2002, 50, 7220–7225 CrossRef.
- B. Igor, I. D. Anatolii, V. B. Aleksander, A. K. Vladimir and I. P. Alla, Biochem. Pharmacol., 1989, 38, 1763–1769 CrossRef.
- Li. Yong, Y. Zheng-Yin and Li. Tian-rong, Chem. Pharm. Bull., 2008, 56, 1528–1534 CrossRef.
- Li. Yong, Y. Zheng-Yin and W. Ming-Fang, Eur. J. Med. Chem., 2009, 44, 4585–4595 CrossRef.
- W. Bao-dui, Y. Zheng-Yin and Li. Tian-rong, Bioorg. Med. Chem., 2006, 14, 6012–6021 CrossRef.
- M. Badea, R. Olar, D. Marinescu, V. Uivarosi, V. Aldea and T. O. Nicolescu, J. Therm. Anal. Calorim., 2010, 99, 823–827 CrossRef CAS.
- K. J. Naveed, S. Asima, Y. Azra, S. Sana, Q. Rumana and H. Sayed, Spectrochim. Acta, Part A, 2009, 74, 1135–1137 CrossRef.
- U. Ulku, A. Sevtap, B. Ahmet and B. Nuren, Toxicol. Lett., 2004, 151, 143–149 CrossRef.
- A. A. Sharon and M. N. O'Brien, Free Radical Biol. Med., 2000, 29, 507–514 CrossRef.
- R. P. Webster, M. D. Gawde and R. K. Bhattacharya, Cancer Lett., 1996, 109, 185–191 CrossRef CAS.
- S. A. Aherne and N. M. O'Brien, Nutr. Cancer, 1999, 34, 160–166 CrossRef CAS.
- D. J. Catanese, J. M. Fogg, D. E. Schrock, B. E. Gilbert and L. Zechiedrich, Gene Therapy, 2011, 1–7 Search PubMed.
| This journal is © The Royal Society of Chemistry 2012 |