Microstructure and magnetic properties of a novel 10-H hexagonal perovskite nanosheet in a Bi–Fe–Cr–O system
Jian
Zhou
a,
Zhenlin
Luo
b,
Y. B.
Chen
c,
Shan-Tao
Zhang
a,
Zhen-Bin
Gu
a,
Shuhua
Yao
a and
Yan-Feng
Chen
*a
aNational Laboratory of Solid State Microstructures and Department of Material Science and Engineering, Nanjing University, Nanjing 210093, P. R. China. E-mail: yfchen@nju.edu.cn
bNational Synchrotron Radiation Laboratory, University of Science and Technology of China, Hefei, 230029, P. R. China
cDepartment of Physics and National Laboratory of Solid State Microstructures, Nanjing University, Nanjing, 210093, P. R. China
First published on 18th May 2012
Abstract
A novel 10-H hexagonal Bi(FeCr)O3 (BFCO) perovskite nanosheet is synthesized by pulsed-laser ablation. Transmission electron microscopy (TEM) studies prove that the crystal structure of this phase is hexagonal-type with a P63/mmc space group. The atomic stacking sequence, revealed by high-resolution TEM, can be described as hhhcchhhcc in h–c notation. The magnetic properties of 10-H hexagonal BFCO perovskites are studied by both magnetic hysteresis loop measurements and first-principles calculations. The net magnetization of 10-H hexagonal BFCO comes from the anti-parallel spin moment of the Fe3+ and Cr3+ cations. The stability of the novel 10-H BFCO is also discussed by calculating its Goldschmidt factor and formation enthalpy. This work demonstrates the structural diversity in the Bi–Fe–Cr–O system, which may open the feasibility to explore the multi-functionality of this system.
I. Introduction
Multiferroics are materials which possess more than one ferroic ordering, i.e. ferromagnetism, ferroelectricity, ferroelasticity and ferrotoroidicity,1–5 and exhibit couplings between them. In general, these four ferroic orderings can be expanded to more orders, such as antiferromagnetism (AFM) and ferrimagnetism. In particular, ferromagnetic and ferroelectric coupled materials are mostly studied due to their potential applications in electric/magnetic field controlled random memory devices, as well as plentiful fundamental physics problems related to coupling between electric and magnetic orderings. Thus far, exploration of multiferroic materials working at room temperature has mainly focused on single phase BiFeO3.6,7 Though its spontaneous electric polarization is as large as 70 μC cm−2, BiFeO3 has a long-range spiral spin structure and its net magnetization is quite weak (0.05 μB Fe−1) at room temperature. This makes it unfeasible in real device applications based on BiFeO3 materials. Up to now, there are mainly two strategies to improve the magnetic properties of BiFeO3.Firstly, atomically doping (transition-metal element) or atomically designed crystal structure are proposed to improve magnetism in BiFeO3. For example, Spaldin et al. proposed a study of the double perovskite Bi2FeCrO6 (50% Cr doping) in order to find large room-temperature magnetization by first-principles calculations.8,9 The basic idea is that the 180° superexchange interaction in Fe3+–O2−–Cr3+ favors the ferromagnetic order. This mechanism has been realized in LaCrO3–LaFeO3 superlattices by Ueda et al.10 However, due to the oxygen octahedra rotation, the Fe3+–O2−–Cr3+ bond angle deviates from the perfect 180° in ideal ferromagnetic Bi2FeCrO6, which leads to an AFM coupling between Fe3+ and Cr3+. The net magnetization is 2 μB formula cell−1 (f.u.) in ordered Bi2FeCrO6 theoretically, which is still much larger than pure BiFeO3. Guided by this prediction, many experiments have been done in this system.11–17 This work demonstrates that the measured magnetization is strongly dependent on the ordering degree of Fe and Cr cations in synthesized samples. When the Fe and Cr cations are alternately arranged, the saturation magnetization of double perovskite Bi2FeCrO6 films can reach 1.91 μB f.u.−1 On the contrary, magnetization is as small as pure BiFeO3 in the case of disordered one.
A secondary strategy is to synthesize nano-structured BiFeO3 or related compounds to improve their magnetic properties. For example, Pignolet et al. recently found an unexpectedly large value of 5.2 μB f.u.−1 in Bi2FeCrO6 nanostructures.18 Though the underlying physical origin is not clear, the significant enhanced magnetic property is related to the intentionally engineered nanostructure in Bi2FeCrO6. It is also worthwhile to mention that BiFeO3 can show a wide variety of nanostructures in experiments. This nanostructured (nanotube, nano-junctions and nanorod) BiFeO3 demonstrates dramatically enhanced physical and chemical properties.19–24
Bearing in mind the enhanced magnetic properties in BFCO and the diverse nanometer-scaled morphology of BiFeO3 and its compounds, we have synthesized a novel BFCO nanosheet by pulse-laser ablation. Their structural and physical properties were carefully studied by both experiments and theories. Instead of the ordered double perovskite structure, we observe a novel 10-H hexagonal BFCO perovskite structure in this system. The detailed microstructures of this novel phase, as well as their magnetic properties are discussed in the following content of this paper. The underlying physical origin of the magnetic properties in 10-H BFCO is also elucidated by first-principles calculations.
The rest of this paper is organized as follows. In Sec. II and III, the experimental methods and results are described. In Sec. IV and V, the first-principles calculation details and results are presented. A conclusion is given in Sec. VI. at the end of this paper.
II. Experimental methods
The BFCO thin films were synthesized by pulsed laser ablation on single crystalline SrTiO3 substrates using the 4th harmonic YAG–Nb laser at a wavelength of 266 nm and a pulse width of 5 ns. To optimize the deposition conditions, the substrate temperature and oxygen pressure were varied in the range of 650–750 °C and 1–10 Pa, respectively, and we used the condition of 730 °C and 10 Pa in this sample in this paper. The laser energy and pulse repetition are 40 mJ shot−1 (an energy density of 1 J cm−2) and 10 Hz. After each deposition, the film is cooled down to 500 °C at a speed of 10 °C min−1 in 0.5 atm oxygen and held at this temperature for 1 h to eliminate the oxygen vacancies. It should be mentioned that the reproducibility of 10-H BFCO is quite good under these growth conditions.The target has a nominated Bi1.2Fe0.5Cr0.5O3 composition. The thin films were characterized by transmission electron microscopy (TEM). The TEM specimens were prepared by grinding, dimpling and finally by ion-milling. The details of TEM sample preparation have been reported previously.25 The TEM characterizations were conducted using both a JOEL3011 high resolution TEM, as well as a Tecnai F20 analytical TEM equipped with both an energy dispersive spectroscopy (EDS) detector and a high-angle annular dark-field detector. The point-to-point resolution in JEOL 3011 was 0.17 nm. During the scanning transmission electron microcopy observation, the electron probe was set at 0.5 nm. The images were processed by Digitalmicrograph and Photoshop software. The electron diffraction simulation was conducted by eMap software.26 The magnetic measurements were carried out using a superconducting quantum interference device magnetometer (SQUID, Quantum Design Inc., Model MPMS XL-7).
III. Experimental results
A. Geometric structure of 10-H hexagonal BFCO
Fig. 1 (a) is the typical atomic force microscopy top-view image of the synthesized BFCO. One can see that BFCO shows a nanosheet structure. Fig. 1(b) shows a typical low magnification cross-sectional TEM micrograph of our BFCO thin film grown on (001) SrTiO3 substrate. It is also clear that the BFCO shows sheet structures. The typical dimensions for these sheets are 100 nm × 30 nm × 140 nm. Detailed electron diffraction patterns were taken to decide the orientation of each sheet. The c-axes of the three sheets are indicated in Fig. 1 as well. The inhomogeneous growth of these sheets has been observed in many systems, such as whiskers in oxidation of iron metal under a relatively high oxygen environment.27 It is generally attributed to crystal growth under conditions far from equilibrium, which is not uncommon in pulsed laser deposition.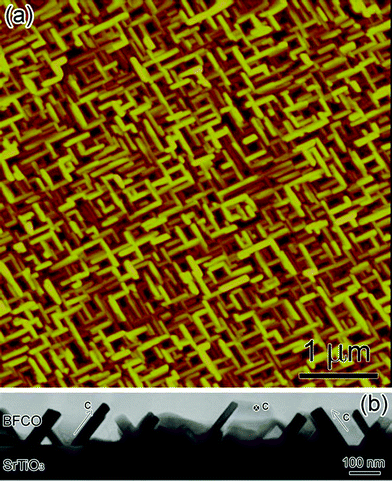 | ||
| Fig. 1 (Color online) (a) Typical atomic force microscopy image of the 10-H hexagonal BFCO nanosheet structure (top view). (b) The low magnification cross-sectional TEM micrograph of 10-H hexagonal BFCO thin films grown on (001) SrTiO3 substrates. | ||
The crystal structure of our BFCO block is exploited by tilting electron diffraction. Fig. 2(a)–(c) show the experimental electron diffraction patterns taken from BFCO sheets. These patterns can be indexed as [001], [100] and [210] zone axis by assuming the BFCO has a 10-H perovskite structure and a space group P63/mmc. The tilting angle between Fig. 2(a) and 2(b) is about 30.5°, which is consistent with crystallographic relationships in this structure.28 The simulated patterns (not shown here) are in good agreement with the experimental ones. The lattice constants of the 10-H hexagonal BFCO perovskite were determined as a = 0.517 nm and c = 2.47 nm with the electron diffraction pattern of single crystalline Si as an internal standard. Similar 10-H hexagonal perovskites have also been observed in BaRuO3,29 BaFe0.6Mn0.4O2.73,30 and Cs(Ni0.75Cd0.25)O331 systems.
![The selective area electron diffraction patterns of [210] (a), [100] (b) and [001] (c) zone axis of 10-H hexagonal BFCO perovskite thin films. Some weak spots in (b) are due to twinning.](/image/article/2012/RA/c2ra01158a/c2ra01158a-f2.gif) | ||
| Fig. 2 The selective area electron diffraction patterns of [210] (a), [100] (b) and [001] (c) zone axis of 10-H hexagonal BFCO perovskite thin films. Some weak spots in (b) are due to twinning. | ||
EDS under STEM mode was employed to study the compositions in our novel 10-H BFCO perovskite. The high angle annular dark field image is illustrated in Fig. 3 (a). One can see that the contrast of every BFCO sheet in Fig. 3(a) is quite uniform. Certainly, if BFCO sheets lie in different directions, the contrast is different because of the different thicknesses along the electron beam direction. As shown in Fig. 3(a), the BFCO sheet shows the weakest contrast if the c-axis of the sheet is parallel to the electron beam. Therefore it can be concluded that the compositional distribution in each BFCO sheet is quite uniform,32 which is different from previous reports. The non-uniform elemental distribution is observed in Bi2FeCrO6 double perovskite thin films.12Fig. 3(b), (c) and (d) show the EDS mappings of Cr, O and Fe in two BFCO sheets. The k-peaks of Fe, Cr and O are used to collect the mapping images. It can be seen that the distribution of Fe and Cr is also homogeneous in BFCO blocks, which is in agreement with the high-angle annular dark-field image shown in Fig. 3(a). One typical EDS spectrum is illustrated in Fig. 3(e). The characteristic peaks due to Bi, Fe, Cr and O are labeled in this spectrum. By means of stoichiometric BiFeO3 as an internal standard, the atomic percentage of Bi, Fe, Cr and O can be measured as 23%, 11.2%, 8.8% and 57%, respectively. The average deviation of each element concentration is around 5% by averaging over the EDS spectra taken from 30 different places. It thus can be concluded that the chemical formula of this novel BFCO can be written as Bi(Fe0.56Cr0.44)O3−δ. The oxygen concentration can not be measured accurately by EDS because of the detector absorption.32
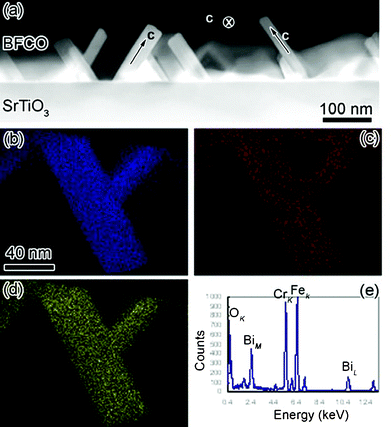 | ||
| Fig. 3 (Color online) (a) The low magnification high angle annular dark field micrograph of 10-H hexagonal BFCO thin films, (b), (c) and (d) are the elemental Cr, O and Fe mappings by EDS under STEM mode, respectively. (e) Is the typical EDS spectrum of BFCO thin films. The major peaks of Bi, Fe, Cr and O were labeled. | ||
The crystal structure of perovskite ABO3 (A, B, O represent A-site, B-site cations and anionic oxygen, respectively) can be viewed as three-dimensional stacking of AO3 and B layers.28,33 For example, cubic perovskites can be built as the face-centered cubic stacking of AO3 layers and insertion of the B layer in each of the neighboring AO3 layers. This stacking sequence can be written, in h–c notation used by Pauling34 and Wyckoff,35 as ccc, where c represents the layer where its above and bottom neighboring layers are geometrically different. In comparison, the layer is labeled as h if the layers above and below are the geometrically the same. For example, a hexagonal close-packed perovskite can be written as hhh in h–c notation. High-resolution TEM (HRTEM) is employed to reveal the atomic stacking sequence in the 10-H hexagonal BFCO perovskite. One typical HRTEM micrograph is shown in Fig. 4(a). This micrograph was taken with the electron beam aligned along the [210] zone axis of 10-H hexagonal BFCO. The stacking sequence of the BiO3 layer, revealed by Fig. 4(a), can be written as hhhcchhhcc labeled by h–c notation. Actually, this stacking configuration is one of three possible patterns limited by the space group P63/mmc.28 The Cr and Fe layers are inserted between neighboring BiO3 layers. They, unfortunately, can not be observed due to resolution limit of the JEOL3011 microscope. The in-plane atomic structure of the novel 10-H hexagonal BFCO is shown in Fig. 4(b). As shown in Fig. 4(b), there is no structural and compositional modulation in the a–b plane. The d-spacing along [210] direction is measured as 0.42 nm, which is in agreement with the electron diffraction results.
![(a) The HRTEM image of BFCO thin films showing the characteristic stacking sequence in the 10-H hexagonal BFCO perovskite. (b) The HRTEM image of BFCO with the electron beam aligned along the [001] zone axis.](/image/article/2012/RA/c2ra01158a/c2ra01158a-f4.gif) | ||
| Fig. 4 (a) The HRTEM image of BFCO thin films showing the characteristic stacking sequence in the 10-H hexagonal BFCO perovskite. (b) The HRTEM image of BFCO with the electron beam aligned along the [001] zone axis. | ||
B. Magnetic properties of 10-H hexagonal BFCO
The magnetic properties of the 10-H BFCO perovskite were evaluated by SQUID. Fig. 5 shows the magnetization loops of a ∼130 nm thick BFCO film measured at 300 K and 10 K with a magnetic filed along the film plane. The saturation magnetization, remnant magnetization and coercive field of the sample at 10 K are measured to be ∼50 emu cm3, ∼36 emu cm3 and ∼ 8 kOe, respectively, while they are ∼16 emu cm3, ∼8 emu cm3 and ∼5 kOe for the sample at 300 K. Due to the sheet structure of our sample, we estimate that the occupation proportion p of the BFCO sheet is between 0.4 to 0.6.36 In other words, our sample's saturated magnetization is pM = 50 emu cm3 at 10 K, which gives the actual saturated magnetization of BFCO M = 83–125 emu cm3. Then we can easily find the magnetic moment is equal to 1.2–1.8 μB f.u.−1 Because of the limitation of our TEM facility, the atomic arrangement of Fe/Cr can not be resolved in our experiment at present. The origin of the magnetic properties in 10-H BFCO will be elucidated by first-principles calculation described as follows.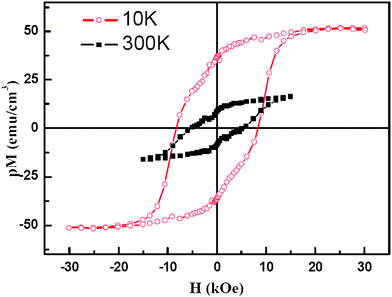 | ||
| Fig. 5 (Color online) Typical magnetic hysteresis loops of BFCO film composed by nano crystal sheets at both 300 K and 10 K with a magnetic field applied parallel to the substrate surface. p Stands for the film's occupation proportion, which was evaluated to be about 0.4–0.6 for the measured film. | ||
IV. First-principles methods
The geometric and electronic properties of 10-H hexagonal BFCO system were calculated by density functional theory (DFT) in the generalized gradient approximation implemented in the Vienna ab initio Simulation Package (VASP),37,38 in which the projected augmented wave method39,40 and Perdew–Burke–Ernzerhof exchange correlation are used.41The plane-wave cutoff energy is 520 eV throughout the calculation. The O 2s22p4, Fe 3p63d64s2, Cr 3p63d54s1 and Bi 5d106s26p3 electrons are treated as valence electrons. The Brillouin zone integrations were performed with a 7 × 7 × 1 Γ-center k-point mesh and the Gaussian smearing width is 0.05 eV. The lattice constants and all the atomic positions were relaxed by using the conjugate-gradient algorithm until the residual forces of all atoms were less than 0.01 eV Å−1 . The GGA+U method with the approach described by Dudarev et al.42 is used for the Fe and Cr atoms. The effective U values are UeffFe = 4.5 eV and UeffCr = 2.5 eV in our calculation, and the effect of the different U values is also discussed in our calculation.
V. First-principles results
A. Geometric structure of imaginary 10-H hexagonal BiFeO3 and BiCrO3
In accordance with the aforementioned experimental results, it can be concluded that the chemical formula of our novel 10-H hexagonal BFCO can be written as Bi(Fe0.56Cr0.44)O3−δ. The lattice constants are a = 5.17 Å and c = 24.7 Å and the space group is P63/mmc. As a theoretical study, we began from the simplified model imaginary 10-H hexagonal BiFeO3 and BiCrO3, in contrast to the real system Bi(Fe0.56Cr0.44)O3−δ. Then, the problem of Cr-doped BiFeO3, i.e. BFCO was explored.The initial geometric structure was set as the 10-H hexagonal structure of Ba5Sn1.1Mn3.9O15, whose stacking sequence is also hhhcchhhcc.43 Then the fully geometric optimizations (both the atomic positions and lattice constants) were performed. The optimized structures are thought to be the theoretical structure of the 10-H hexagonal structure of BiFeO3 and BiCrO3. The unit cell of the 10-H hexagonal structure is shown in Fig. 6, and the optimized lattice constants and atomic positions are summarized in Table 1.
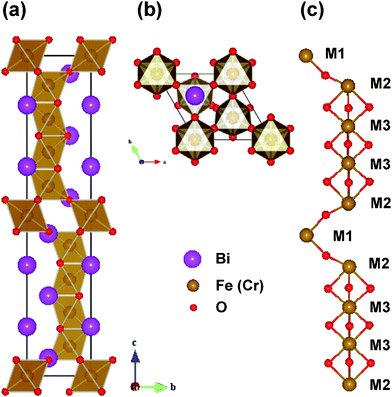 | ||
| Fig. 6 (Color online) The 10-H hexagonal structure of BFCO system. (a) Side view of the unit cell, (b) top view of the unit cell, and (c) schematic representations of the positions of Fe or Cr atoms. The M1, M2 and M3 represent different Wyckoff positions of the Fe or Cr site.44 | ||
| 10-H BiFeO3 | 10-H BiCrO3 | |
|---|---|---|
| a (Å) | 5.663 | 5.604 |
| c (Å) | 23.988 | 23.872 |
| Bi1 | 0, 0, 0.369 | 0, 0, 0.370 |
| Bi2 | 2/3, 1/3, 0.25 | 2/3, 1/3, 0.25 |
| Bi3 | 2/3, 1/3, 0.416 | 2/3, 1/3, 0.420 |
| Fe1 (Cr1) | 0, 0, 0.5 | 0, 0, 0.5 |
| Fe2 (Cr2) | 1/3, 2/3, 0.414 | 1/3, 2/3, 0.408 |
| Fe3 (Cr3) | 1/3, 2/3, 0.301 | 1/3, 2/3, 0.301 |
| O1 | 0.175, 0.825, 0.25 | 0.177, 0.822, 0.25 |
| O2 | 0.153, 0.307, 0.444 | 0.154, 0.308, 0.445 |
| O3 | 0.500, 0.001, 0.354 | 0.500, 0.000, 0.355 |
The 10-H hexagonal structure of BiFeO3 or BiCrO3 has 10 formula cells in one unit cell (in total 50 atoms), and there are three non-equivalent Fe (or Cr) positions, which are marked as M1, M2, and M3, shown in Fig. 6. The M1O6 and M2O6 octahedra are corner-sharing just like those in a simple cubic perovskite. However, the connection between the M2O6 and M3O6 octahedra, as well as the connection between the two M3O6 octahedra, are face-sharing. As shown in Fig. 6(c), we clearly show the skeleton of the FeO6 (or CrO3) octahedra, i.e. the Fe (or Cr) atoms at M1 and M2 sites are connected by one oxygen atom, and the Fe (or Cr) atoms at M2 and M3 sites, as well as the two neighboring M3 sites, which are connected by three oxygen atoms.
As shown in Table 1, it can be seen that the calculated lattice constants of 10-H hexagonal BiFeO3 are a = 5.663 Å and c = 23.988 Å. They are larger than those in 10-H BiCrO3, which are about 5.604 Å and 23.872 Å respectively. It is reasonable to obtain smaller lattice constants in 10-H hexagonal BiCrO3 than those in 10-H hexagonal BiFeO3, since Cr3+ has a smaller ionic radius than that of Fe3+.49 According to the chemical formula BiFe0.56Cr0.44O3−δ in our sample, the real lattice constants should be between the ones of 10-H hexagonal BiFeO3 and BiCrO3. However, we find that the experimental lattice constants are either too small or too large. The error between the calculation and experiment is 2–10%, which is not small, but roughly correct. We think that there are three reasons for the discrepancy. Firstly, the strain to thin film constrained by substrates and the oxygen vacancies affect the lattice constants. Secondly, the TEM determined lattice constants generally have an error of about 5%. Finally the DFT calculations also have some errors in predicting the lattice constants (usually 1% or more). In particular, Coulomb interaction (finite on-site U value) has also some effects on lattice constants. In our calculation, the lattice constant a is changed from 5.662 Å to 5.656 Å , c from 23.751 Å to 24.131 Å when the U of Fe is changed from 2 eV to 7 eV in 10-H hexagonal BiFeO3. Similarly the lattice constant a is changed from 5.598 Å to 5.646 Å , c from 23.788 Å to 24.390 Å when the U of Cr is changed from 2 eV to 7 eV in 10-H hexagonal BiCrO3. Therefore, we believe that the optimized lattice constants are still reasonable and correct for the 10-H hexagonal BiFeO3 and BiCrO3.
B. Magnetic structure of imaginary 10-H BiFeO3 and BiCrO3
With the optimized geometric structures, it is more interesting to investigate the electronic and magnetic properties of imaginary 10-H hexagonal BiFeO3 and BiCrO3. It is well known that the normal R3c bulk BiFeO3 has a long-wavelength spiral spin structure, and the magnetic moments should be noncollinear. This structure can be well approximated as a G-type AFM in DFT calculations, which have been used by other works.8,9 In order to find the possible ground state of 10-H hexagonal BiFeO3 and BiCrO3, we have tried some possible collinear configurations and compared the total energy after optimization.There are 10 Fe (or Cr) atoms in the unit cell of 10-H hexagonal BiFeO3 (or BiCrO3), and it seems that the number of spin configurationa should be very large even in the collinear case. However, according to the geometric structure of 10-H hexagonal BiFeO3, there are three non-equivalent Fe (or Cr) atoms (see Fig. 6(c)). The FeO6 (or CrO6) octahedra can be viewed as a quasi one-dimensional chain. Therefore, we only need to study three possible couplings, i.e. the one between the M1 and M2 atoms, the one between M2 and M3 atoms, and the one between the M3 and M3 atoms. The couplings between M1 and M1, M2 and M2, M1 and M3 are not considered since none of them is connected directly. We therefore construct three different spin configurations: 12-AFM, 23-AFM, and 33-AFM, as well as a reference one: a ferromagnetic (FM) configuration. The schematic of these configurations are shown in Fig. 7(a),(b) and (c). After the structural optimization, the total energies of all these four configurations are given in Table 2 and 3.
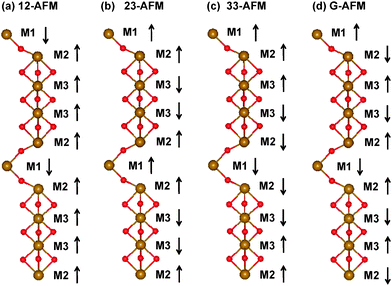 | ||
| Fig. 7 (Color online) Spin configurations of 10-H hexagonal BiFeO3 calculated in this work: (a) 12-AFM, (b) 23-AFM, (c) 33-AFM, and (d) G-AFM. The FM configuration is not necessary to be not shown. ↑ and ↓ represent the spin up and down respectively. | ||
| Configuration | Spin configuration | E (eV) | M (μB) |
|---|---|---|---|
| FM | ↑↑↑↑↑↑↑↑↑↑ | 0 | 50 |
| 12-AFM | ↓↑↑↑↑↓↑↑↑↑ | −1.158 | 30 |
| 23-AFM | ↑↑↓↓↑↑↑↓↓↑ | −0.076 | 10 |
| 33-AFM | ↑↑↑↓↓↓↓↓↑↑ | −0.156 | 0 |
| G-AFM | ↑↓↑↓↑↓↑↓↑↓ | −1.289 | 0 |
 and
and  represent spin up and down moment of Cr respectively
| Configuration | Spin configuration | E (eV) | M (μB) |
|---|---|---|---|
| FM |

|
0 | 30 |
| 12-AFM |

|
−0.0636 | 18 |
| 23-AFM |

|
−0.464 | 6 |
| 33-AFM |

|
−0.244 | 0 |
| G-AFM |

|
−0.757 | 0 |
For imaginary 10-H hexagonal BiFeO3, it is obvious from Table 1 that all AFM configurations have lower energies than that of the FM one. It means that all the couplings (M1–M2, M2–M2, and M3–M3) should be AFM. Since every coupling is AFM individually in our calculation, it is natural to think that if all the interfaces are set to be AFM (G-type like AFM, shown in Fig. 7(d)), the energy gain should be maximal. Our calculation confirms that the G-type AFM configuration has the lowest total energy, which is −1.289 eV using the FM case as the zero-energy. The same AFM configuration is also found in the 2H and 4H hexagonal AMnO3 perovskites (A = Ca, Sr, and Ba).45,46
By using the Bader charge analysis,47 the local magnetic moments of the Fe atoms are 4.1 ∼ 4.2 μB; and of course, in the G-type like AFM configuration the net magnetic moment in the unit cell of imaginary 10-H hexagonal BiFeO3 is exactly 0, as shown in Table 2.
The same calculations are conducted for the imaginary 10-H hexagonal BiCrO3 system, except that we use a smaller U = 2.5 eV for the Cr atom. The properties of imaginary 10-H hexagonal BiCrO3 are found to be quite similar to those of BiFeO3 described above. In imaginary 10-H BiCrO3, all the AFM configurations have a lower energy than the FM one. The G-type AFM is the lowest one, which is −0.757 eV with respect to the FM one. The Bader charge analysis47 shows that in the G-AFM configuration, the local magnetic moment of Cr is 2.7–2.8 μB.
The band structures of 10-H hexagonal BiFeO3 and BiCrO3 with the G-type AFM magnetic order are calculated by the GGA+U method, shown in Fig. 8. The bands of spin up and spin down electron are exactly same due to their AFM properties and it is clearly seen that both of them are semiconductors. The band gaps are the almost same; 1.18 eV for 10-H hexagonal BiFeO3 and 1.22 eV for 10-H hexagonal BiCrO3. However, the 10-H hexagonal BiFeO3 is a direct band gap semiconductor, while the 10-H hexagonal BiCrO3 is an indirect band gap semiconductor.
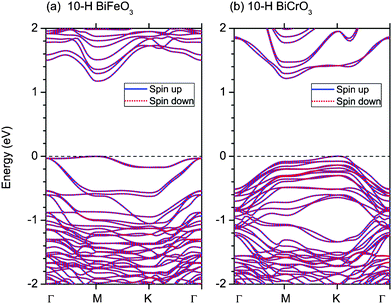 | ||
| Fig. 8 (Color online) Band structures of 10-H hexagonal BiFeO3 and BiCrO3 with the G-type AFM magnetic order. The straight dashed lines indicate the Fermi energy. Γ, M, and K represent the k-points of (0,0,0), (1/2,0,0), and (1/3,1/3,0) in the Brillouin zone. | ||
C. Magnetic structure of Cr doped 10-H BiFeO3
In the calculation, the 10-H BiFeO3 is first set to be G-type AFM. When one Cr atom replaces one of the Fe atoms (M1, M2 or M3), the spin moment of Cr can be parallel or anti-parallel to its nearest neighbors (Fe atom). Therefore, for each doped position, we can get two different magnetic orders, which have different energies. In order to get the relative total energy, we define the binding energy per f.u. of BiFexCr1−xO3 as:
| Eb = EBFCO − [xEBFO + (1 − x)EBCD], |
where EBFCO, EBFO and EBCD are the total energies of 10-H hexagonal BiFexCr1−xO3, 10-H BiFeO3, and 10-H BiCrO3 per f.u. x is now equal to 0.9 since only one Cr atom is doped in one unit cell. The calculated binding energies are shown in Table 4. At the M1 site, the parallel spin configuration between Cr and its nearest Fe atom has a little lower energy than that of the anti-parallel one. However, their binding energies are both positive, which implies that Cr maybe prefer to occupy another site, rather than the M1 site. For the M2 and M3 sites, the binding energy of anti-parallel configuration is always lower than that the parallel one, and more importantly they are both negative. It means the Cr may favor the M2 or M3 site, and at the same time, it has an AFM coupling with its nearest neighbors.
 and
and  represent the Cr spin. The consequence of spin configuration is from top to down in Fig. 6c, i.e. M1M2M3M3M2M1M2M3M3M2
| Cr-site | Spin configuration | E b (eV) |
|---|---|---|
| M1 |

|
0.146 |

|
0.157 | |
| M2 |

|
−0.096 |

|
−0.182 | |
| M3 |

|
0.300 |

|
−0.550 |
Therefore, we can conclude that the M1, M2, and M3 sites in 10-H hexagonal BiFeO3 is not the same from both a geometric point of view and an energetic one. Therefore, even with 50% Cr atoms doped in the 10-H BiFeO3, it is difficult to form an alternative distribution of Fe and Cr atoms, while the theoretical prediction of 2 μB f.u.−1 is based on such a perfect regular distribution. This is one of the reasons why we observe a smaller net magnetic moment in the experiment.
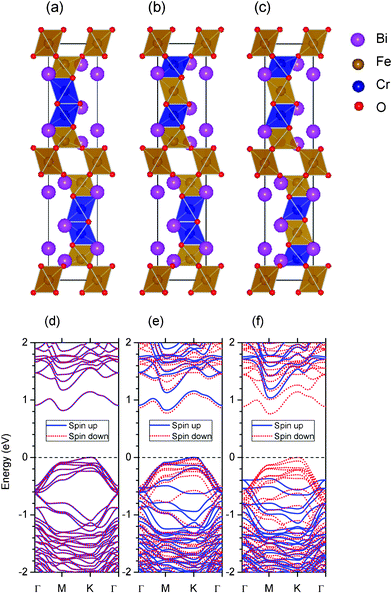 | ||
| Fig. 9 (Color online) (a), (b) and (c): Three different geometric structures of four Cr atoms doped 10-H structure: BiFe0.6Cr0.4O3. Their net magnetic moments are 0, 4 and 8 μB for structures (a), (b), and (c) respectively. The brown and blue color represent the Fe and Cr octahedron respectively. (d), (e), and (f): Their corresponding spin polarized band structures. Blue solid line and red dotted line represent spin up and down bands. The Fermi energy is 0. | ||
In the first structure, shown in Fig. 9(a), we assume that four Cr atoms replace four M3 Fe atoms. In order to determine the magnetic order, we use the same method as before. There are three types of magnetic couplings: M1–M1, M1–M2, and M3–M3. The corresponding total energies are given in Table 5. It is clear that for all of the three couplings (i.e. 12-AFM, 23-AFM, and 33-AFM) prefer AFM orders, which is similar to the cases of imaginary 10-H BiFeO3 and BiCrO3. Then we believe that the ground magnetic configuration in BiFe0.6Cr0.4O3 is also G-type AFM, with zero net magnetic moment. The total energy in the G-type AFM configuration is about −1.652 eV per unit cell with respect to the FM one. The band structure of spin up and down are also exactly the same due to its AFM property, shown in Fig. 9(d). The band gap of this structure is about 0.819 eV, which is smaller than that of imaginary 10-H BiFeO3.
 and
and  represent the Cr spin. The consequence of spin arrangement is from top to down in Fig. 6c, i.e. M1M2M3M3M2M1M2M3M3M2
| Configuration | Spin arrangement | E (eV) | M (μB) |
|---|---|---|---|
| FM |

|
0 | 40 |
| 12-AFM |

|
−1.091 | 22 |
| 23-AFM |

|
−0.582 | 18 |
| 33-AFM |

|
−0.235 | 0 |
| G-AFM |

|
−1.652 | 0 |
However, the zero net magnetic moment seems can not explain our experiment results. We think the main reason comes from the unknown distribution of Fe and Cr atoms. In the above calculation, we assume that all the Cr atoms are at M3 sites. However, if Cr atoms can occupy another site, then we will get many different magnetic structures, although their chemical formulas are still Bi(Fe0.6Cr0.4)O3. Here, as an example, we present two other structures, shown in Fig. 9(b) and (c). In Fig. 9(b), one Cr atom is at M2 site, and three other Cr atoms are at M3 sites. While in Fig. 9(c), two Cr atoms are at M2 sites and the other two Cr atoms are at M3 sites. In these two structures, we assume that all the couplings between the nearest neighbors are AFM. Then the magnetic configurations in Fig. 9(b) and (c) are  (net magnetic moment is 4 μB) and
  (net magnetic moment is 8 μB) respectively. Our first-principles calculations confirm that the two configurations have a net magnetic moment of 4 and 8 μB respectively (i.e. 0.8 and 1.6 μB f.u.−1).
Moreover, it is very interesting to find that these two structures in Fig. 9(b) and (c) are still semiconductors with net magnetic moments. Their electron band structures are shown in Fig. 9(e) and (f) respectively. The band gaps are almost same as the one in Fig. 9(a). More importantly, we find that their bands near the Fermi energy are totally spin polarized, especially in Fig. 9(f). If we shift the Fermi energy by doping some electrons or holes, it is highly possible to get half metallicity in the 10-H BFCO system.
 (2 μB),
  (6 μB), and
  (10 μB) respectively. In other words, their net magnetism is 0.4, 1.2 and 2 μB f.u.−1 respectively. Our first-principles calculations also confirm these results. It should be noted that the structure in Fig. 10(c) has the perfect alternative distribution of Fe and Cr atoms, which has a maximal net magnetic moment 2 μB f.u.−1.
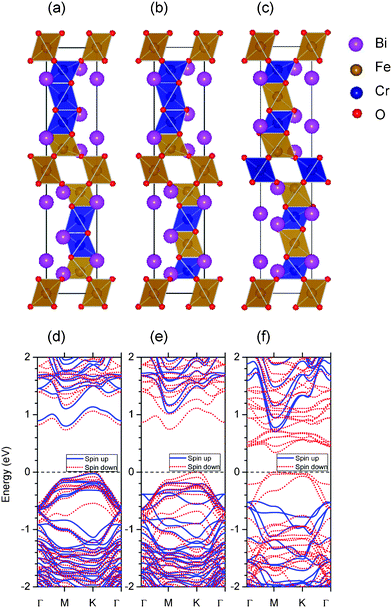 | ||
| Fig. 10 (Color online) Same as Fig. 9, but for five Cr atom doped structure: BiFe0.5Cr0.5O3. Their net magnetic moments are 2, 6 and 10 μB for structures (a), (b), and (c) respectively. | ||
Just like BiFe0.6Cr0.4O3, we also find that all the three BiFe0.5Cr0.5O3 structures are semiconductors with a net magnetic moment. The band gaps of structures shown in Fig. 10(a) and (b) are also similar to the ones of BiFe0.6Cr0.4O3. But the structure of Fig. 10(c) has a very small band gap (about 0.34 eV). Thus, one can see that the half-metallicity is quite robust in BiFe0.6Cr0.4O3 and BiFe0.5Cr0.5O3. It is quite interesting to employ molecular beam epitaxy (MBE) to synthesize the ordered BFCO to confirm our theoretical predictions.
As such, we find the net magnetic moment is 1.2–1.8 μB f.u.−1 in the experiment, which is close to the case in Fig. 9(c) (1.6 μB f.u.−1) and Fig. 10(b) (1.2 μB f.u.−1). However, it is not indicated that the structure in our experiment is just the structure in Fig. 9(c) or Fig. 10(b). In fact, besides the six structures shown in Fig. 9 and 10, many other different configurations with different net magnetic moments in Cr doped 10-H BiFeO3 are still possible. Our calculations for six structures of BiFe0.6Cr0.4O3 and BiFe0.5Cr0.5O3 only confirm that the experimental magnetism value is within the range of our theoretical results. If we estimate the experimental magnetism value very roughly by averaging the magnetic moments of these six structures, we can get a value of 1.0 μB f.u.−1, which is close to the experimental one. We then conclude that both the distribution and ratio of Fe/Cr affect the magnetism remarkably and the magnetism in our sample can be thought as the average value of many possible structures. Of course, different structures should have different weights. The origin of the magnetism comes from the anti-parallel spin moment of Fe3+ and Cr3+ cations.
D. Stability and formation enthalpy
The experiment proves unambiguously the existence of a 10-H hexagonal structure in the BFCO system. The formation of different polymorph phases of ABO3 perovskite can be explained by the Goldschmidt factor, which is defined as48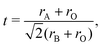 | (1) |
where ri (i = A, B, O) is the average ionic radius of A, the B-site cation and the oxygen anion, respectively. In perovskite oxides, the cubic perovskite is stable when t is equal to 1. For t > 1.0, the hexagonal close-packed perovskite structure is stable. The abstract distortion and stacking can be formed when t is within in 0.77 to 1.0.48 The Goldschmidt factor can be calculated as 0.85 by considering the ionic radius in our BFCO system.49 Therefore, in the BFCO system it is not favorable to take simple hexagonal close-packed structure and distort and abstract the stacking phase. Similar phenomena are observed in many systems, such as BaRuO3 which has a t factor of 0.96.49 Many different polymorph phases including 2-H, 6-H and 10-H phases have been reported in Ba–Ru–O.50
In order to study the stability of the 10-H hexagonal structure of the BFCO system more quantitatively, we have calculated the formation enthalpy of BiFexCr(1−x) O3. The formation enthalpy of a compound can be defined as the total energy difference of the compound and their constituent elements in their stable states. In our BFCO system, we use the following equation:
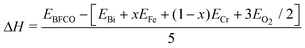 | (2) |
, where EBFCO, EBi, EFe, ECr , and  are the total energies of BiFexCr(1−x) O3, bulk rhombohedral Bi, bcc Fe, bcc Cr and O2 molecular.51 Besides the 10-H hexagonal structure, we also calculated the normal BiFeO3 and BiCrO3. The normal BiCrO3 is well known to be rhombohedral structure with R3c symmetry and its magnetic order is nearly G-type AFM.8 The normal BiCrO3 is a monoclinic structure with C2/c symmetry and its magnetic order is also G-type AFM.52,53 The same Hubbard U of Fe and Cr atoms are used in all the systems.
The formation enthalpy of several possible compounds in Bi–Fe–Cr–O systems are outlined in Table 6. It can be seen that all the formation enthalpies are negative, which means all states can possibly exist in principle. It also can be found that the total energy of the 10-H hexagonal is about 0.23 eV atom−1 higher than that of rhombohedral BiFeO3, and the total energy of 10-H hexagonal BiCrO3 is about 0.18 eV atom−1 higher than that of monoclinic BiCrO3. In other words, the 10-H structure of BFCO system is not the ground state but the metastable one. According to the formation enthalpy shown in Table 5, we expect that the imaginary 10-H hexagonal BiFeO3, BiCrO3, and the ordered BFCO systems can be synthesized in future experiments.
| Systems | ΔH |
|---|---|
| a Cr is at M3. b Structure in Fig. 9(a). c Structure in Fig. 9(b). d Structure in Fig. 9(c). e Structure in Fig. 10(a). f Structure in Fig. 10(b). g Structure in Fig. 10(c). | |
| R3c BiFeO3 | −1.902 |
| C2/c BiCrO3 | −2.201 |
| 10-H BiFeO3 | −1.672 |
| 10-H BiCrO3 | −2.020 |
| 10-H BiFe0.9Cr0.1O3a | −1.718 |
| 10-H BiFe0.6Cr0.4O3b | −1.828 |
| 10-H BiFe0.6Cr0.4O3c | −1.823 |
| 10-H BiFe0.6Cr0.4O3d | −1.819 |
| 10-H BiFe0.5Cr0.5O3e | −1.862 |
| 10-H BiFe0.5Cr0.5O3f | −1.853 |
| 10-H BiFe0.5Cr0.5O3g | −1.870 |
VI. Conclusion
A novel 10-H hexagonal Bi(Fe,Cr)O3 perovskite was synthesized on (001) SrTiO3 by pulsed-laser ablation. The TEM results prove that the crystal structure of the novel phase is 10-H hexagonal-type with a P63/mmc space group. The EDS spectrum shows that the chemical formula of the 10-H BFCO can be written as Bi(Fe0.56Cr0.44)O3−δ. The obviously opened magnetic hysteresis loop can be obtained at both 300 and 10 K. A net magnetism about 1.2–1.8 μB f.u.−1 were found from the hysteresis loop at 10 K.The first-principles calculations have optimized the geometric structure and given the theoretical lattice constants and atomic positions. We find that the G-type AFM orders are, in general, in the ground state in imaginary 10-H BiFeO3, BiCrO3 and Cr-doped 10-H BiFeO3. Six different Cr-doped BFCO structures are calculated and its net magnetic moments can be distributed from 0 to 2 μB f.u−1 due to the different Fe/Cr distribution and Fe/Cr ratio. The experimental value should be the average value of many different configurations. It is concluded that the magnetism in our sample comes from the anti-parallel spin moment of the Fe3+ and Cr3+ cations. Furthermore, the calculated band structures of these six 10-H Cr-doped BiFeO3 are all semiconductors with net magnetic moments (except for Fig. 9(a), whose net magnetic moment is exactly 0.). In some structures, the bands near the Fermi energy are totally spin polarized, which might provide a new material system in the area of spintronics.
The structural stability in this system is also discussed by Goldschmidt factor and calculated formation enthalpy. It shows that the 10-H hexagonal BFCO is a metastable state. However, due to their similar formation enthalpy with the normal BiFeO3 and BiCrO3, the 10-H hexagonal Cr-doped BiFeO3 in our experiment can still be synthesized.
Our work demonstrates that the diverse crystal structure and the nano-meter scale morphology can be stabilized in the BFCO system, which may provide more functionality based on this system.
Acknowledgements
This work is supported by the National Natural Science Foundation of China (11004094, 10974083, 11004178, 51002074, and 51032003), the Specialized Research Fund for the Doctoral Program of Higher Education (20100091120008), the State Key Program for Basic Research of China (2009CB929503), the New Century excellent talents in University (NCET-09-0451) and the Nature Science Foundation of Jiangsu Province (No. BK2009007). We also acknowledge the support for the computational resources by the High Performance Computing Center of Nanjing University.References
- H. Schmid, Ferroelectrics, 1994, 162, 317.
- W. Prellier, M. P. Singh and P. Murugavel, J. Phys.: Condens. Matter, 2005, 17, R803 CrossRef CAS.
- R. Ramesh and N. A. Spaldin, Nat. Mater., 2007, 6, 21 CrossRef CAS.
- B. B. Van Aken, J. P. Rivera, H. Schmid and M. Fiebig, Nature, 2007, 449, 702 CrossRef CAS.
- K. M. Rabe, Nature, 2007, 449, 674 Search PubMed.
- J. Wang, J. B. Neaton, H. Zheng, V. Nagarajan, S. B. ogale, B. Liu, D. Viehland, V. Vaithyanathan, D. G. Schlom, U. V. Waghmare, N. A. Spaldin, K. M. Rabe, M. Wuttig and R. Ramesh, Science, 2003, 299, 1719 CrossRef CAS.
- J. B. Neaton, C. Ederer, U. V. Waghmare, N. A. Spaldin and K. M. Rabe, Phys. Rev. B: Condens. Matter Mater. Phys., 2005, 71, 014113 CrossRef.
- P. Baettig, C. Ederer and N. A. Spaldin, Phys. Rev. B: Condens. Matter Mater. Phys., 2005, 72, 214105 Search PubMed.
- P. Baettig and N. A. Spaldin, Appl. Phys. Lett., 2005, 86, 012505 CrossRef.
- K. Ueda, H. Tabata and T. Kawai, Science, 1998, 280, 1064 CrossRef CAS.
- R. Nechache, C. Harnagea, A. Pignolet, F. Normandin, T. Veres, L. Carignan and D. Ménard, Appl. Phys. Lett., 2006, 89, 102902 Search PubMed.
- R. Nechache, L. P. Carignan, L. Gunawan, C. Harnagea, G. A. Botton, D. Ménard and A. Pignolet, J. Mater. Res., 2007, 22, 2102 Search PubMed.
- M. R. Suchomel, C. I. Thomas, M. Allix, M. J. Rosseinsky, A. M. Fogg and M. F. Thomas, Appl. Phys. Lett., 2007, 90, 112909 CrossRef.
- D. H. Kim, H. N. Lee, M. D. Biegalski and H. M. Christen, Appl. Phys. Lett., 2007, 91, 042906 CrossRef.
- R. Nechache, C. Harnagea, L. Carignan, O. Gautreau, L. Pintilie, M. P. Singh, D. Ménard, P. Fournier, M. Alexe and A. Pignolet, J. Appl. Phys., 2009, 105, 061621 Search PubMed.
- N. Ichikawa, M. Arai, Y. Imai, K. Hagiwara, H. Sakama, M. Azuma, Y. Shimakawa, M. Takano, Y. Kotaka, M. Yonetani, H. Fujisawa, M. Shimizu, K. Ishikawa and Y. Cho, Appl. Phys. Express, 2008, 1, 101302 Search PubMed.
- Y. Shimakawa, M. Azuma and N. Ichikawa, Materials, 2011, 4, 153 Search PubMed.
- R. Nechache, C. V. Cojocaru, C. Harnagea, C. Nauenheim, M. Nicklaus, A. Ruediger, F. Rosei and A. Pignolet, Adv. Mater., 2011, 23, 1724 Search PubMed.
- R. Q. Guo, L. Fang, W. Dong, F. G. Zheng and M. R. Shen, J. Mater. Chem., 2011, 21, 18645 RSC.
- T. J. Park, Y. B. Mao and S. S. Wong, Chem. Commun., 2004, 2708 RSC.
- X. Y. Zhang, C. W. Lai, X. Zhao, D. Y. Wang and J. Y. Dai, Appl. Phys. Lett., 2005, 87, 143102 CrossRef.
- X. Y. Zhang, J. Y. Dai and C. W. Lai, Prog. Solid State Chem., 2005, 33, 147 CrossRef CAS.
- B. Liu, B. B. Hu and Z. L. Du, Chem. Commun., 2011, 47, 8166 RSC.
- D. P. Dutta, O. D. Jayakumar, A. K. Tyagi, K. G. Girija, C. G. S. Pillai and G. Sharma, Nanoscale, 2010, 2, 1149 RSC.
- Y. B. Chen, PhD thesis, University of Michigan, 2008.
- http://www.analitex.com/ .
- M. Okada, Y. Neo, K. Kubomura and H. Mimura, J. J. Appl. Phys., 2006, 45, 5624 Search PubMed.
- J. S. Kasper and K. Lonsdale, International table for X-ray crystallography, Kynoch Press, 1959, vol. 2, p. 342 Search PubMed.
- T. Ogawa and H. Sato, J. Alloys Compd., 2004, 383, 313 Search PubMed.
- L. Miranda, J. Ramirez-Castellanos, M. Hernando, A. Varela, J. Gonzalez-Calbet and M. Parras, Eur. J. Inorg. Chem., 2007, 2129 Search PubMed.
- J. M. Dance, J. Darriet, A. Thessaud and P. Hagenmuller, Z. Anorg. Allg. Chem., 1984, 508, 93 CAS.
- D. B. Williams and C. B. Carter, Transmission electron microscopy: a textbook for materials Science, Plenum Press, New York, 2004, vol. 4 Search PubMed.
- L. Katz and R. Ward, Inorg. Chem., 1964, 3, 205 CrossRef CAS.
- L. Pauling, Nature of the chemical bond, Connell University Press,Ithaca, 1945 Search PubMed.
- R. W. G. Wyckoff, Crystal structures, Interscience,New York, 1948, vol. I Search PubMed.
- We estimate the BFCO's occupation proportion by the SEM (scanning electron microscope) picture of our sample, which is not shown here. The method is to analyze the color of each pixel in the SEM picture and to count the area of BFCO.
- G. Kresse and J. Hafner, Phys. Rev. B: Condens. Matter, 1993, 48, 13115 CrossRef CAS.
- G. Kresse and J. Furthmüller, Comput. Mater. Sci., 1996, 6, 15 CrossRef CAS.
- P. E. Blöchl, Phys. Rev. B: Condens. Matter, 1994, 50, 17953 CrossRef.
- G. Kresse and D. Joubert, Phys. Rev. B: Condens. Matter Mater. Phys., 1999, 59, 1758 CrossRef CAS.
- J. P. Perdew, K. Burke and M. Ernzerhof, Phys. Rev. Lett., 1996, 77, 3865 CrossRef CAS.
- S. L. Dudarev, G. A. Botton, S. Y. Savrasov, C. J. Humphreys and A. P. Sutton, Phys. Rev. B: Condens. Matter Mater. Phys., 1998, 57, 1505 CrossRef CAS.
- C. L. Yin, G. B. Li, T. N. Jin, J. L. Tao, J. W. Richardson, C. K. Loong, F. H. Liao and J. H. Lin, J. Alloys Compd., 2010, 489, 152 Search PubMed.
- The geometric structures were all plotted using VESTA, http://www.geocities.jp/kmo_mma/crystal/en/vesta.html.
- R. Søndenå, S. Stølen, P. Ravindran, T. Grande and N. L. Allan, Phys. Rev. B: Condens. Matter Mater. Phys., 2007, 75, 184105 Search PubMed.
- R. Søndenå, P. Ravindran, S. Stølen, T. Grande and M. Hanfland, Phys. Rev. B: Condens. Matter Mater. Phys., 2006, 74, 144102 Search PubMed.
- W. Tang, E. Sanville and G. Henkelman, J. Phys.: Condens. Matter, 2009, 21, 084204 CrossRef.
- O. Muller and R. Roy, The major ternary structural families, Springer-Verlag, New York, 1974 Search PubMed.
- G. S. Rohrer, Structure and bonding in crystalline materials, Cambridge University Press, Cambridge, 2001. The ionic radii are outlined on pages 521–525 and pages 5–7 in Ref. 19. The ionic radii of Bi3+, Fe3+, Cr3+ and O2− are 1.16, 0.785, 0.755 and 1.26 Å, respectively. In the Ba–Ru–O system, the radii of Ba and Ru are 1.50 and 0.76 Å, respectively.
- W. Tian, X. Q. Pan, M. K. Lee and C. B. Eom, Appl. Phys. Lett., 2000, 77, 1985 Search PubMed , and references therein.
- EBFCO is the total energy of BiFexCr(1−x) O3 per f.u. The EBi is only half the total energy of the Bi primitive cell, since each Bi primitive cell contains two Bi atoms. EFe and ECr are the total energies of Fe and Cr primitive cell respectively, since they both contain only one atom.
 is the total energy of a single oxygen molecular.
 - A. A. Belik, S. Iikubo, K. Kodama, N. Igawa, S. Shamoto and E. Takayama-Muromachi, Chem. Mater., 2008, 20, 3765 CrossRef CAS.
- C. Darie, C. Goujon, M. Bacia, H. Klein, P. Toulemonde, P. Bordet and E. Suard, Solid State Sci., 2010, 12, 660 Search PubMed.
| This journal is © The Royal Society of Chemistry 2012 |