Ammonia molecule rotation of pressure-induced phase transition in ammonia hemihydrates 2NH3·H2O
Chunli
Ma
a,
Fangfei
Li
a,
Qiang
Zhou
a,
Fengxian
Huang
a,
Jingshu
Wang
a,
Mingzhe
Zhang
a,
Zhongwu
Wang
b and
Qiliang
Cui
*a
aState Key Laboratory of Superhard Materials, Jilin University, Changchun, 130012, P. R. China. E-mail: cql@jlu.edu.cn
bCHESS, Wilson Laboratory, Cornell University, Ithaca, NY 14853 USA
First published on 27th April 2012
Abstract
High-pressure Raman scattering and synchrotron angle-dispersive X-ray diffraction studies have been performed on liquid ammonia hemihydrates (2NH3·H2O) at room temperature up to 41.0 GPa. The results demonstrate that liquid 2NH3·H2O transforms into a solid phase at 3.5 GPa. Upon increasing pressure, a solid-solid phase transition is observed at about 19.0 GPa. When pressure is increased up to 25.8 GPa, another solid-solid phase transition is obtained. The first solid-solid phase transition at about 19.0 GPa originates from the rotation of type II ammonia molecule via the O–H⋯N bond, and this phase transition is from orthorhombic to body-centered-cubic. High-pressure Raman scattering and X-ray diffraction results of 2NH3·H2O provide significant information for better understanding the physical properties of the ammonia–water binary system under extreme conditions, and further for the structure state of the outer planets and large satellites in the solar system.
Introduction
Water mixes with a variety of gases (such as methane, argon, nitrogen, et al.) to form clathrate hydrates, in which the guest molecules are confined in the hydrogen-bonded host water cages.1 However, ammonia hydrates including di-, mono- and hemihydrates display different structures from the aforementioned gas hydrates; both ammonia and water molecules are connected through H bonding to form novel cage structures.2 Therefore, the ammonia–water binary system contains homonuclear and heteronuclear hydrogen bonds, and it is the ideal model system to understand the bonding behaviors in far more complex biological molecules. Moreover, the realistic and richest components of the outer planets (Uranus and Neptune) and the satellites (Triton and Titan) are believed to be ice and ammonia,3–8 and the ammonia–water system is of great interest in the field of planetary science. Hence, the requirement for better understanding physicochemical and geophysical processes in the ammonia–water binary system has stimulated many studies on the structure and the phase diagram of stoichiometric ammonia hydrates.9–15The cosmochemical models suggest that ammonia dihydrate (NH3·2H2O) is the most likely solid phase to be found in the outer solar system,16 however, it has been shown that ammonia dihydrate is unstable and transforms into other phases under low pressure,13,17 equivalent to depths of a few hundred kilometers in a Titan-sized body. Upon heating to about 190 K at 550 MPa, the high-pressure ammonia dihydrate (ADH) phase II breaks down to ammonia monohydrate (AMH) phase II and ice II; another high-pressure ammonia dihydrate phase, ADH IV also breaks down to AMH and ice when heated at pressures of 3–6 GPa. And studies of ammonia monohydrate (NH3·H2O) have reported some intriguing structural information. The lattice parameters of AMH II are a = 18.8285(4) Å, b = 6.9415(2) Å, c = 6.8449(2) Å, and V = 894.61(3) Å3 with space group Pbca (Z = 16) at 502 MPa and 180 K. The structure is orientationally ordered by O–D⋯O, O–D⋯N, and N–D⋯O (D is deuterium) hydrogen bonds to form the characteristic sheets of tessellated pentagons, which stack along the a-axis and connected by N–D⋯O hydrogen bonds alone.10 The AMH VI structure stable above 6.5 GPa at 300 K has been determined from neutron diffraction data with lattice parameters a = 3.2727(2) Å in space group I![[4 with combining macron]](https://www.rsc.org/images/entities/char_0034_0304.gif) 3m;15 the water and ammonia molecules in the body-centered cubic symmetry arrange randomly and the structure can be stable to at least 150 GPa.18 Moreover, the discovery of AMH VI makes it is possible that the ultimate high-pressure phase is body-centered-cubic in many water mixtures.
3m;15 the water and ammonia molecules in the body-centered cubic symmetry arrange randomly and the structure can be stable to at least 150 GPa.18 Moreover, the discovery of AMH VI makes it is possible that the ultimate high-pressure phase is body-centered-cubic in many water mixtures.
However, the study of ammonia hemihydrates is limited to low temperature and ambient pressure. The infrared spectra and phase transitions of ammonia hemihydrates have reported information about many modes site splitting, multiple-site splitting, and unit-cell-group splitting,19,20 The heat capacities and thermodynamics properties of ammonia hemihydrates have been measured from 15 to 278 K, it is shown that ammonia hemihydrates close to zero entropy at low temperatures.21 The structural information of ammonia hemihydrates only have been obtained from X-ray studies at ambient pressure. Therefore, it is necessary to study ammonia hemihydrates by using various experimental methods. Combining the studies of ammonia di- and monohydrates, the research of ammonia hemihydrates will be able to comprehensively improve our understanding of the physical and chemical behaviors in ammonia–water binary system from the aspect of pressure-induced molecular structure changes. As the ammonia monohydrate may be of direct relevance to the internal dynamics of the large icy satellites in the outer solar system. The study of another stable ammonia hydrate, 2NH3·H2O, than NH3·H2O22 may raise new important possibilities for planetary modeling,12,15 and further to comprehend and explore the unknown physical consequences of the outer planets and large satellites in the solar system.
In this study, high-pressure Raman scattering and synchrotron angle-dispersive X-ray diffraction measurements were first performed on 2NH3·H2O up to pressure of 41.0 GPa at room temperature. We observed that there were three phase transitions for 2NH3·H2O: liquid-solid phase transition occurred at 3.5 GPa, the first solid-solid phase transition was presented at about 19.0 GPa and the second at 25.8 GPa. The solid-solid phase transition of 2NH3·H2O at about 19.0 GPa was from orthorhombic to body-centered-cubic arrangement.
Experiment
A mixture of liquid ammonia and deionized water at molar ratio 2![[thin space (1/6-em)]](https://www.rsc.org/images/entities/char_2009.gif) :
:![[thin space (1/6-em)]](https://www.rsc.org/images/entities/char_2009.gif) 1 were sealed in a stainless steel reactor with a PTFE lining at 220 K. Upon gradual warming to room temperature, the solution was shaken to reach a homogeneous state, and then stored in a refrigerator (256 K) for high pressure study. The sample together with one ruby ball was loaded into a gasketed high pressure diamond anvil cell (DAC) at low temperature. A 120 μm diameter hole was drilled at the center of a pre-indented 80 μm thickness T-301 stainless steel gasket to form a sample chamber. The pressure was calibrated by the ruby R1 fluorescence line.23 By monitoring the separation and the width of the ruby R1 and R2 lines, it could be confirmed that the experiments were performed under the quasi-hydrostatic condition.
1 were sealed in a stainless steel reactor with a PTFE lining at 220 K. Upon gradual warming to room temperature, the solution was shaken to reach a homogeneous state, and then stored in a refrigerator (256 K) for high pressure study. The sample together with one ruby ball was loaded into a gasketed high pressure diamond anvil cell (DAC) at low temperature. A 120 μm diameter hole was drilled at the center of a pre-indented 80 μm thickness T-301 stainless steel gasket to form a sample chamber. The pressure was calibrated by the ruby R1 fluorescence line.23 By monitoring the separation and the width of the ruby R1 and R2 lines, it could be confirmed that the experiments were performed under the quasi-hydrostatic condition.
High-pressure Raman scattering patterns were recorded at room temperature using an ActonSpct raPro 500i spectrometer with liquid nitrogen cooled CCD in backscattering geometry. The 532 nm excitation light was generated by a frequency-doubled diode-pumped Nd:vanadate laser (Coherent Company).24 The sample Raman spectra can be collected through an achromatic lens and then focused onto a CCD detector for visually monitoring during experiments.
High-pressure synchrotron angle-dispersive X-ray diffraction experiments were carried out at B2 station of Cornell High Energy Synchrotron Source (CHESS).25 The monochromatic X-ray beam was optimized at a wavelength of 0.4859 Å, and the exposure time for acquisition of each spectrum was 600 s. The sample to detector distance and geometric parameters were calibrated using a CeO2 standard sample. Using a FIT2D program, the raw X-ray diffraction images were reduced to the two-dimensional patterns with a plot of the intensity against 2θ angle. The analysis of XRD patterns at different pressures were performed by the Materials Studio Reflex program.
Results and discussion
The Raman spectra of 2NH3·H2O collected under different pressures up to 41.0 GPa at room temperature are shown in Fig. 1. Upon increasing pressure to 3.5 GPa, several new Raman peaks appear, especially the intermolecular vibration modes arising in the low frequency region; it thus indicates that the liquid 2NH3·H2O transforms into solid phase. At pressure of 19.1 GPa, the intermolecular vibrational modes (262.7 cm−1) display a noticeable discontinuity, and the Raman peak at 522.1 cm−1 and two N–H stretching modes at 3361.1 and 3391.4 cm−1 disappear, implying the occurrence of a solid-solid phase transition. When the pressure higher than 25.9 GPa, the intensity of Raman peak at 262.7 cm−1 gradually increases, and the second solid-solid phase transition may occur, accompanied by the appearance of new Raman peaks and disappearance of some old ones.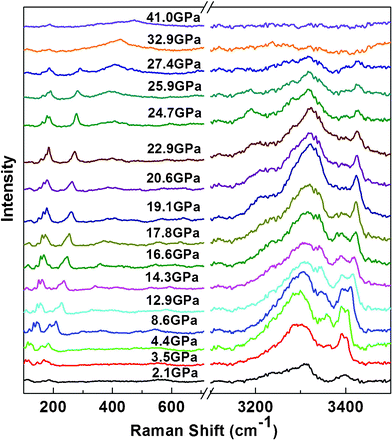 | ||
| Fig. 1 Raman spectra of 2NH3·H2O under different pressure up to 41.0 GPa at room temperature. | ||
In order to further illustrate the frequency shift of 2NH3·H2O under high pressure, Raman shifts as a function of pressure are exhibited in Fig. 2. It shows the pressure dependence of the external and internal Raman modes of 2NH3·H2O at room temperature. The liquid-solid phase transition at 3.5 GPa can be obviously observed by the appearance of some new Raman peaks. In the pressure region of 3.5 to 19.1 GPa, increasing pressure results in a blue shift of the external modes and the shift rates are different from one to another. It is well recognized that the enhancement of interaction strength between adjacent molecules shortens the intermolecular distance. The internal modes ranging from 3150 to 3450 cm−1 are assigned to the N–H stretching modes. The N–H stretching modes display a pressure-induced decrease of wavenumbers. In the hydrogen bond of A–H⋯B (A and B are electronegative atoms), while pressure is increased the distance from atoms A to B becomes smaller, and accordingly the electrostatic attraction of H⋯B becomes stronger. So the A–H distance becomes longer and causes a noticeable red shift with increasing pressure. When pressure is increased up to 19.1 GPa, the pressure dependence of the external mode at 262.7 cm−1 displays a smaller slope than that at lower pressure. At the same time, five modes including three external modes at 104.8 cm−1, 148.6 cm−1, 522.1 cm−1 and two N–H stretching modes at 3360.3 cm−1 and 3391.4 cm−1 disappear. These spectroscopic changes indicate that 2NH3·H2O undergoes a solid-solid phase transition at this pressure. The N–H stretching mode is related to the intermolecular interactions, so the disappearance of the N–H stretching mode upon phase transition indicates that the hydrogen bonding change most likely plays a critical role to the first high-pressure solid-solid phase transition of 2NH3·H2O. With the pressure higher than 25.9 GPa, a new Raman peak appears at 685.0 cm−1 and some low-frequency Raman peaks disappear, and also two Raman peaks at 3298 and 3402.5 cm−1 gradually vanish; all of these suggest that there is the second solid-solid phase transition at 25.9 GPa which is different from the first at 19.1 GPa.
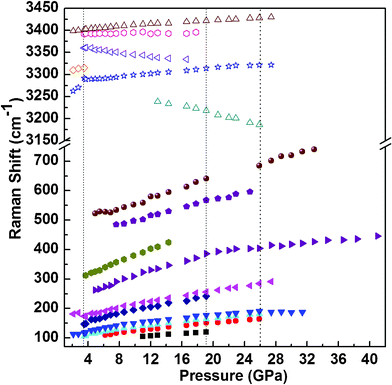 | ||
| Fig. 2 Pressure dependence of external and internal Raman modes of 2NH3·H2O at room temperature. Wavenumbers from 100 cm−1 to 3600 cm−1. The three vertical dot lines represent the different pressure points of phase transitions. | ||
To further confirm the formation of the three high-pressure phase transitions, synchrotron angle-dispersive X-ray diffraction measurements have also been performed on liquid 2NH3·H2O at a comparable pressure range of 3.1–36.0 GPa to the high-pressure Raman scattering study. Several typical XRD patterns collected under pressure are presented at Fig. 3. In the isotropic liquid 2NH3·H2O, X-ray diffraction peaks can't be obtained. At 4.3 GPa, five additional diffraction peaks appear, confirming the liquid-solid phase transition of 2NH3·H2O. Upon continuous pressurizing, all diffraction peaks shift to higher 2θ angles, indicating the reduction of unit cell volume. Between the pressure range of 4.3 and 19.0 GPa, the intensity of all diffraction peaks decreases with increasing pressure, implying there is no phase transition. When pressure is increased up to 19.6 GPa, the X-ray diffraction peaks as a function of pressure become discontinuous, which suggests a new solid-solid phase transition, and the only two observed X-ray diffraction peaks belong to this high-pressure solid phase. With the pressure increased up to 25.8 GPa, one additional diffraction peak starts to appear, the intensity of which becomes stronger with increasing pressure; meanwhile, the two nearby peaks dramatically change their relative intensity. Consequently, the second solid-solid phase transition of 2NH3·H2O at 25.8 GPa is confirmed from these high-pressure XRD results. The high-pressure phase transition of 2NH3·H2O can also be clearly shown from the d-spacing as a function of pressure in Fig. 4. It displays an obvious discontinuity at 19.6 GPa and only two X-ray diffraction peaks are retained, which confirm the first solid-solid phase transition. The second solid-solid phase transition is explicitly exhibited by three d-spacings as a function of pressure at 25.8 GPa.
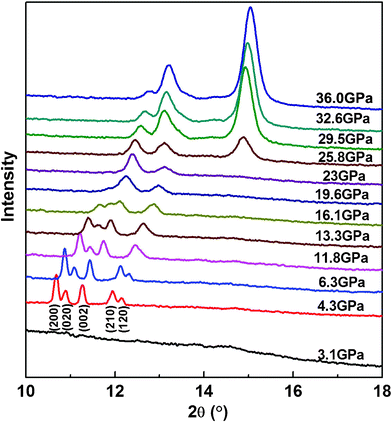 | ||
| Fig. 3 High-pressure angle-dispersive synchrotron X-ray diffraction patterns of 2NH3·H2O with increasing pressure up to 36.0 GPa, collected at room temperature with incident wavelength λ = 0.4859 Å. The numbers in brackets (hkl) under XRD pattern of 4.3 GPa are Miller indexes of 2NH3·H2O. | ||
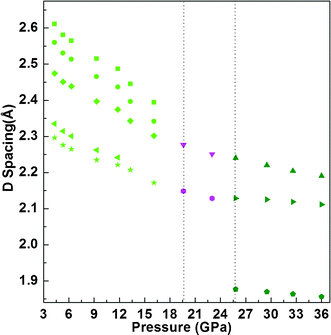 | ||
| Fig. 4 d-Spacings change of 2NH3·H2O as a function of pressure. When pressure is higher than 19.6 GPa, the d-spacings of 2NH3·H2O belong to another solid phase. The vertical dot line placed in 19.6 GPa clearly show the phase transition pressure. At 25.8 GPa, the vertical dot line has the same function as 19.6 GPa. | ||
The Pawley refinement results of 2NH3·H2O X-ray diffraction pattern is shown in Fig. 5. The solid phase of 2NH3·H2O crystallized at 4.3 GPa has an orthorhombic symmetry with Pnma space group (D162h, Z = 4). This phase contains two types of ammonia molecule structures. The type I ammonia molecule structure involves interaction of one NH3 and four H2O molecules in terms of the formation three N–H⋯O bonds and one O–H⋯N bond. In the type II ammonia molecule structure, only N interacts with one water molecule to form a single O–H⋯N bond.20,21 Combining high-pressure Raman and X-ray diffraction results together, the changes at about 19.0 and 25.8 GPa are two independent structural phase transitions. However, the structure of these two high-pressure solid phases higher than 19.0 GPa cannot be determined by relying on only two or three diffraction peaks in the high-pressure X-ray diffraction results. Nevertheless, from the results of XRD patterns of 2NH3·H2O at different pressures in Fig. 3, it can be observed that three X-ray diffraction peaks (200), (020) and (002) of orthorhombic symmetry merge into one diffraction peak at 19.6 GPa. According to the general characteristic of the crystal structural symmetry changes, and the discovery of body-centered-cubic structure of AMH VI,15 which is hydrogen-bonded and can be stable to a very high pressure,18 indicating that the solid-solid phase transition of 2NH3·H2O at about 19.0 GPa is orthorhombic to cubic.
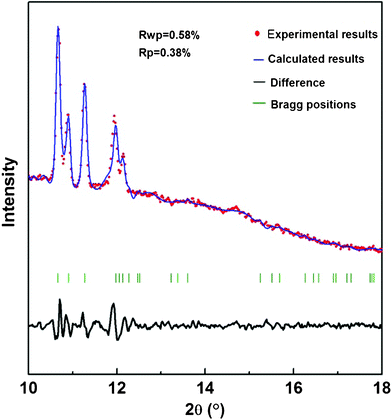 | ||
| Fig. 5 The Pawley refinement results of the solid 2NH3·H2O phase at 4.3 GPa and room temperature, which show an orthorhombic symmetry. The experimental and calculated results fit each other well, with Rwp = 0.58%, Rp = 0.38%, and the difference is labeled on the bottom. In addition, green vertical bars are presented to index the position of calculated diffraction peaks. | ||
Through the analysis of infrared spectra results of 2NH3·H2O at low temperature,26 it can be suggested that the orientation of type II ammonia molecules preserve the symmetry plane in the solid phase of 2NH3·H2O between 3.5 to ∼19.0 GPa. When pressure is increased higher than 19.0 GPa, series of intermolecular interactions resulted in a significant increase of free energy, the O–H⋯N (Type II) in 2NH3·H2O is not rigid enough to maintain the low pressure solid phase structural stability. Application of pressure strengthens the hydrogen bonding interactions.27 Alternatively, the thermodynamic balance can be reasonably compromised by a rotation of type II ammonia molecule via the O–H⋯N bond to reduce the free energy. Therefore, it results in the first solid-solid phase transition of 2NH3·H2O around 19.0 GPa, and is observed by Raman and X-ray diffraction under high pressure and room temperature conditions. The structure of ammonia monohydrate (NH3·H2O) phase I and phase II have been determined by employing ab initio calculations.10,11 Isothermal high-pressure high-resolution neutron powder diffraction studies show that the ammonia monohydrate transforms from phase I into phase II at low temperature and pressure (180 K and 0.351 GPa).14 In the range of 0–9 GPa and 170–300 K, several ammonia dihydrate (NH3·2H2O) phases are investigated by using neutron powder diffraction.13,14,28 All of these solid-solid phase transitions have an intimate relationship with temperature and pressure. Therefore, the high-pressure solid-solid phase transition at about 19.0 GPa and room temperature is similar to the phase transition of ammonia hemihydrate (2NH3·H2O) which is observed at low temperature.16,21
Conclusion
In summary, high-pressure Raman scattering and synchrotron angle-dispersive X-ray diffraction measurements were performed to study the pressure-induced phenomena of liquid 2NH3·H2O at room temperature. Liquid 2NH3·H2O transformed into a solid phase at 3.5 GPa, and then two solid-solid phase transitions occurred at about 19.0 and 25.8 GPa. The first high-pressure solid-solid phase transition at about 19.0 GPa was achieved through the rotation of type II ammonia molecule via O–H⋯N bond, and the structure maybe from orthorhombic to body-centered-cubic symmetry. The research of ammonia hemihydrates by using high-pressure Raman scattering and synchrotron angle-dispersive X-ray diffraction techniques provides significant information for better understanding of the physics of the ammonia–water binary system under extreme conditions from the changes of pressure-induced molecular structure, and it will be applicable to construct feasible phase diagrams for the unresolved questions of the outer planets and large satellites in the solar system.Acknowledgements
This work was supported financially by the National Natural Science Foundation of China (Grant Nos. 91014004, 10574054 and 11004074), Specialized Research Fund for the Doctoral Program of Higher Education (Grant No. 20100061120093) and the National Basic Research Program of China (Grant No. 2011CB808200). CHESS is supported by NSF and NIH/NIGMS through a NSF award DMR-0936384.References
- J. S. Loveday and R. J. Nelmes, Phys. Chem. Chem. Phys., 2008, 10, 937 RSC.
- J. S. Loveday and R. J. Nelmes, High Pressure Res., 2004, 24, 45 CrossRef CAS.
- W. B. Hubbard, Science, 1981, 214, 145 CAS.
- J. I. Lunine and D. J. Stephenson, Icarus, 1987, 70, 61 CrossRef CAS.
- J. S. Lewis, Icarus, 1971, 15, 174 CrossRef CAS.
- J. S. Lewis, Icarus, 1972, 16, 241 CrossRef CAS.
- J. S. Lewis and R. G. Prinn, Astrophys. J., 1980, 238, 357 CrossRef CAS.
- R. G. Prinn and B. Fegley Jr., Astrophys. J., 1981, 249, 308 CrossRef CAS.
- C. Cavazzoni, G. L. Chiarotti, S. Scandolo, E. Tosatti, M. Bemasconi and M. Parrinello, Science, 1999, 283, 44 CrossRef CAS.
- A. D. Fortes, E. Suard, M.-H. Lemée-Cailleau, C. J. Pickard and R. J. Needs, J. Am. Chem. Soc., 2009, 131, 13508 CrossRef CAS.
- A. D. Fortes, J. P. Brodholt, I. G. Wood, L. VoČadlo and D. B. Jenkins, J. Chem. Phys., 2001, 115, 7006 CrossRef CAS.
- A. D. Fortes, E. Suard, M.-H. Lemée-Cailleau, C. J. Pickard and R. J. Needs, J. Chem. Phys., 2009, 131, 154503 CrossRef.
- A. D. Fortes, I. G. Wood, M. Alfredsson, L. Vǒcadlo, K. S. Knight, W. G. Marshall, M. G. Tucker and F. Fernandez-Alonso, High Pressure Res., 2007, 27, 201 CrossRef CAS.
- A. D. Fortes, I. G. Wood, J. P. Brodholt, M. Alfredsson, L. VoČadlo, G. S. McGrady and K. S. Knight, J. Chem. Phys., 2003, 119, 10806 CrossRef CAS.
- J. S. Loveday and R. J. Nelmes, Phys. Rev. Lett., 1999, 83, 4329 CrossRef CAS.
- A. D. Fortes, I. G. Wood, J. P. Brodholt and L. VoČadlo, Icarus, 2003, 162, 59 CrossRef CAS.
- A. D. Fortes, I. G. Wood, L. VǑcadlo, K. S. Knight, W. G. Marshall, M. G. Tucker and F. Fernandez-Alonso, J. Appl. Crystallogr., 2009, 42, 846 CAS.
- P. Loubeyre, R. LeToullec, E. Wolanin, M. Hanfland and D. Hausermann, Nature, 1999, 397, 503 CrossRef CAS.
- J. E. Bertie and J. P. Devlin, J. Chem. Phys., 1984, 81, 1559 CrossRef CAS.
- J. E. Bertie and M. M. Morrison, J. Chem. Phys., 1980, 73, 4832 CrossRef CAS.
- D. L. Hildenbrand and W. F. Giauque, J. Am. Chem. Soc., 1953, 75, 2811 CrossRef.
- W. J. Siemons and D. H. Templeton, Acta Crystallogr., 1954, 7, 194 CrossRef CAS.
- H. K. Mao, J. Xu and P. M. Bell, J. Geophys. Res., 1986, 91, 4673 CrossRef CAS.
- R. Jia, Q. L. Cui and F. F. Li, J. Light Scattering, 2008, 20, 212 Search PubMed.
- Z. W. Wang, O. Chen, C. Y. Cao, K. Finkelstein, D. M. Smilgies, X. Lu and W. A. Bassett, Rev. Sci. Instrum., 2010, 81, 093902 CrossRef.
- J. E. Bertie and M. M. Morrison, J. Chem. Phys., 1981, 74, 4361 CrossRef CAS.
- K. Wang, D. F. Duan, R. Wang, D. Liu, L. Y. Tang, T. Cui, B. B. Liu, Q. L. Cui, J. Liu, B. Zou and G. T. Zou, J. Phys. Chem. B, 2009, 113, 14719 CrossRef CAS.
- J. E. Bertie and M. R. Shehata, J. Chem. Phys., 1984, 81, 27 CrossRef CAS.
| This journal is © The Royal Society of Chemistry 2012 |
